
Demonstration
(Practical demonstration of how Cathodic Protection works)
What is corrosion
The first part of this demonstration shows that corrosion is an electro-chemical reaction that can be controlled through the electrical component. The Alexander Cell is a corrosion cell that allows the corrosion reaction to be seen.
The type of corrosion that is shown here is common in the pipeline industry and is known as 'interference'.
Interference current influences the potential of the electrolyte and has an effect on the 'open circuit measurements' that are used to monitor corrosion.
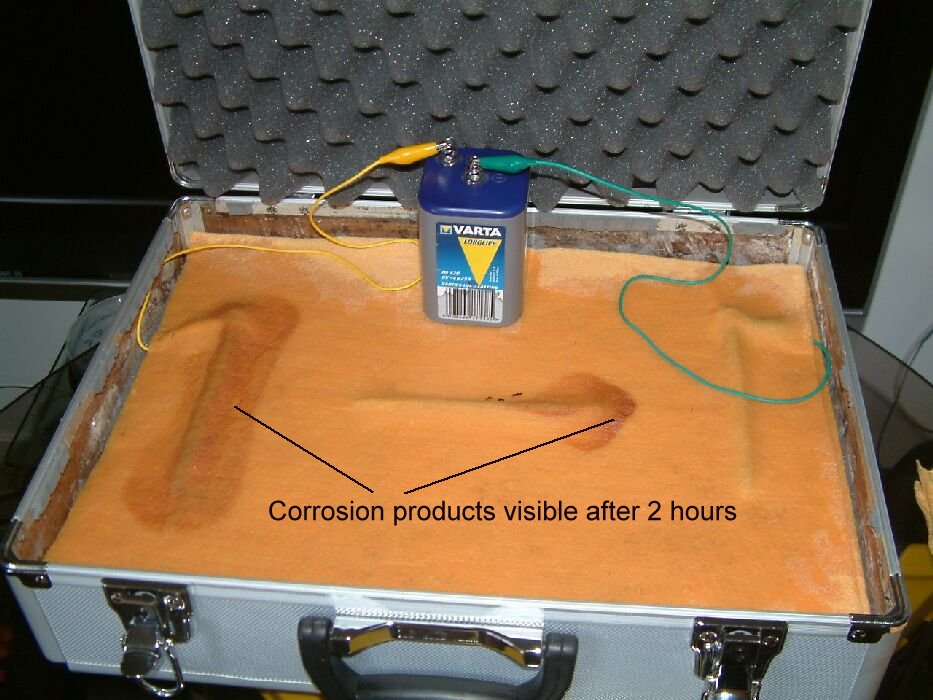
This first demonstration piece shows the flow of direct electrical current passing through the electrolyte in 'open circuit' and causing corrosion where it leaves the conductive metal. It also shows how current flowing on to metal stops corrosion by making it cathodic while current flowing from the metal accelerates the corrosion leaving visible corrosion products within 2 hours.
Three six inch, mild steel nails are placed in between two layers of absorbent cloth.
The positive pole of a six volt dry-cell battery is connected to the nail on the left hand side of the cloth and the negative pole connected to the right hand nail.
Water is poured onto the cloth to lower the electrical resistance between the two nails connected to the battery. (The water disolves the salts in the cloth and makes better contact with the metal)
The current driven from the battery passes to the nail on the left and then into the cloth. It takes the least line of resistance to the nail connected to the negative pole of the battery which is on the right hand side.
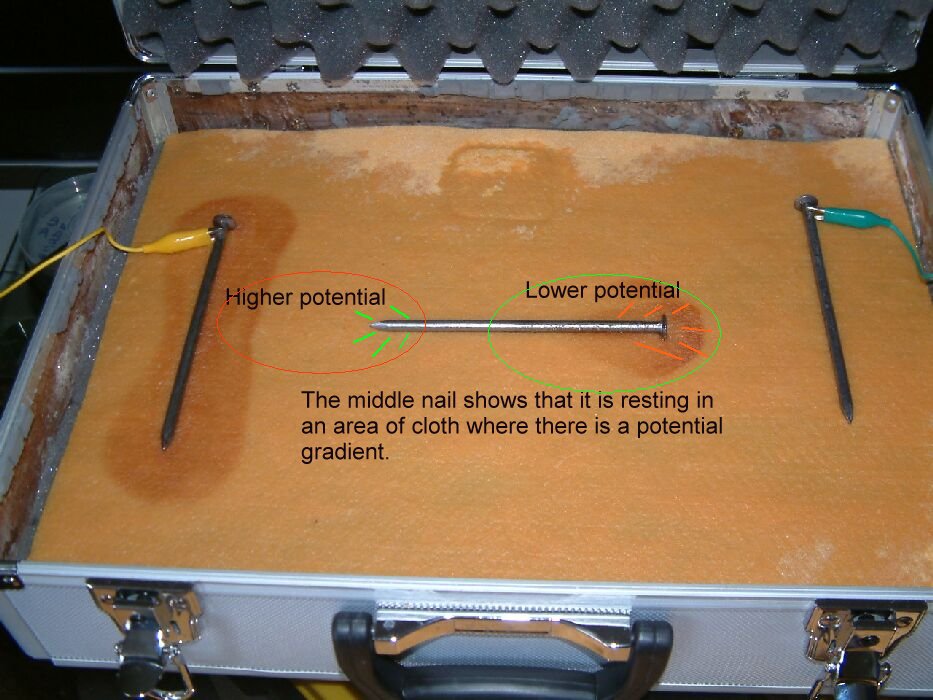
The nail in the centre represents a path of lower resistance between the outer two nails and some of the current passes onto the centre nail at its left end and from the centre nail at its right hand end.
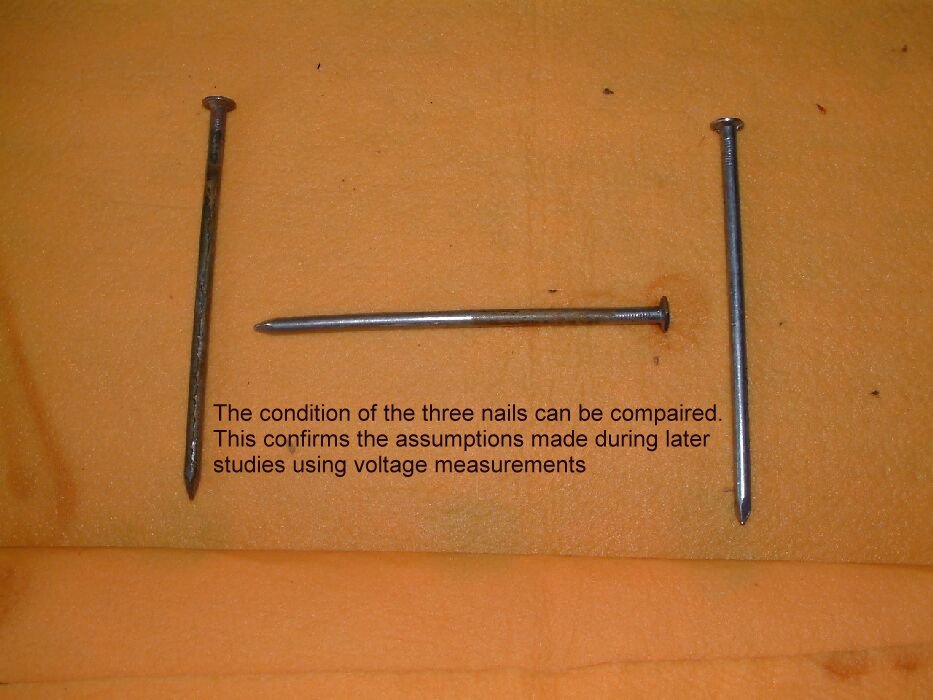
After three hours corrosion products are clearly visible in the predicted zones as seen in the picture below.
The presence of these corrosion products removes any need for scientific theory to support the readings that are taken during the period of the whole demonstration.
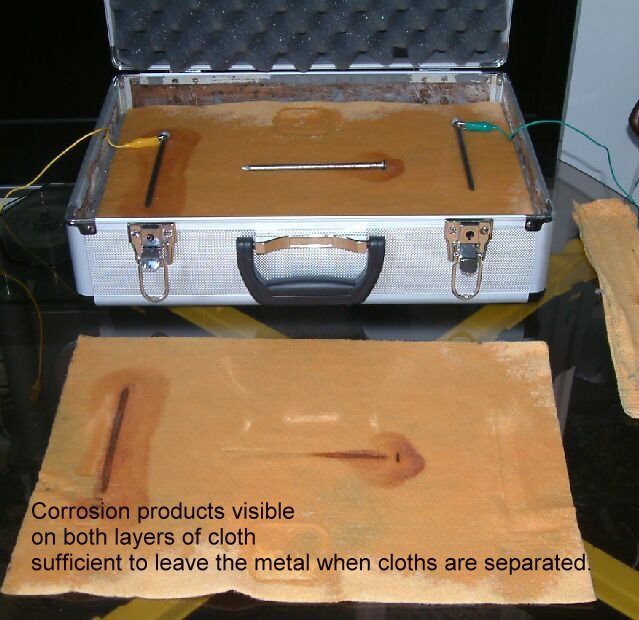
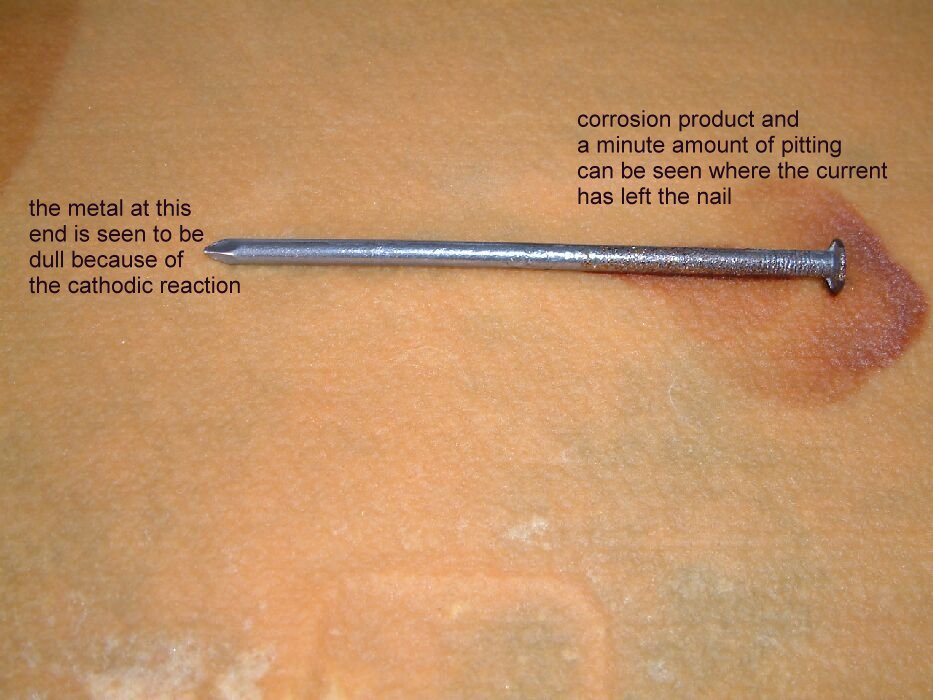
The picture below shows the corrosion product and the corrosion itself on the nails. It also shows the cathodicly protected nail to be bright and shiny with no sign of corrosion.
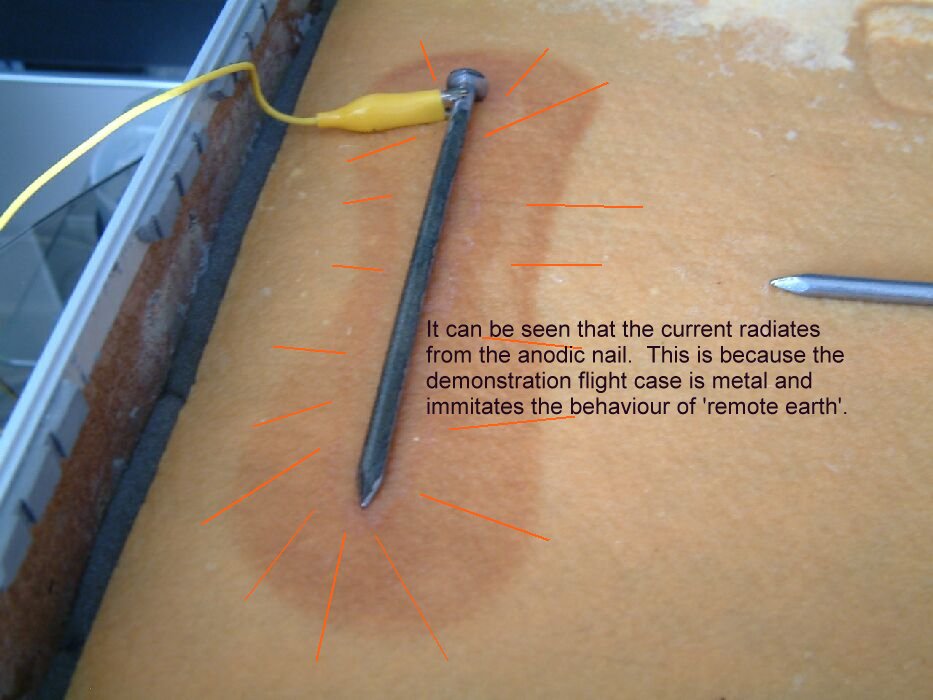
The nail on the left shows accelerated corrosion in the way that occurs to any anodic area which is subject to stray current discharge to the electrolyte.
The nail in the centre shows the same type of damage as is seen on pipelines that are subject to accellerated corrosion due to interference currents.
Interference damage is commonly caused by the cathodic protection systems of a single pipeline operating company being out of balance due to the misunderstandings within the cathodic protection industry.
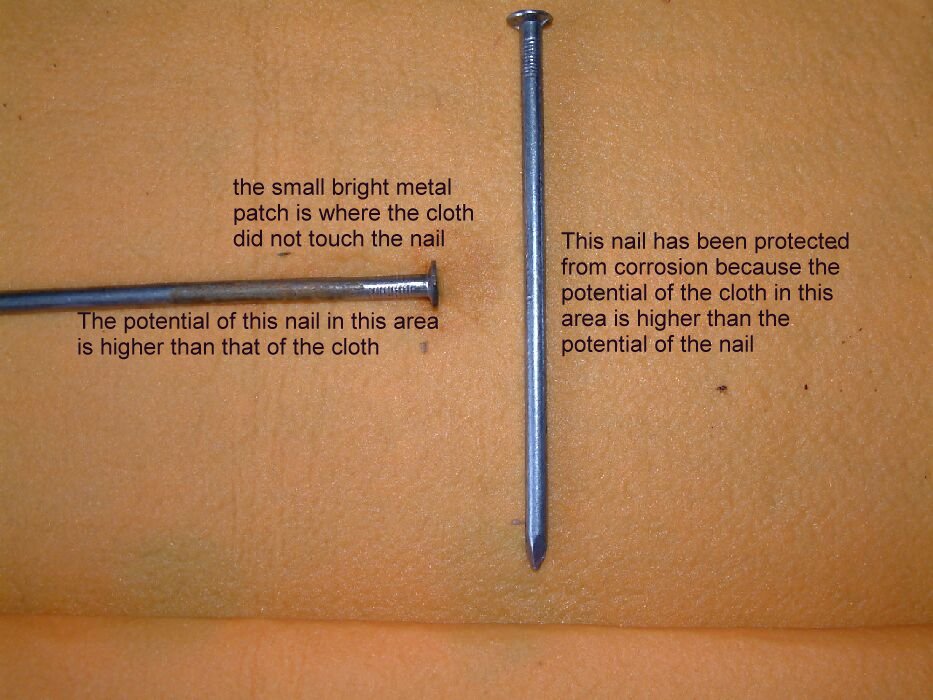
The nail in the centre is seen here to have corroded at the end closest to the cathodicly protected nail. The small shiny area is where there was no contact with the electrolyte.
The nails have been moved and put in their relative positions to show the corrosion to the predicted areas.
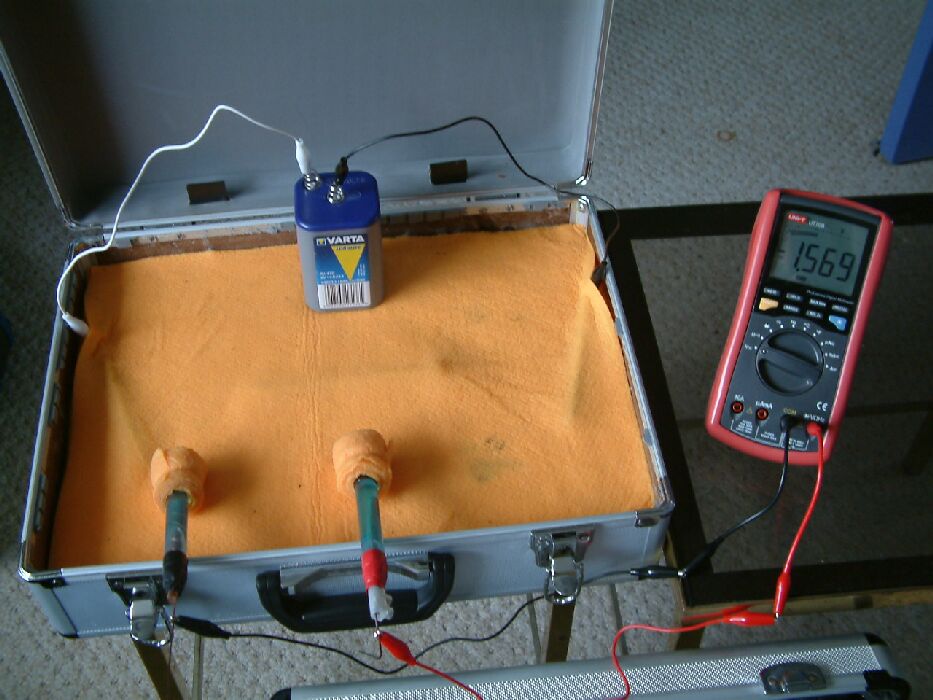
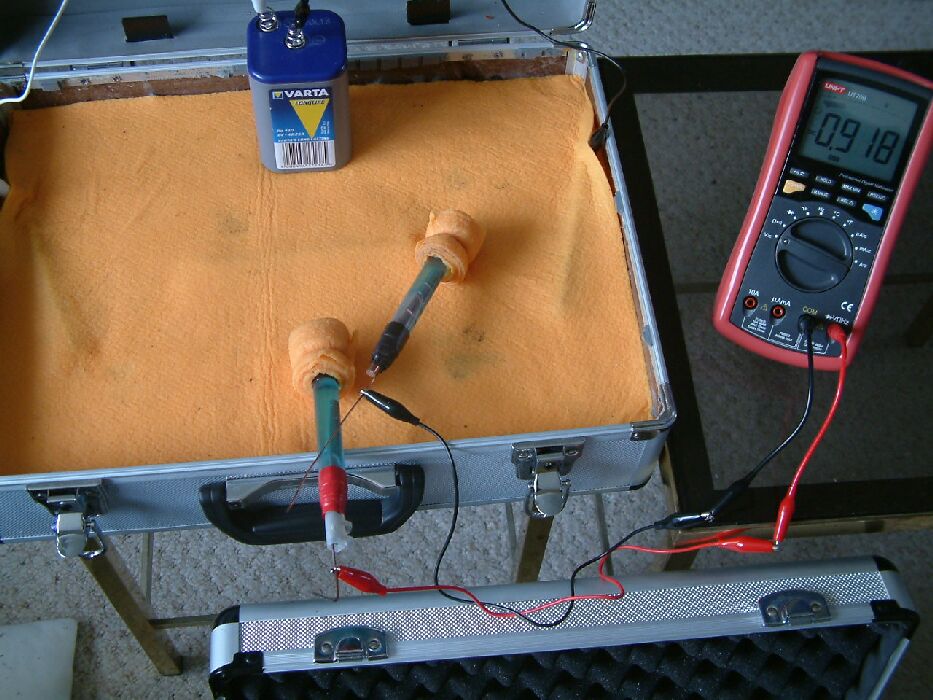
During the three hours that it takes for the corrosion products to become visible, measurments are carried out using a multimeter, probes and copper/copper-sulphate electrodes.
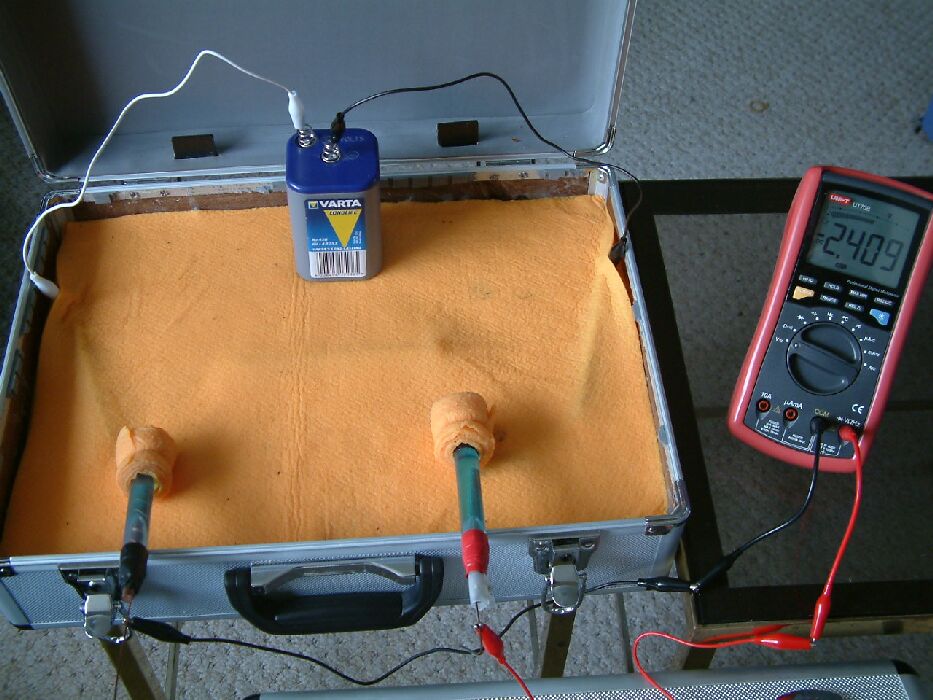
This picture shows the multimeter connected between two 'half-cells'. These are copper rods in a saturated solution of copper sulphate.
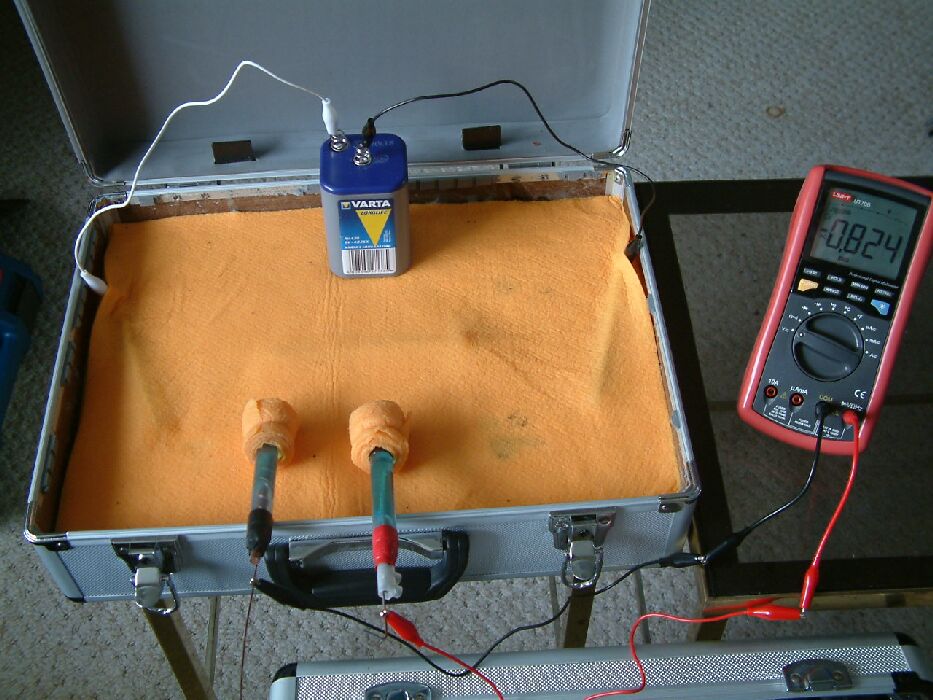
The positions of the Cu/CuSO4 electrodes have been altered in this picture and it can be seen that the reading on the multimeter has changed.
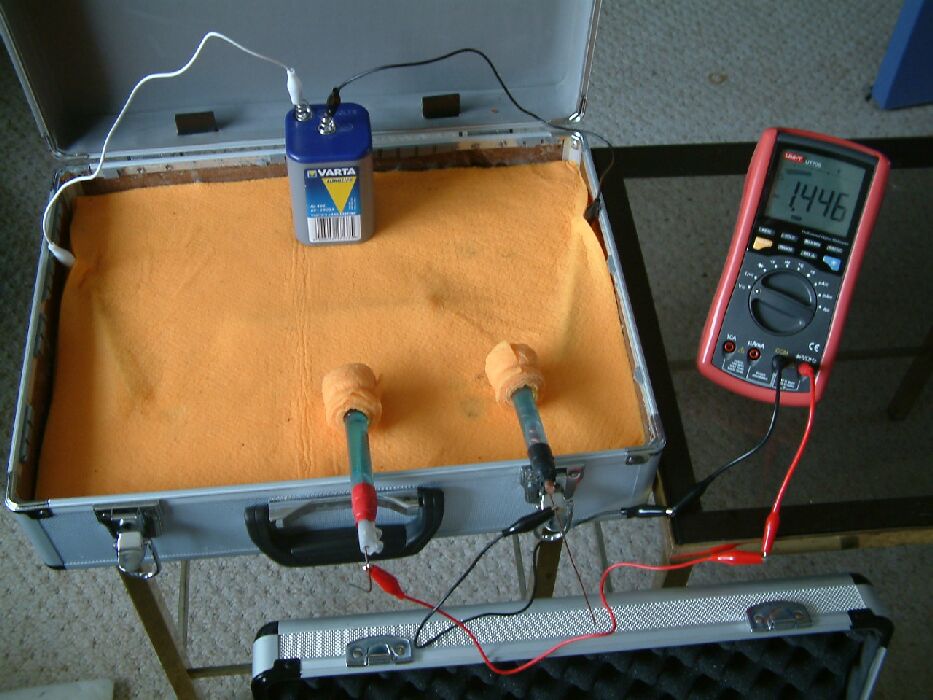
The positions of the two electrodes have been changed again and it can be seen that they are closer together this time. The reading on the multimeter can be seen to be less that the previous reading and this is because the potential of the wet cloth under each electrode is closer in value to that under the other.
Voltage is the difference between two potentials any survey measuring the difference between two identical electrodes is displaying the difference between the potential of the contact points and not a difference between the reaction potentials within the electrodes. The contours resulting from plotting this type of survey are correctly called isopotential lines and the method of defining these lines is a potential gradient survey.
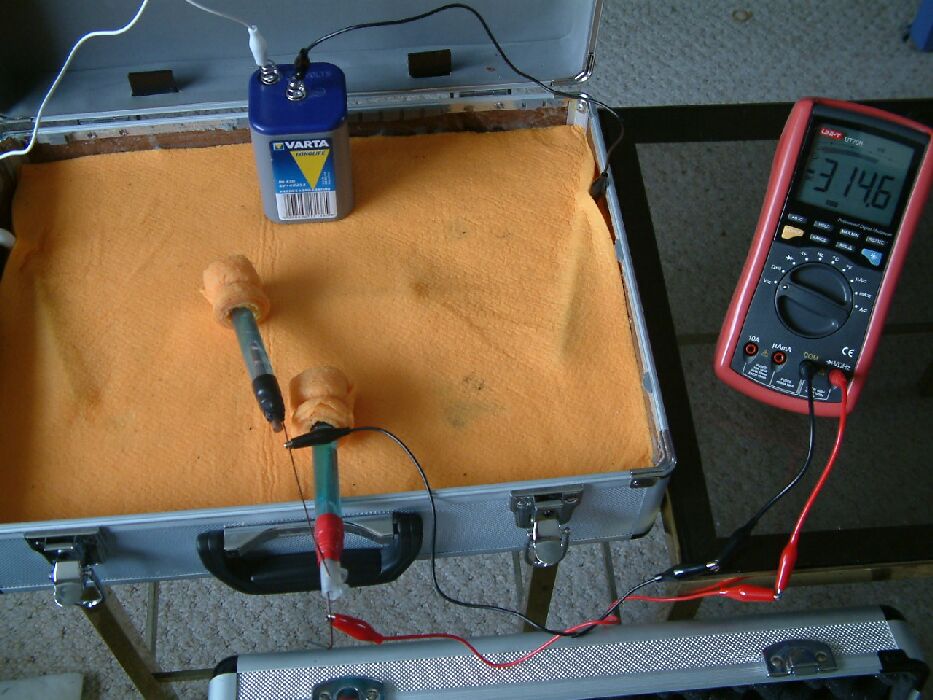
It can be seen by the variety of readings shown in these pictures that it is possible to plot the isopotential lines all over the cloth and discover the path of the direct current from the right hand nail to the left.
These experiments can be repeated on any pipeline wayleave and confirm beyond doubt that a copper/copper-sulphate electrode cannot be regarded as a 'reference potential' when the plotting cathodic protection voltages in the traditional way. The DCVG survey begs the question 'which of the two electrodes is the reference?'.
The fact that the copper/copper-sulphate electrode, or 'half-cell', cannot be used as a reference has posed a serious problem for the designers of cathodic protection systems. It was thought that the errors could be eliminated by switching off the CP Current and that process has occupied the CP experts for many years
Click here to go to the next demonstration page