
Demonstration Part Two
(Practical demonstration of how Cathodic Protection works)
Showing the limitations of current survey techniques
and errors that make analysis of the data innacurate
The second part of this demonstration uses a valid model of two coated steel pipelines.
Each has a 'test post' allowing electrical contact in the same way as a normal steel pipeline.
Two coating faults have been made in the bottom of each pipeline for experimental effect.
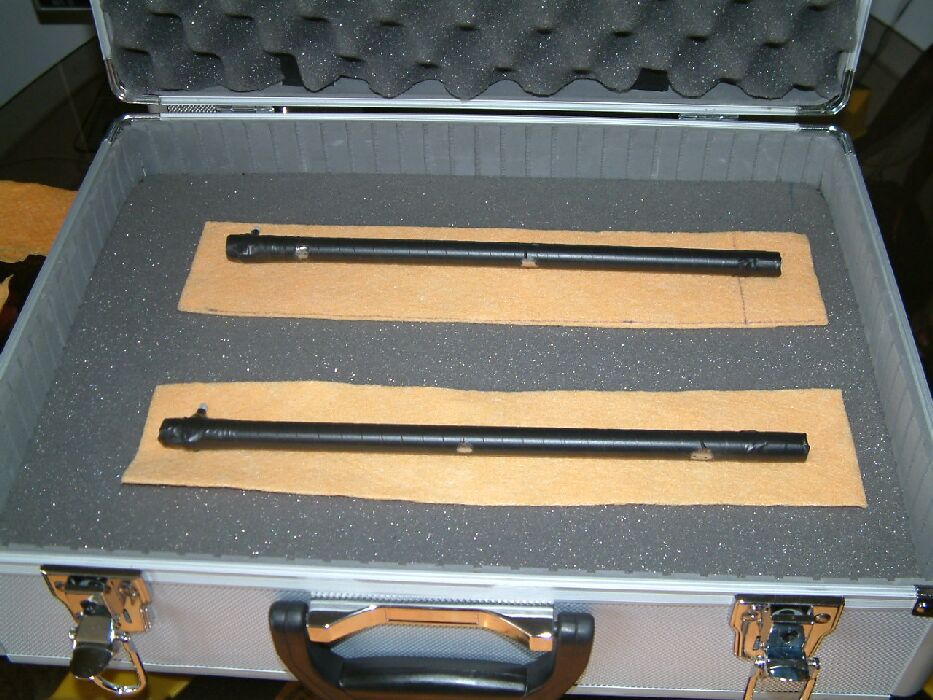
The pipes are set in super-absorbent material set in sponge and the whole arrangement is designed to replicate the electrical scenario of a real pipeline.
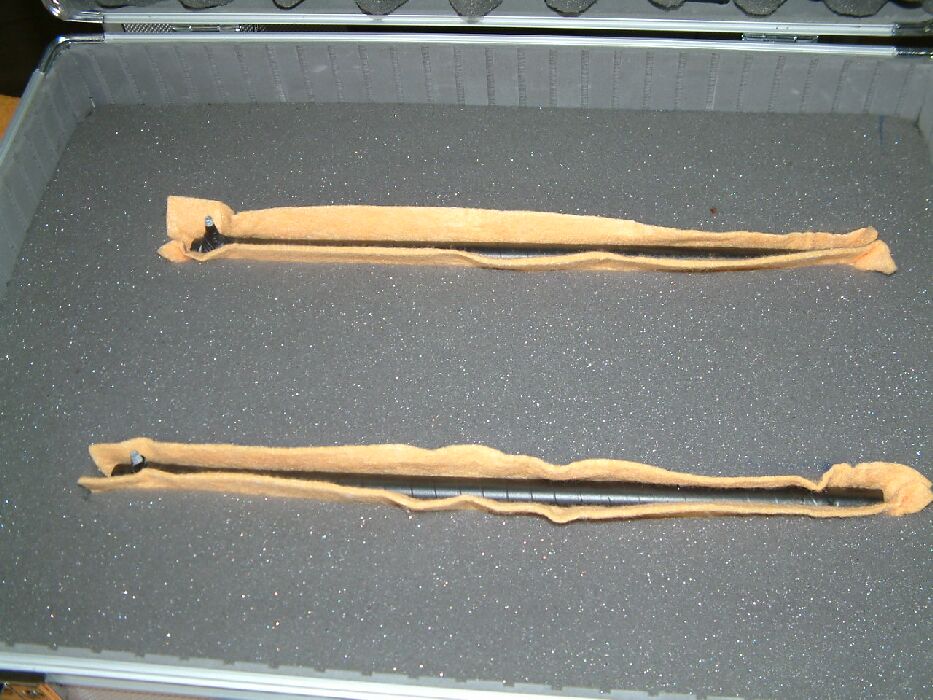
They are pushed into the sponge so that they are surrounded by the absorbent material in the same way that a real pipeline is backfilled with selective material.
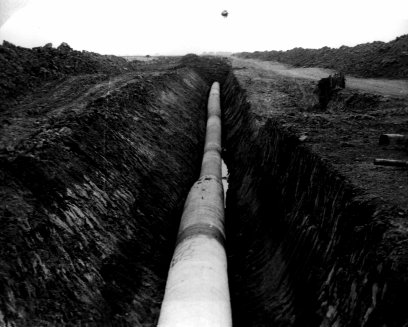
On a pipeline 'wayleave' the ground is re-instated to its original state.

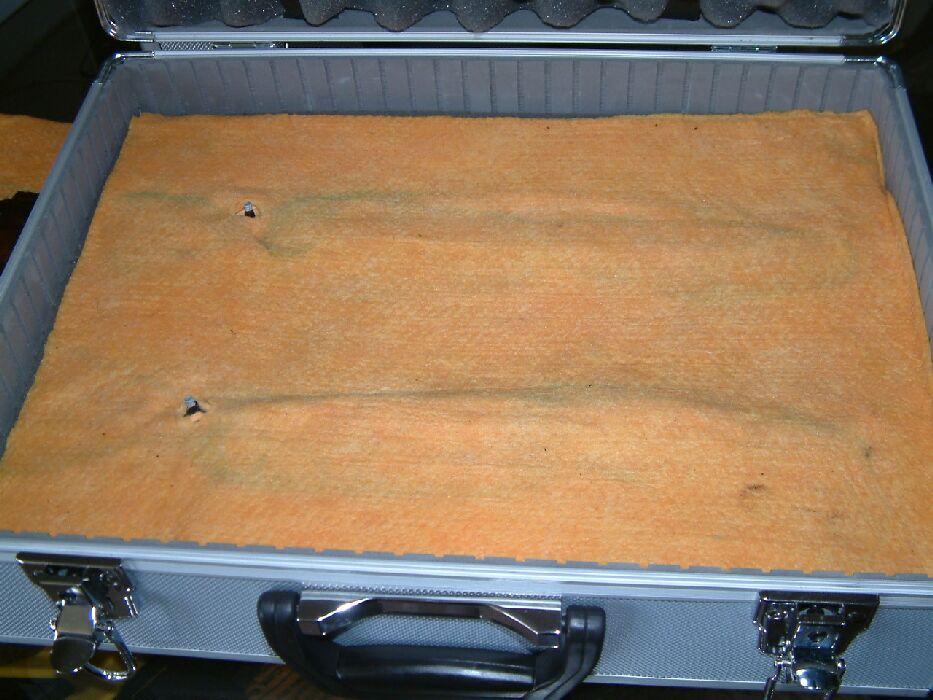
This is immitated by the covering of wet super-absorbant material that will conduct the cathodic protection current in the same way as in the field.
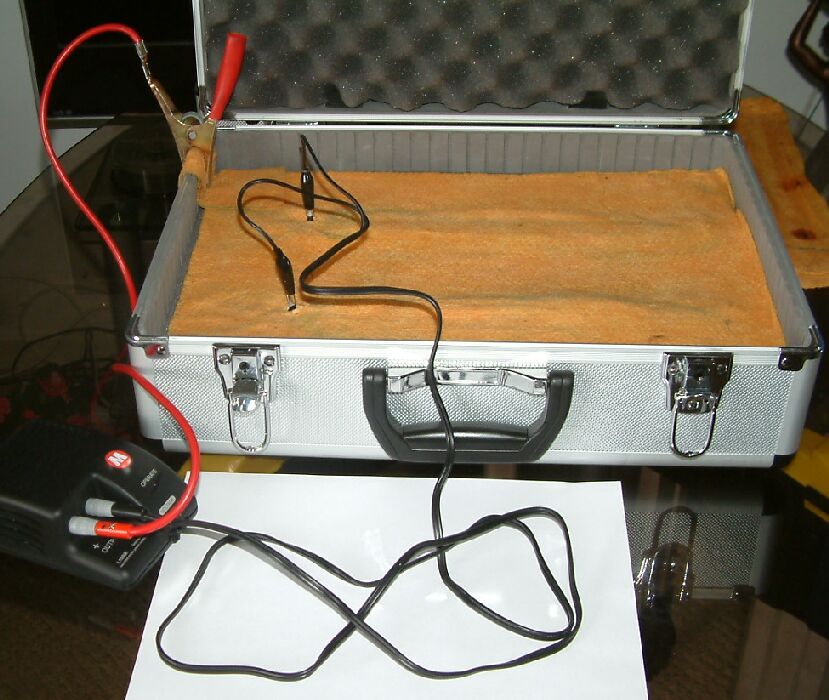
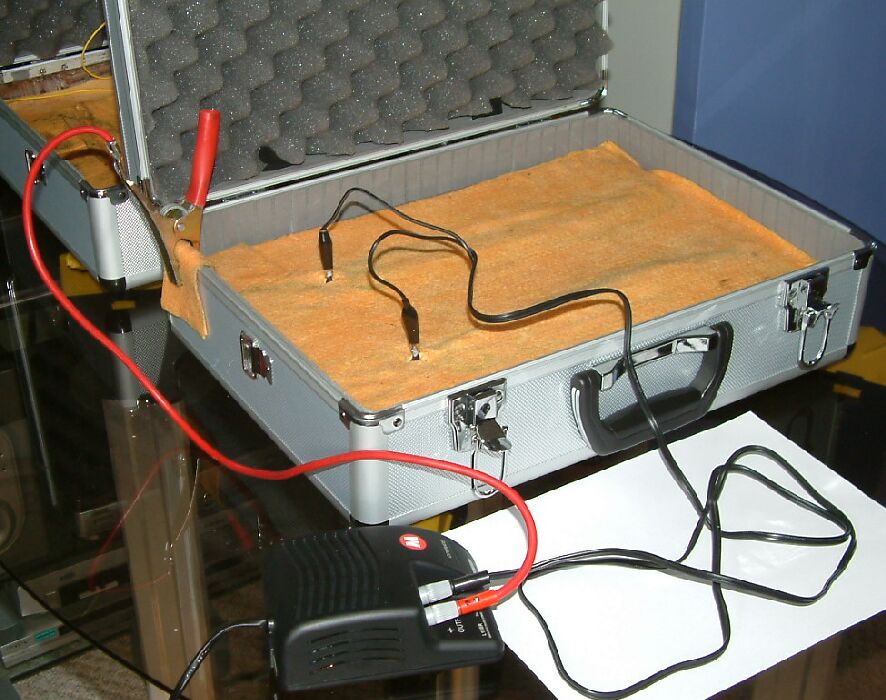
A transformer/rectifier is connected to the pipelines in the same way that a real pipeline cathodic protection system is installed. The metal flight case represents 'remote earth' to simulate the effects of a well-constructed, cathodic protection, impressed current groundbed.
It should be noted that the positive connection of the TR is clamped to the metal case over a damp cloth which is continuous with the 'backfill' cloth.
Similar readings can be obtained from this model to those that are seen in field surveys. In fact this model can be taken to the field and connected to any existing cathodic protection system.
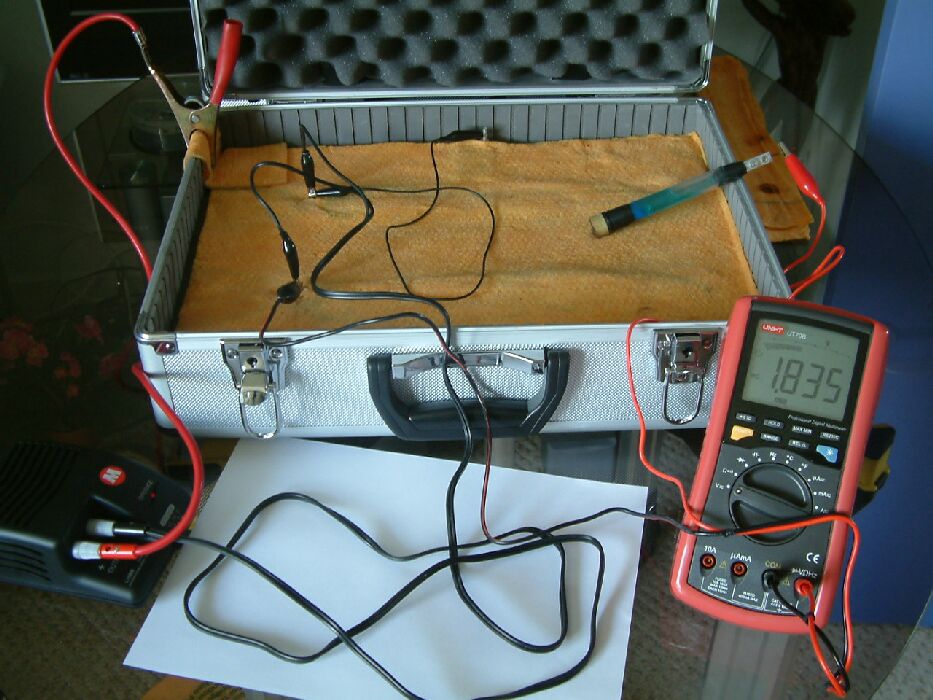
It can be seen, in the picture above, that the multimeter is connected between the pipeline test post and a 'half cell' placed in contact with the electrolyte in which the pipeline is buried. In this position the meter shows that there is a potential difference between the pipeline metal and the 'half cell' of 1.835 volts
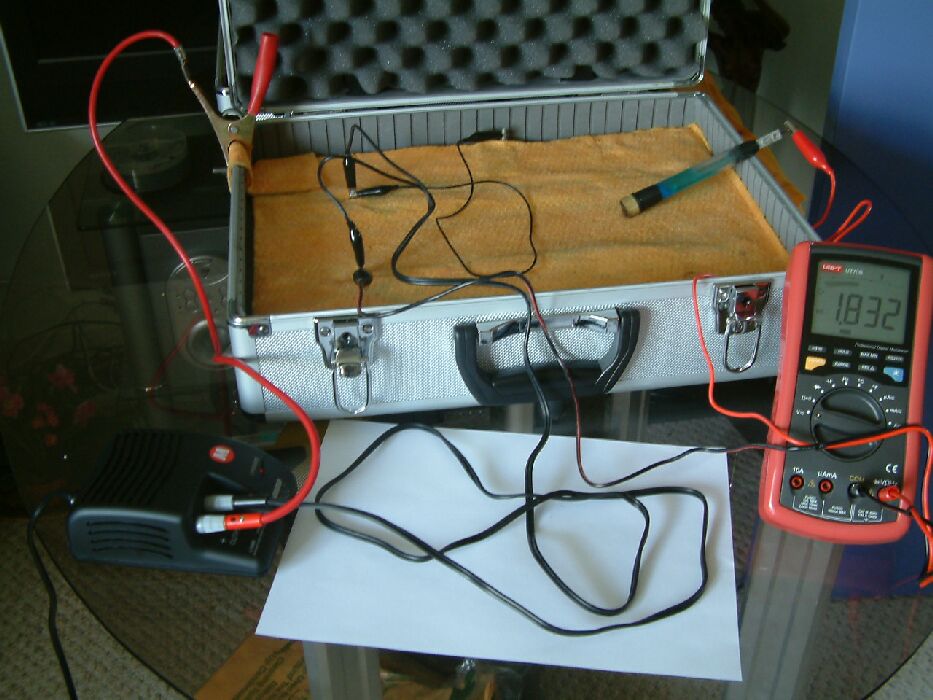
In the next picture the value is 1.832 volts and nothing else has changed.
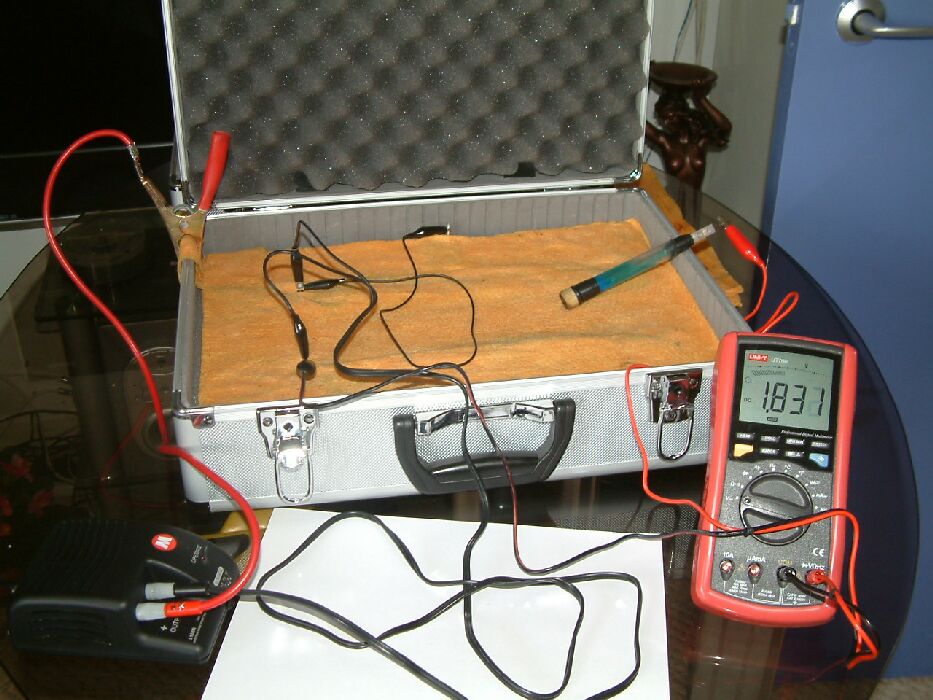
The reading reduces to 1.831 volts.
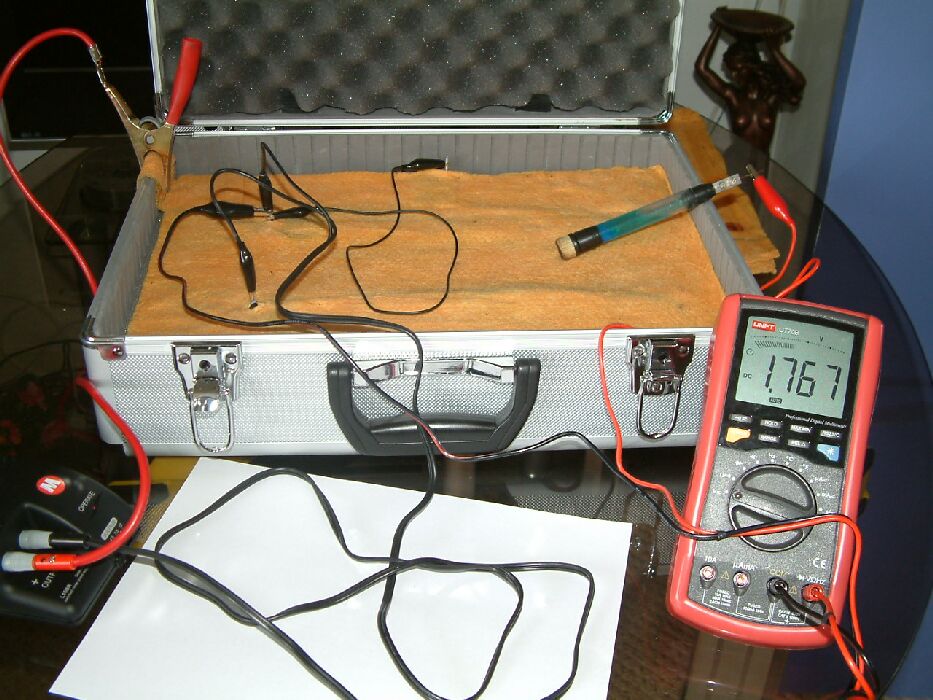
and then to 1.767 volts. Nothing has been altered and the value of the reading reduces slightly due to the change of the potential of the electrolyte on which the electrode is placed. We know this to be so as the reaction of copper to copper sulphate is constant. This shows that it is worth using a half-cell as a means to contact the electrolyte as a metal probe would have it's own (undefined) reaction to the chemicals in that electrolyte. this would introduce another variable into the measuring circuit.
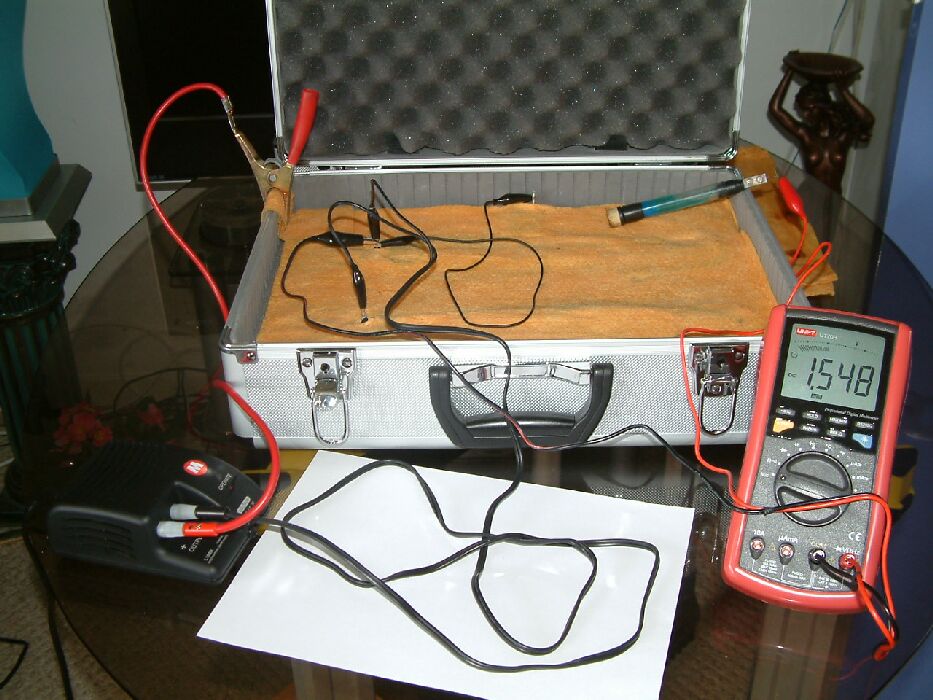
In the next picture, the position of the half-cell has been changed. It has been placed closed to a coupon of steel that is in contact with the pipeline metal. The potential of the electrolyte at this point is lower than the previous point of contact because of the 'potential gradient' caused by the cathodic protection current passing onto the coupon.
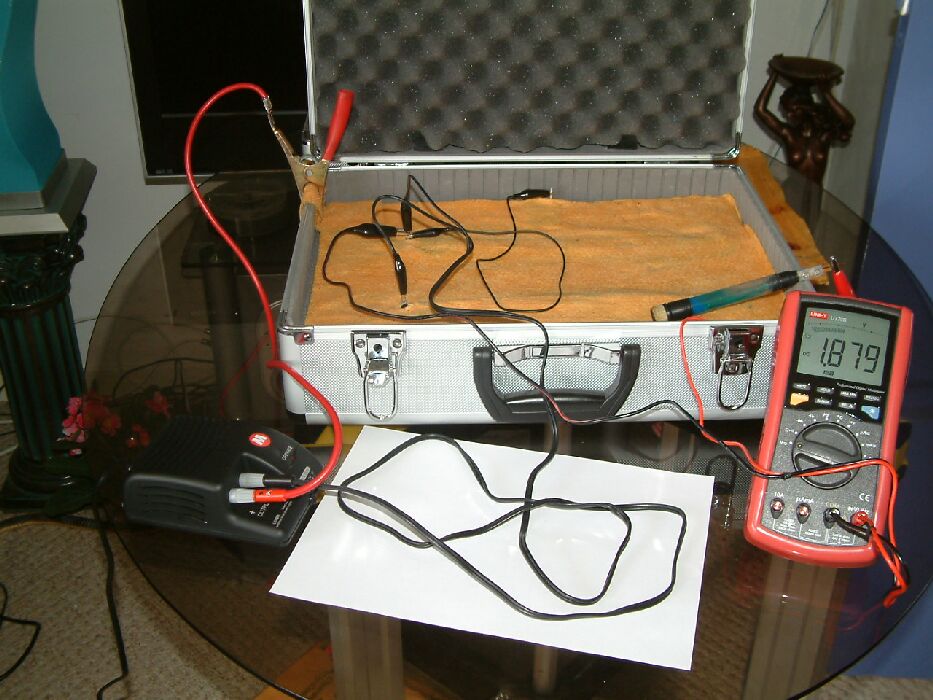
In the next picture the half-cell has been moved further away from the coupon to where the potential of the electrolyte is greater.
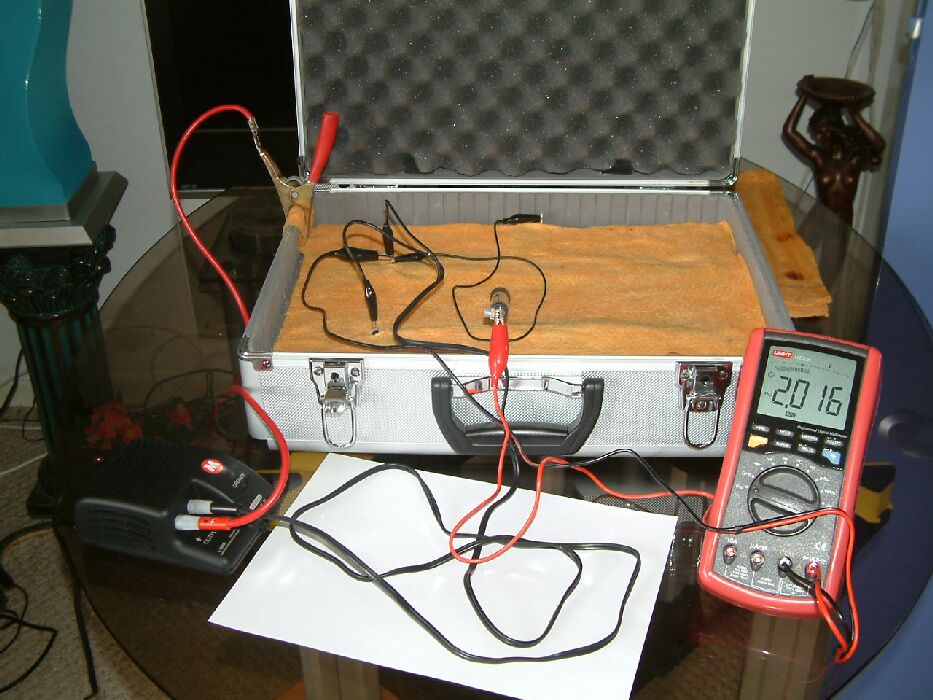
In the next picture the point of contact is between the two pipelines but further away from the coupon and it can be seen that the reading is 2.016 volts. It will be seen that it is closer to the 'groundbed' represented by the wet cloth under the clamp from the positive of the TR.
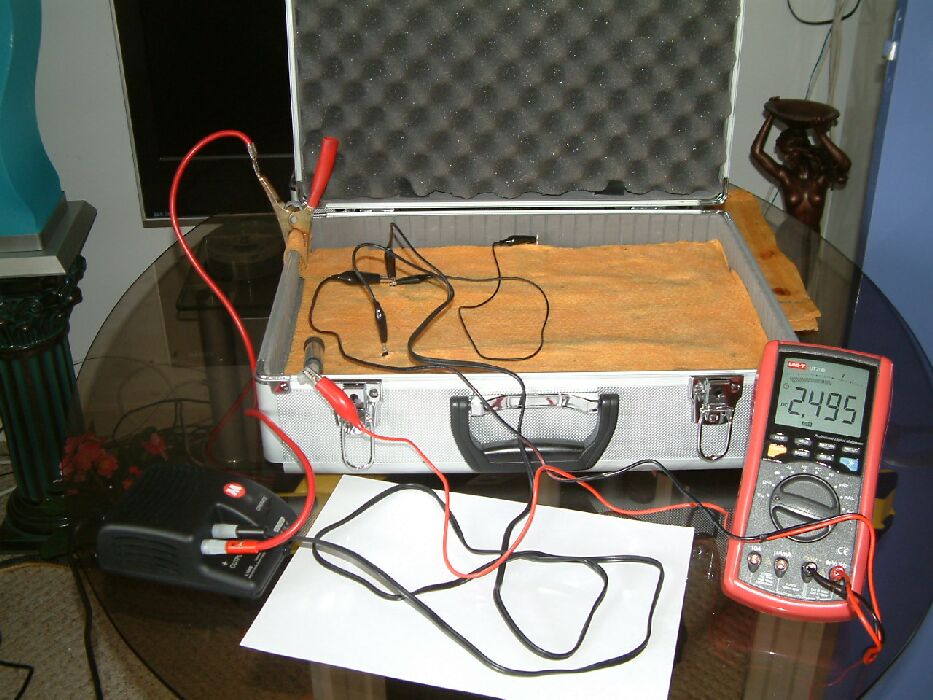
The half-cell is moved again and although it is further away from the 'groundbed' it is no longer in the area effected by the coating faults on the bottom of each pipeline. The reeading is seen to be 2.495 volts.
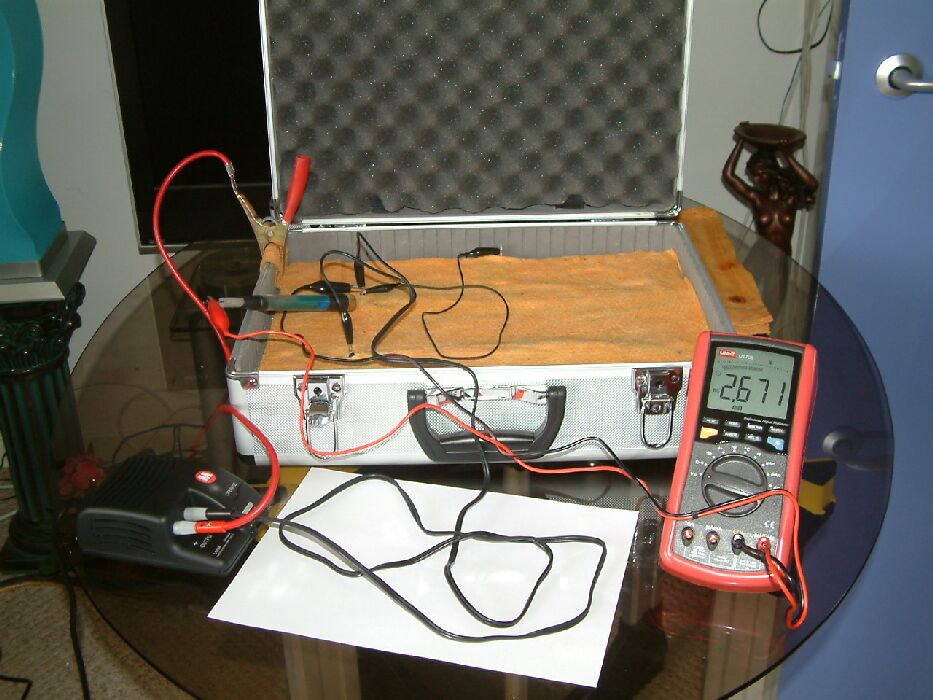
The half-cell is now very close to the 'groundbed' and the potential profile can be seen by the value of 2.671 volts.
We now disconnect the meter from the pipeline metal and connect the positive pole to another half-cell. We switch off the cathodic protection and note that there is a difference of 23.7 milivolts between the two half-cells. This varies by a few milivolts as they are shuffled about
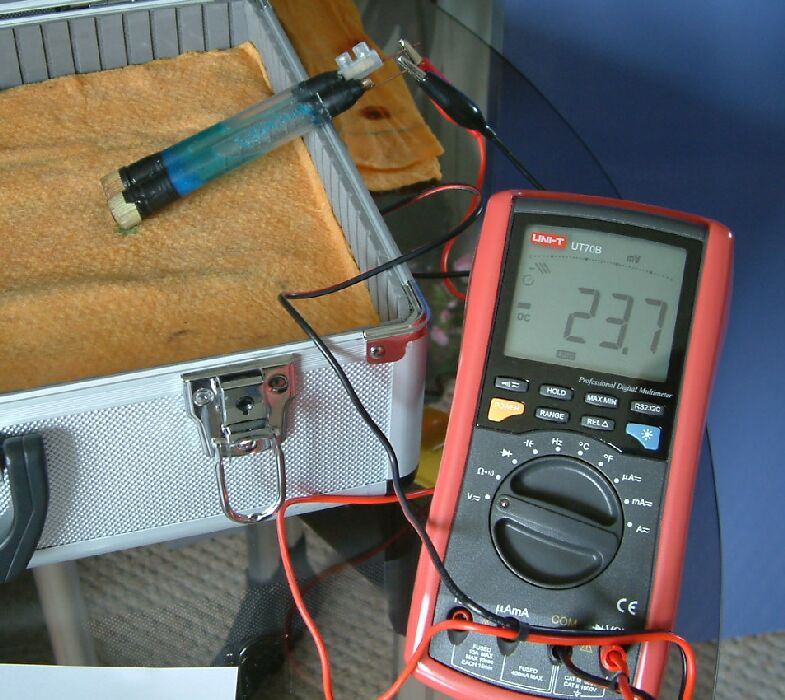
When the two half cells are swapped round it can be seen that the voltage changes. This indicates that there is a potential gradient in the very short distance between the points at which the half-cells contact the electrolyte. If brand new half-cells are used the voltages will be smaller. If the half cells are put together with no other contact the reading should be zero.
Impurities and bad connections sometimes prevent this but the magnitude of the error is so small it can be safely ignored.
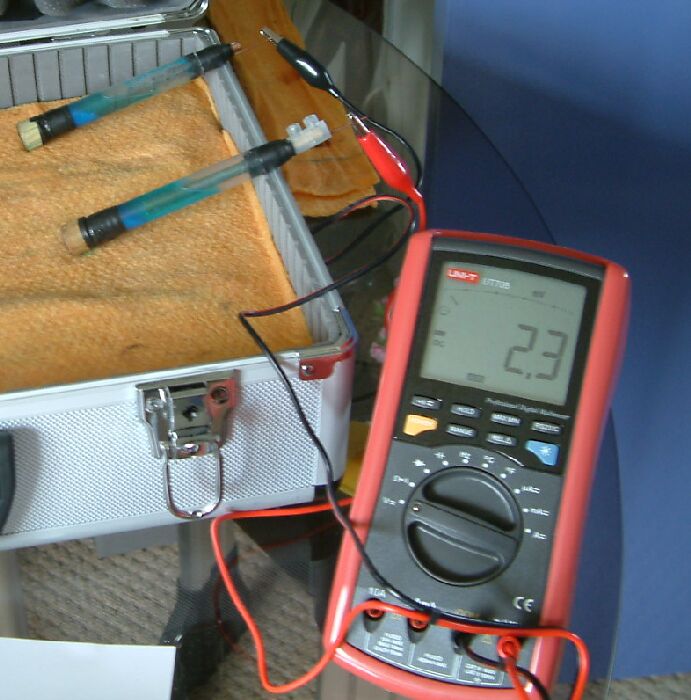
In this picture the half cells have been separated and the reading has been reduced to 2.3 milivolts. The difference in the potentials of the two half-cells has been compensated by the voltage gradient between the two locations.
The greater voltage in the next picture is due to the natural 'electrical flux' in the electrolyte which might originate with corrosion reaction.
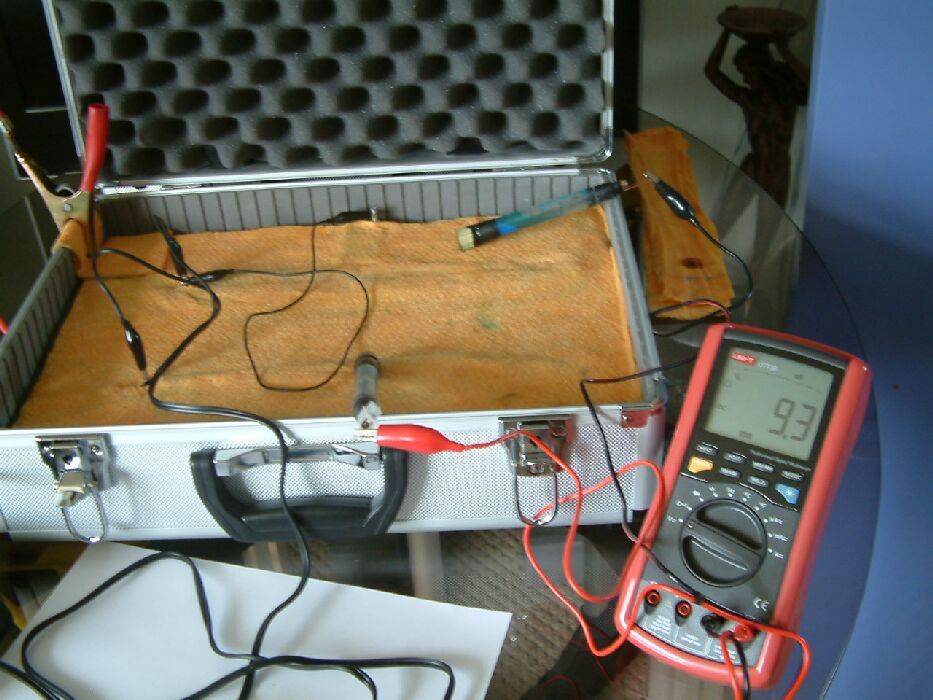
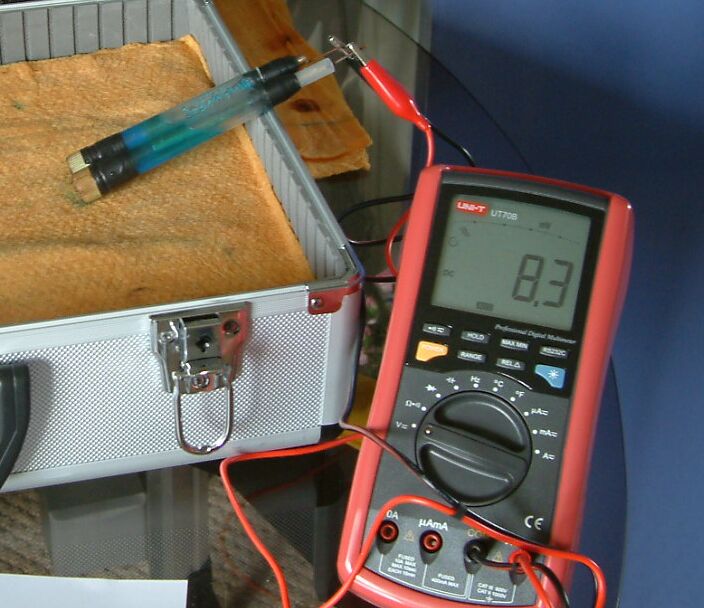
The half cells are placed together again and the cathodic protection current is switched on. The voltage is 8.3 milivolts.
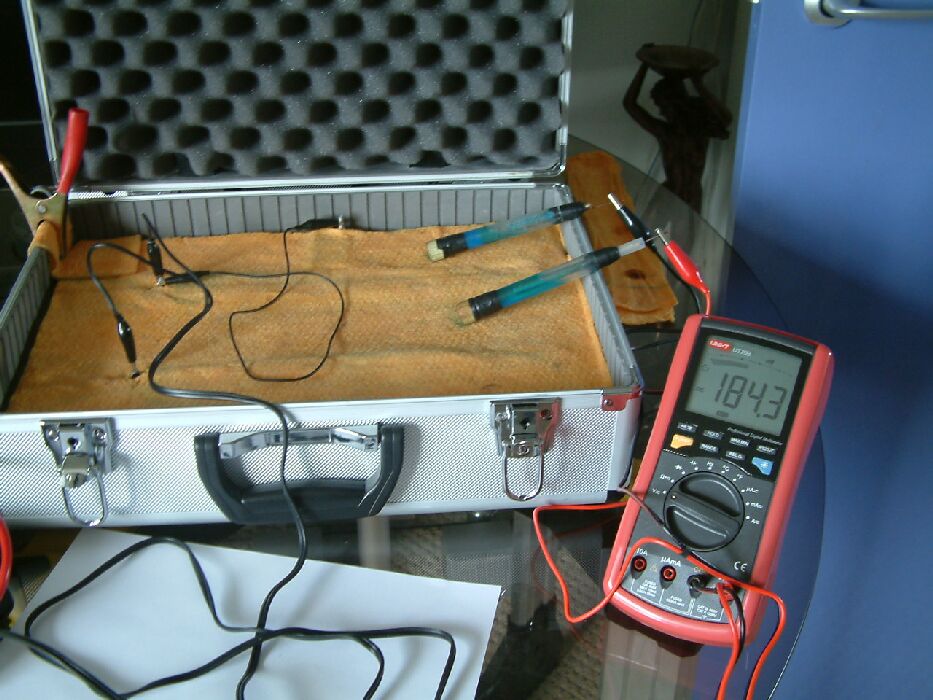
The half-cells are separated and the voltage now leaps to 184.3 milivolts due to the potential gradient caused by the cathodic protection current passing onto the coupon. In this case the closest half-cell has not been moved and can be regarded as the reference in each of these particular readings.
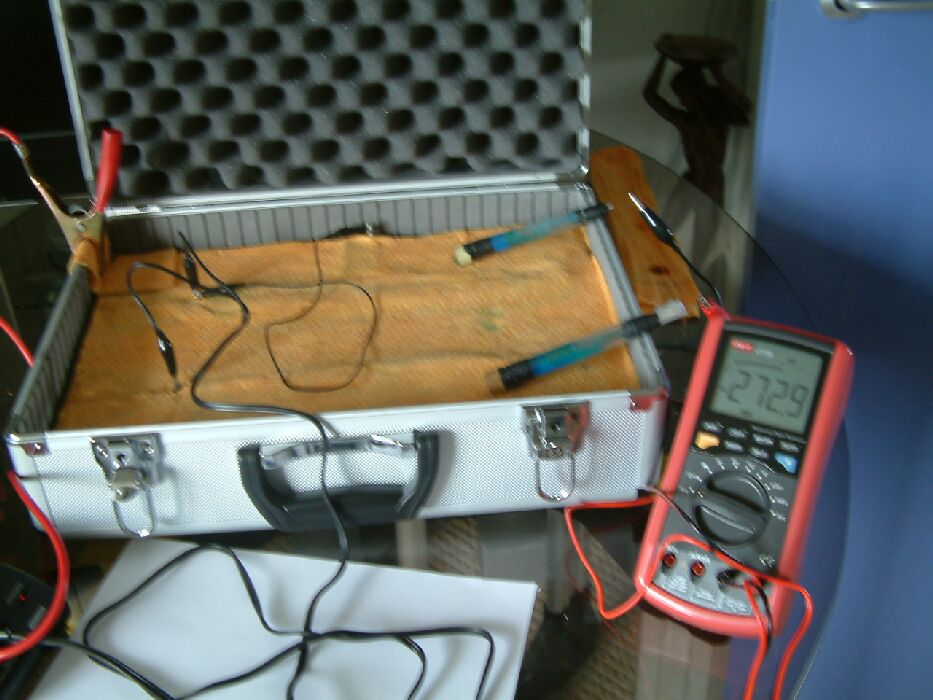
In the next picture the closest half-cell has been moved and the other has remained. The reading has increased to 272.9 milivolts. This shows that the potential of the electrolyte closer to the meter is greater than that closer to the coupon.
The principles of this experiment prove conclusively that neither of the half-cells is a fixed reference potential but that they are merely part of the measuring circuit.
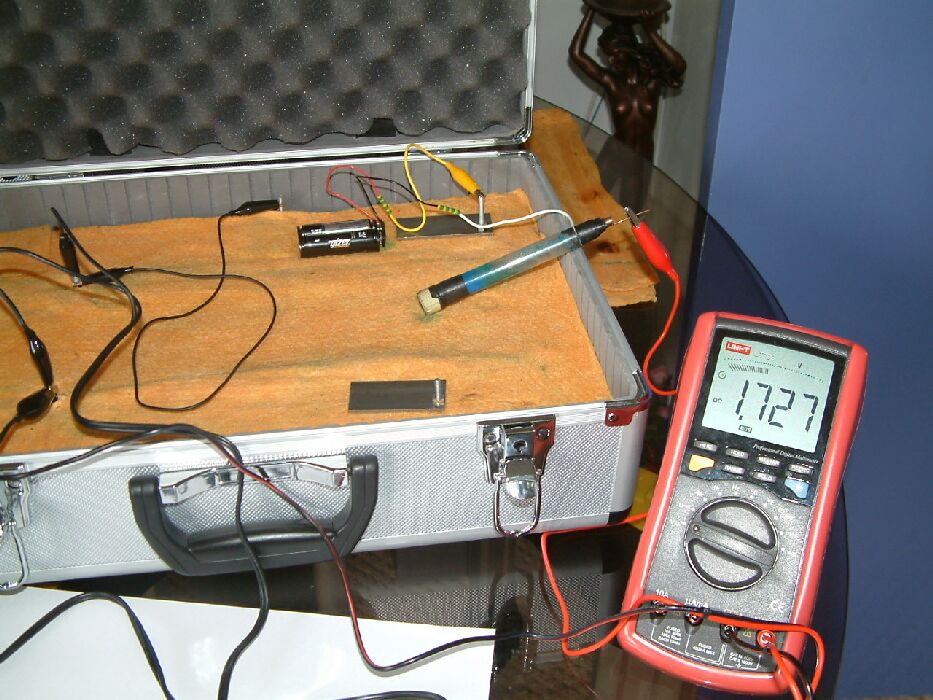
We now connect the meter between the pipeline metal and the half-cell leaving the cathodic protection switched on. We place two steel coupons on the surface of the wet cloth and note the reading is 1.727 volts.
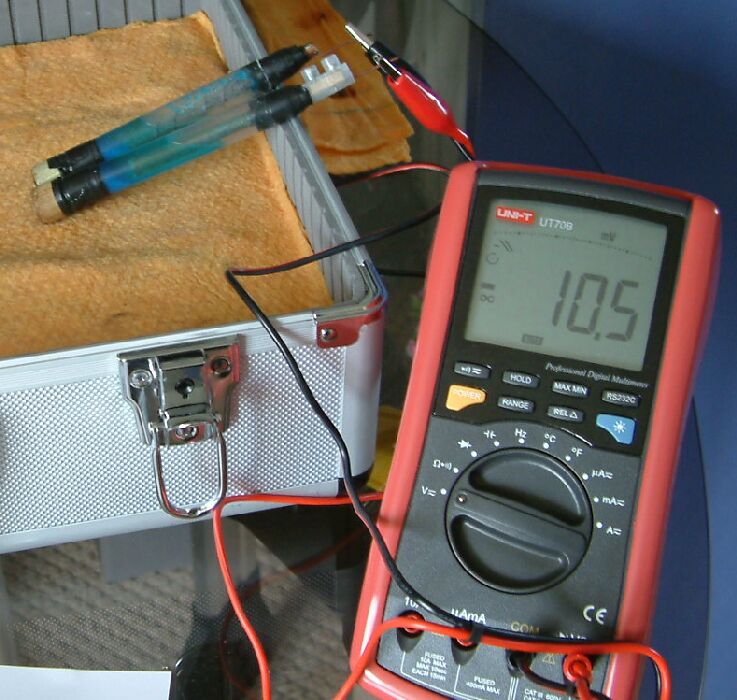
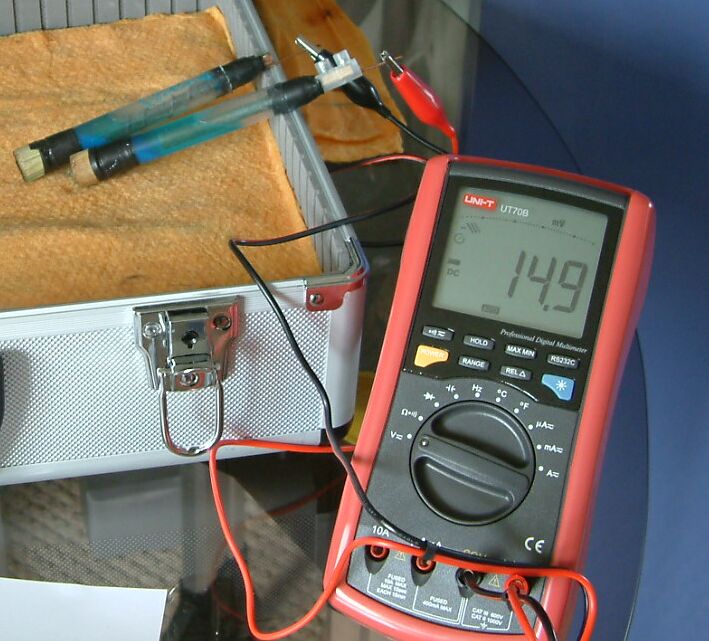
We connect a 3 volt battery holder between the two coupons and see that the meter shows 1.493 volts.
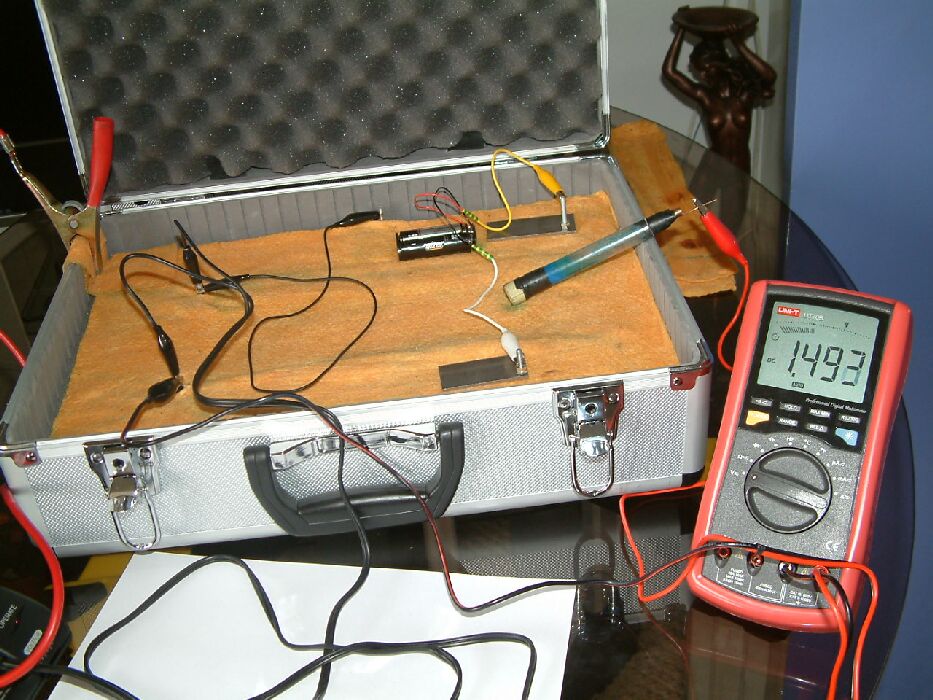
This is because we have altered the potential of the electrolyte in which the half-cell is placed. It is very important to understand that this has not in any way altered the corrosion reactions on the pipelines. This is merely an error that has been introduced into the measurement.
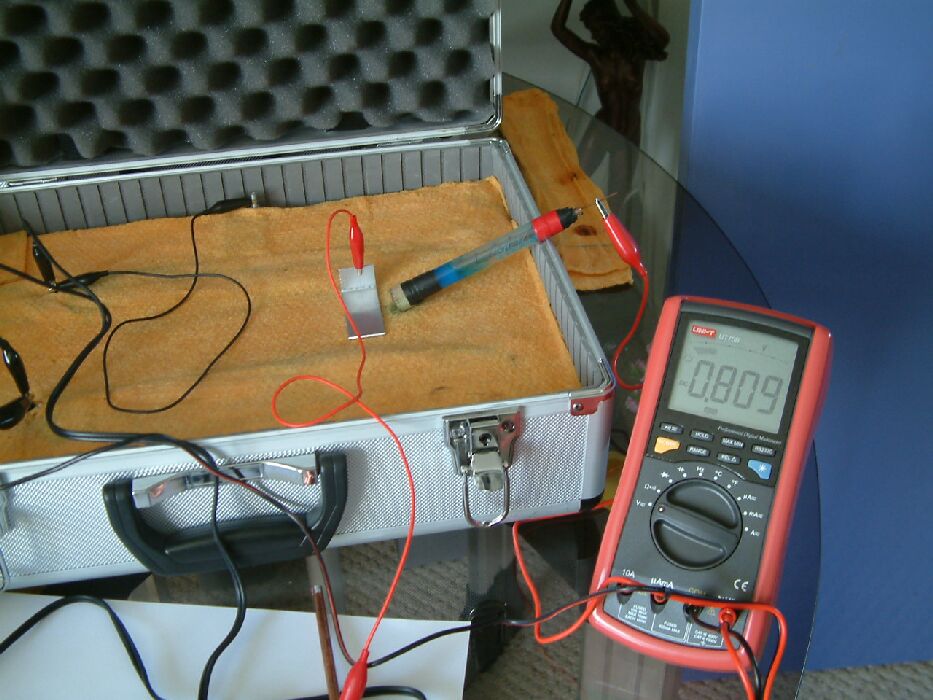
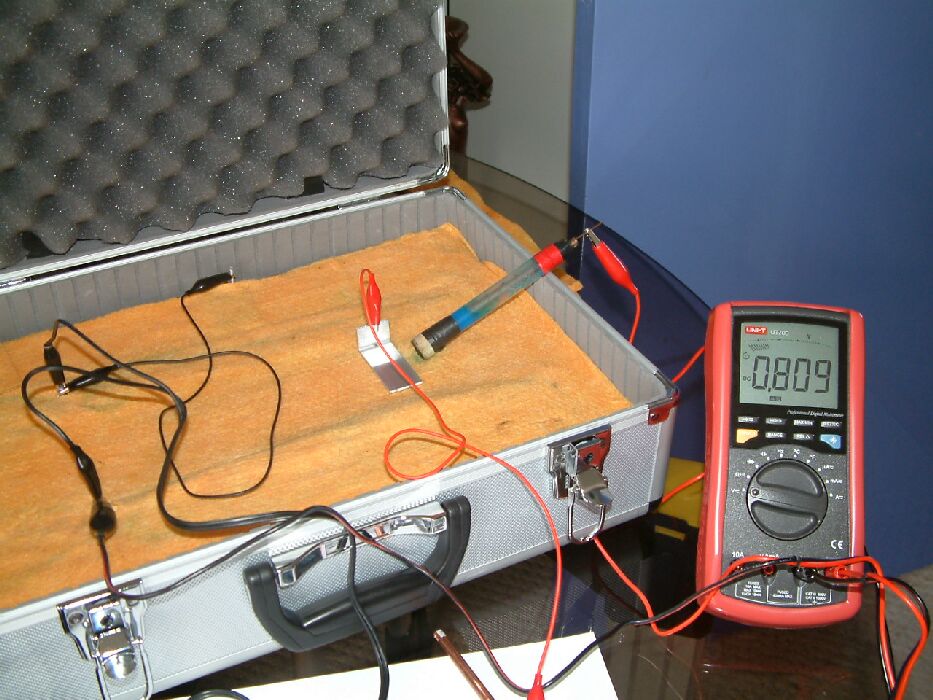
The next picture shows that a aluminium coupon has been placed close to the tip of the half-cell when 0.809 volts is shown on the meter.
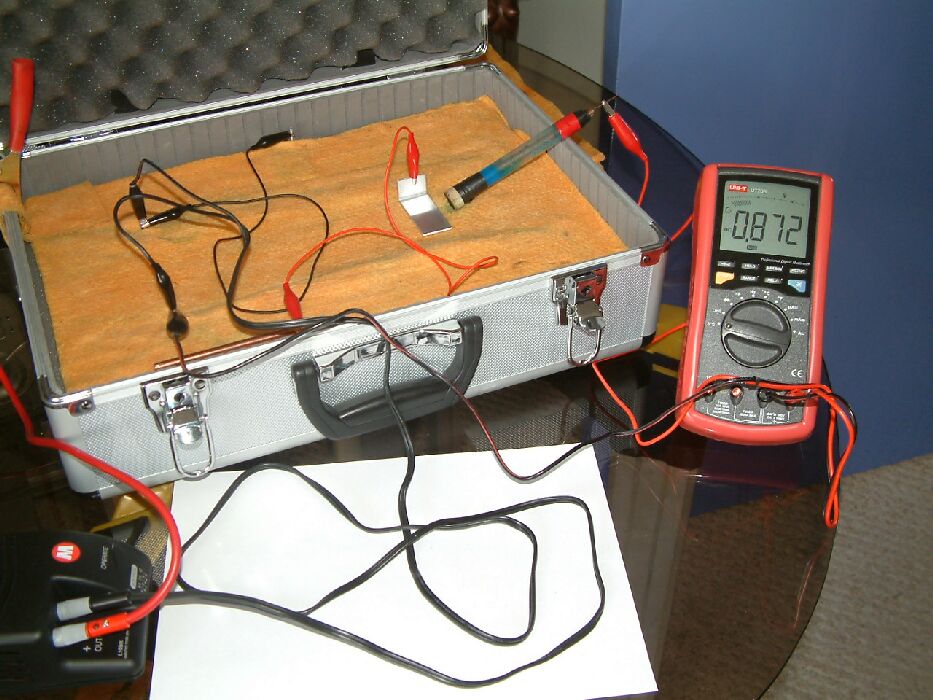
The reading changes to 0.872 volts when the aluminium is connected to a copper rod placed some distance away on the electrolyte. This increase in the potential of the electrolyte at the position of the half-cell is due to the current being given off by the corrosion of the aluminium when coupled to the copper.
These are some of the effects of 'interference' to the meter readings and it is important to understand that some have an influence on the corrosion status of the pipeline and some do not. Some are removed by switching off the cathodic protection current and some are not.
This port of the demonstration proves that there is little to be gained by measuring the 'off potential'.
The normal electrical status of the pipeline is with the cathodic protection system switched on.
The important voltage is between the EMF of the corrosion reaction and the potential of a reference electrode.
We have seen that it is impossible to make this measurement in field conditions.