
Cathodic Protection Network Experiment
Dismantling the first experiment in this series.
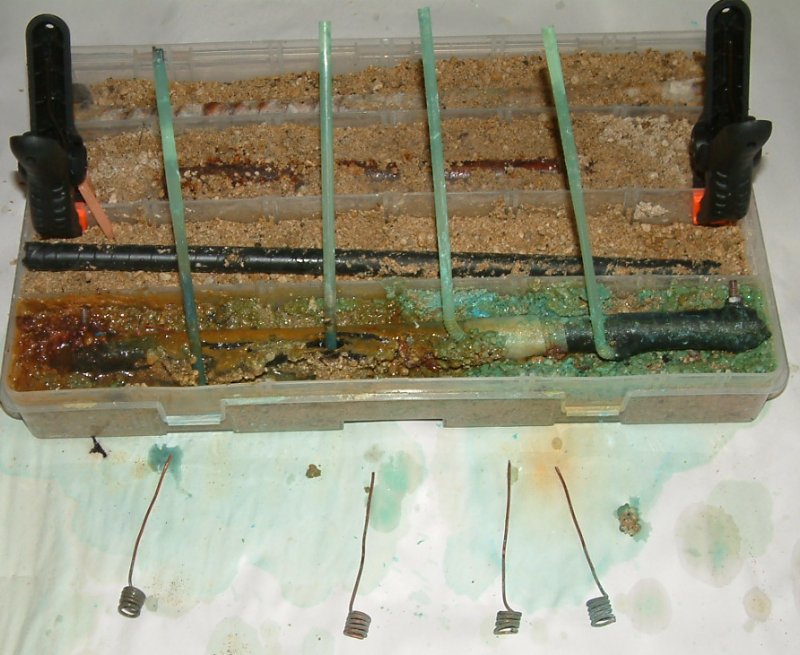
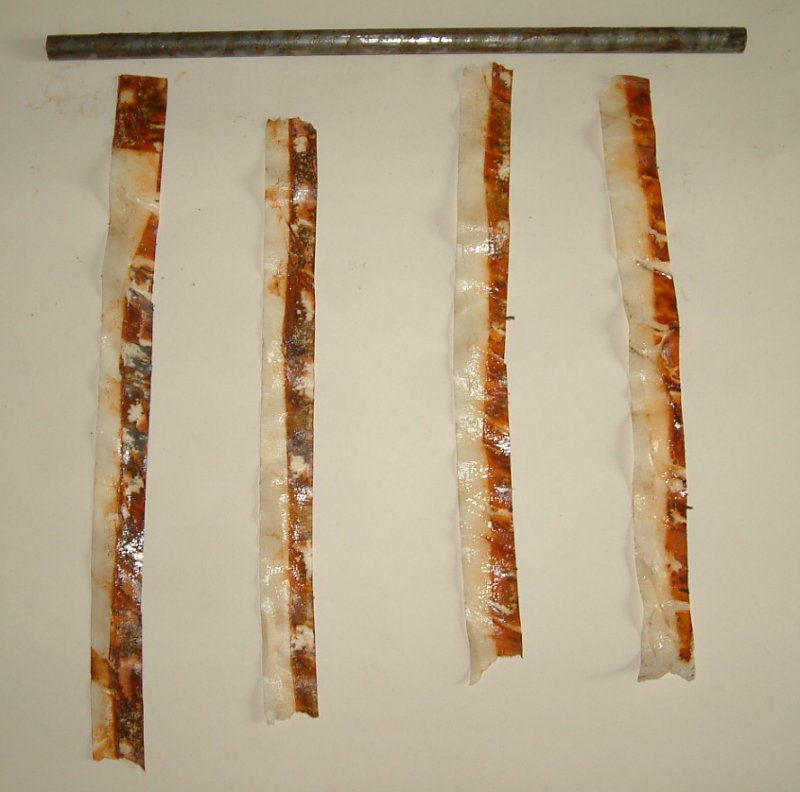
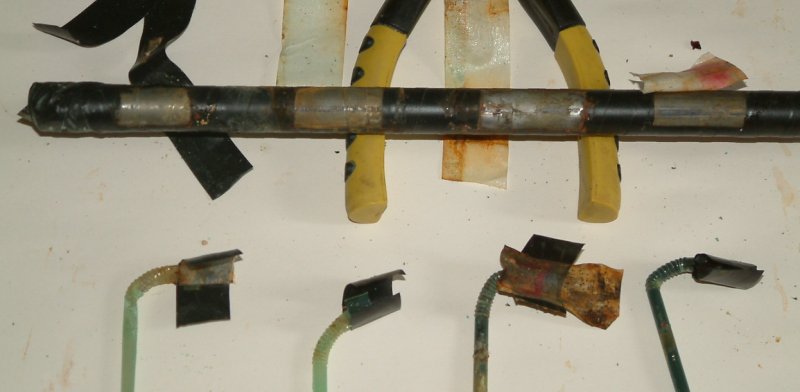
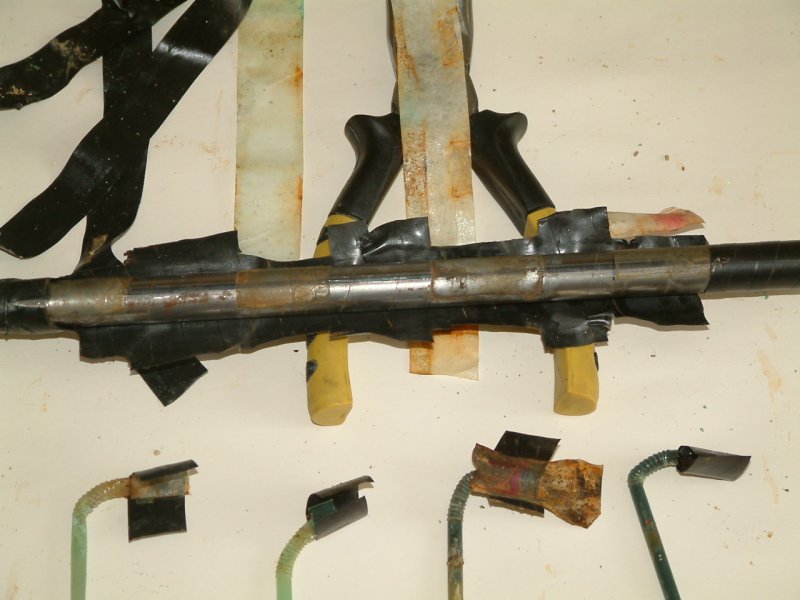
The gelatine straws have been removed for further investigation to examine the possibilty that they are more acidic at one end than the other due to the passage of the cathodic protection current,
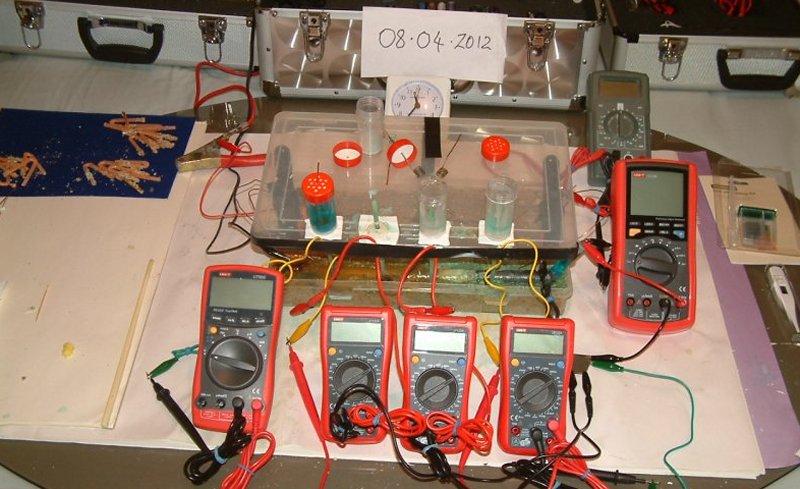
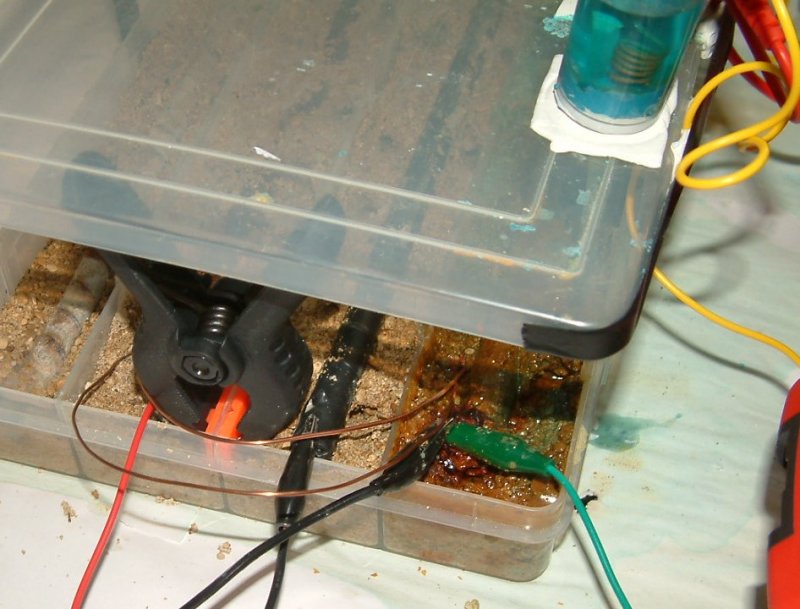
The Lugin capillaries are still in place but the copper/copper-sulphate containers have leaked except for the one on the left.
The power supply has been turned off.

This shows the problem with sealing the containers for the CuSO4 solution.
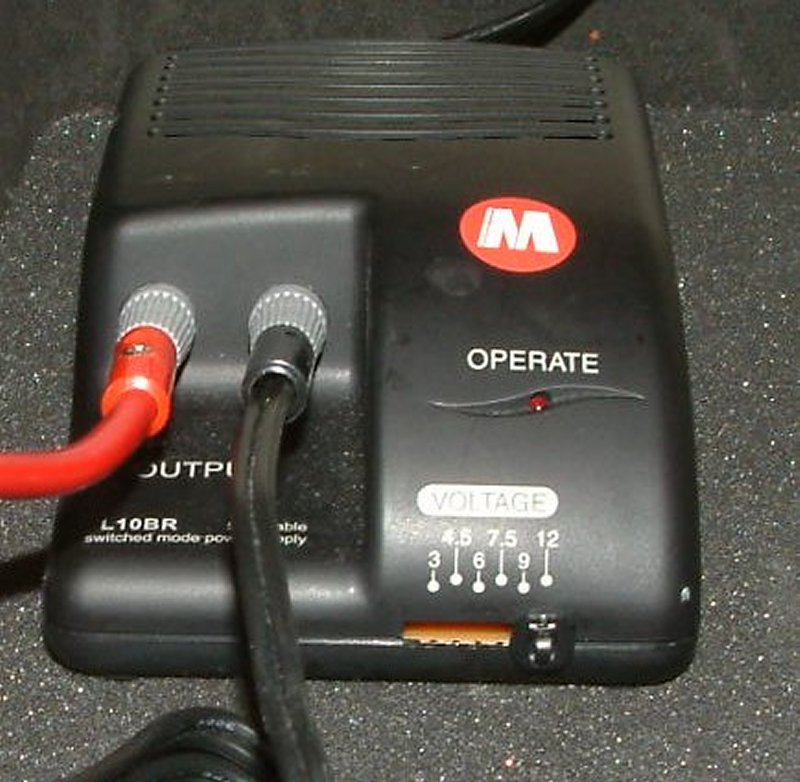
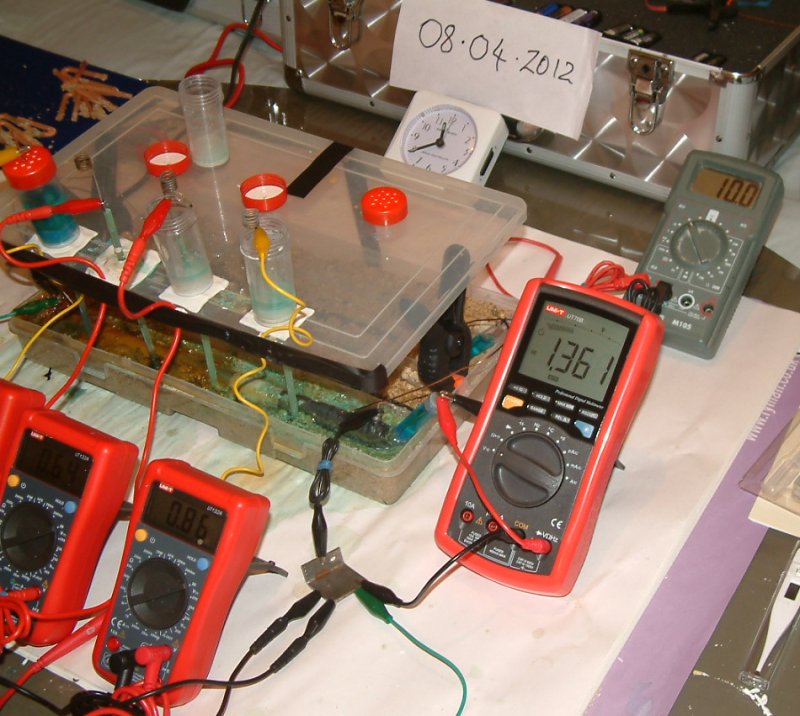
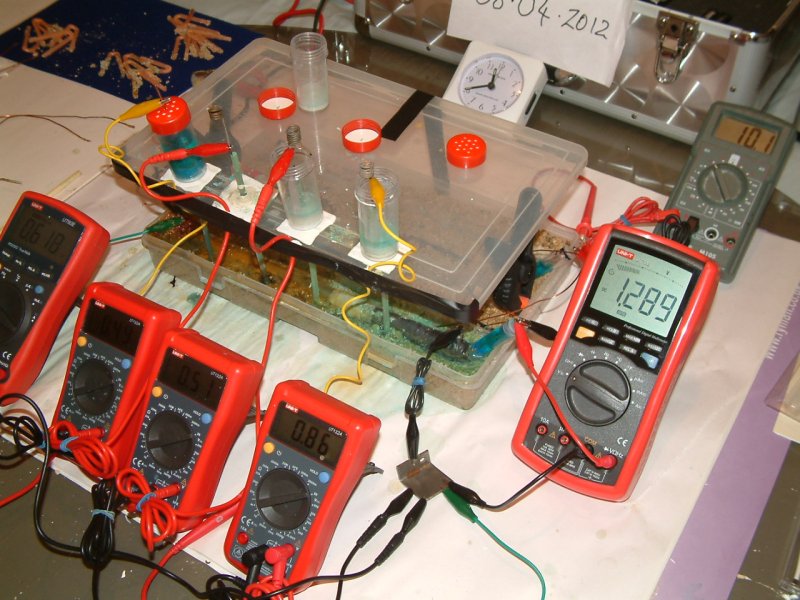
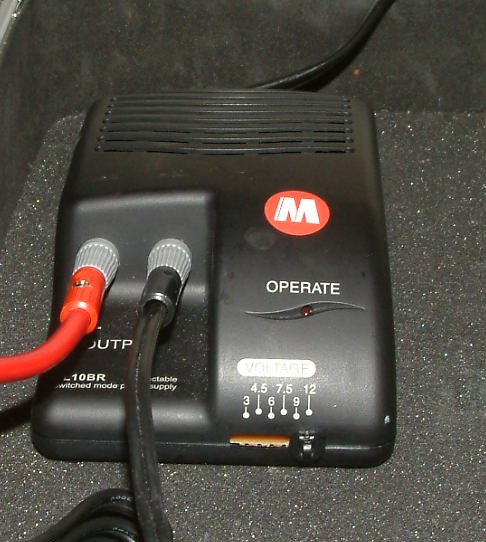
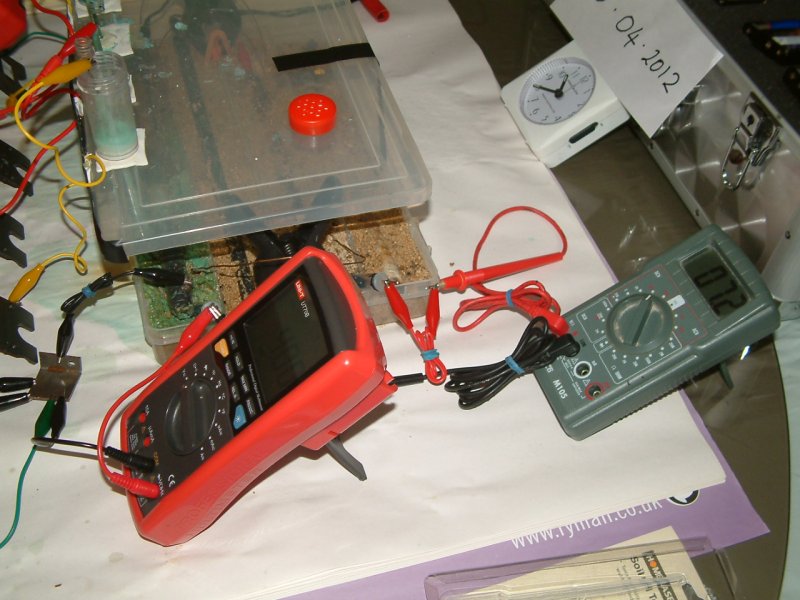
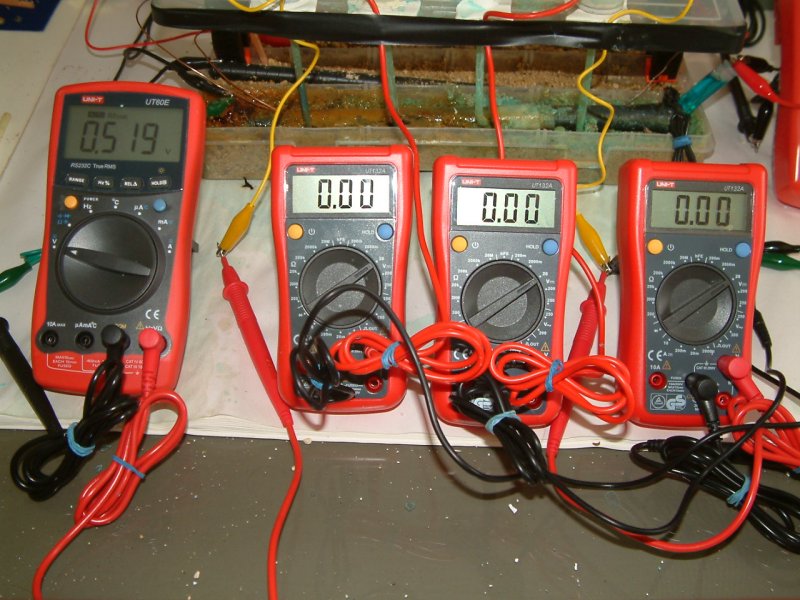
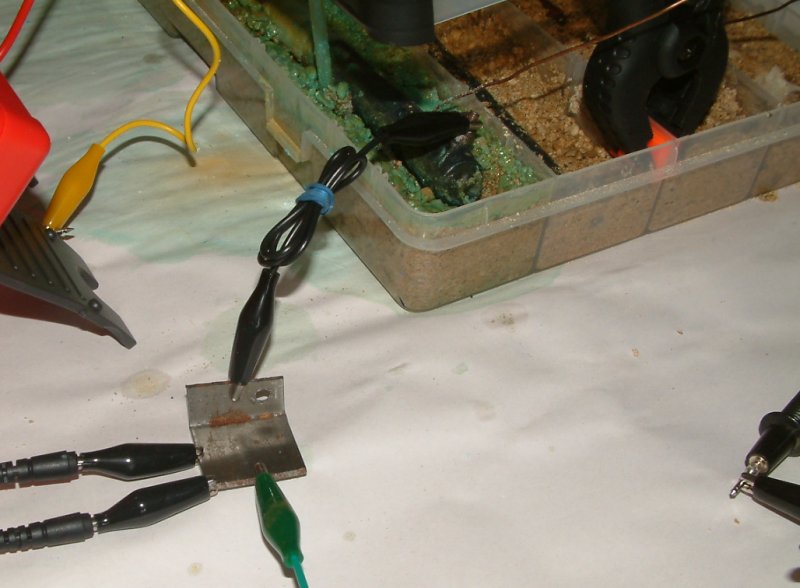
The power supply (TR) (in South Afica TRU)is switched back on and the copper electrodes are stuck into the ends of the straws that are filled with gelatine acting as Lugin capillaries.
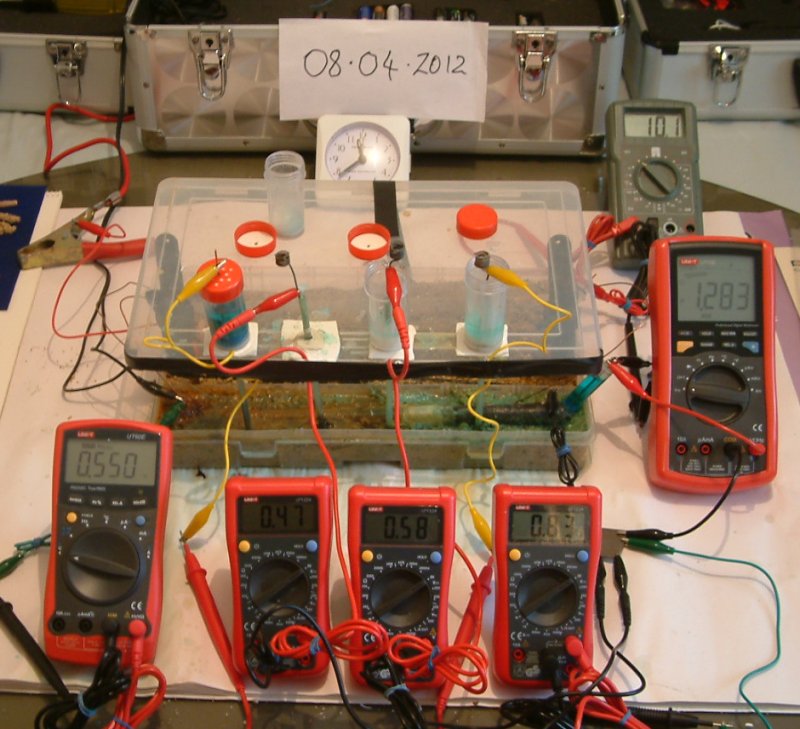
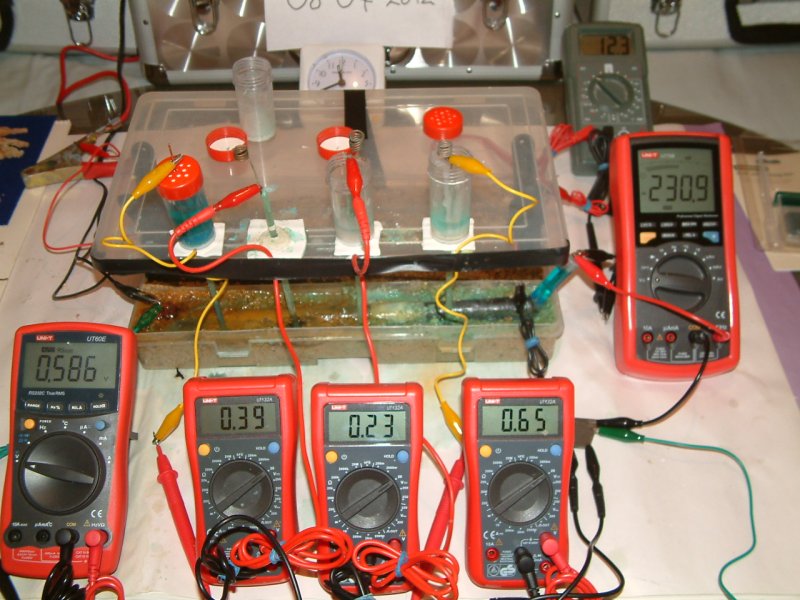
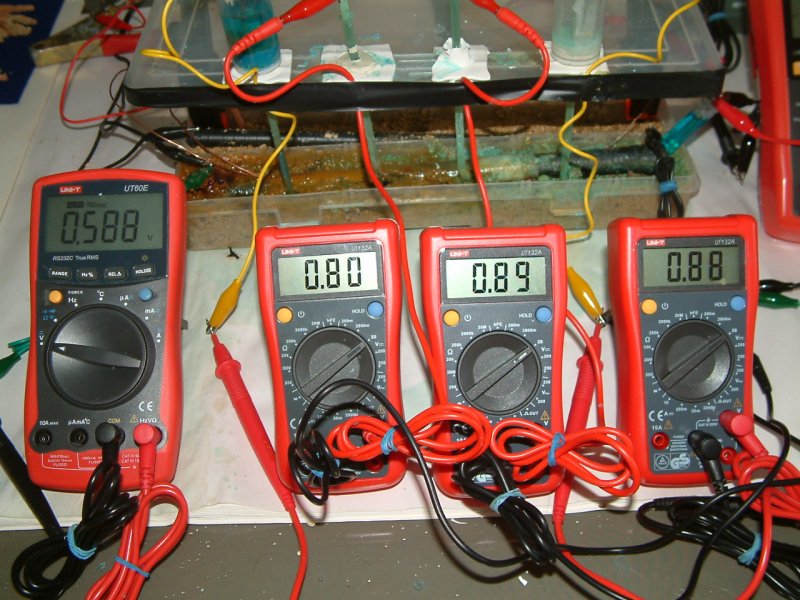
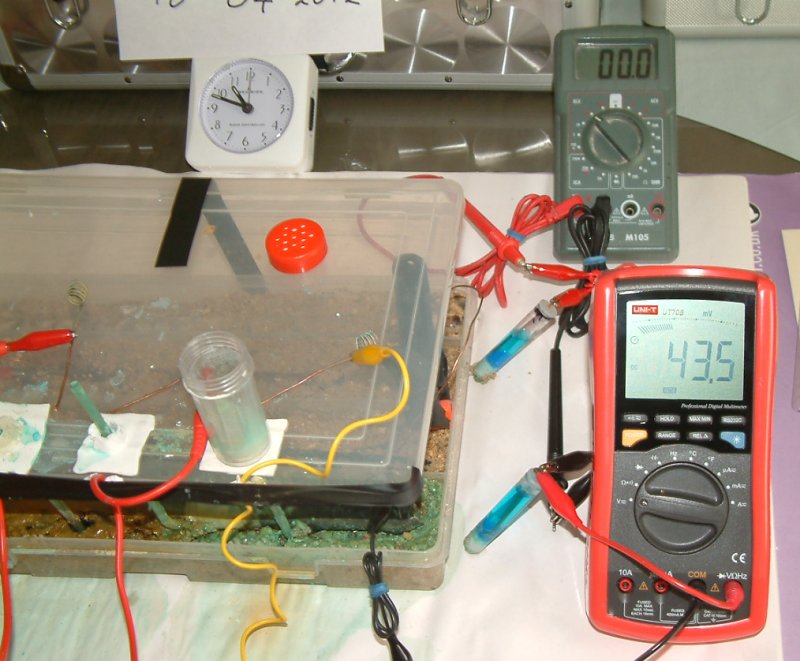
It can be seen that the pipe-to-soil reading is 1.283 volts and the half-cell to half-cell reading (equivalent to a DCVG reading) is 10.1 volts.The reading on the meter on the right at the bottom of the picture is 0.550volts. This is caused by the reaction between copper and copper sulphate in the surviving container and the reaction potential between the steel and the electrolyte at the interface contained in the first coating fault blister.
The readings on the other meters is the result of the reaction of the copper electrodes to the gelatine in the end of the Lugin capillaries and the interface reactions at their respective coating faults.
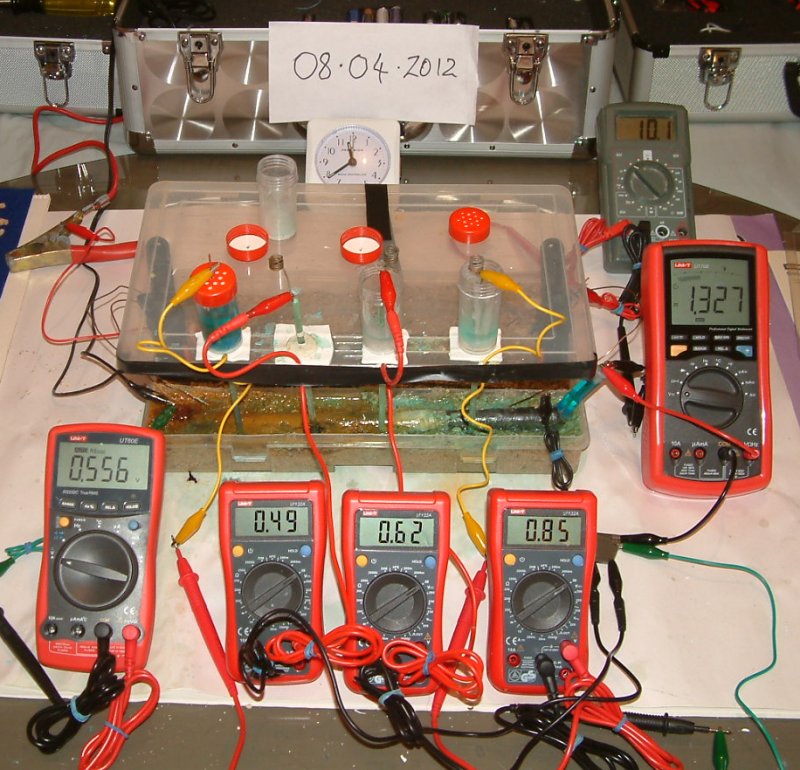
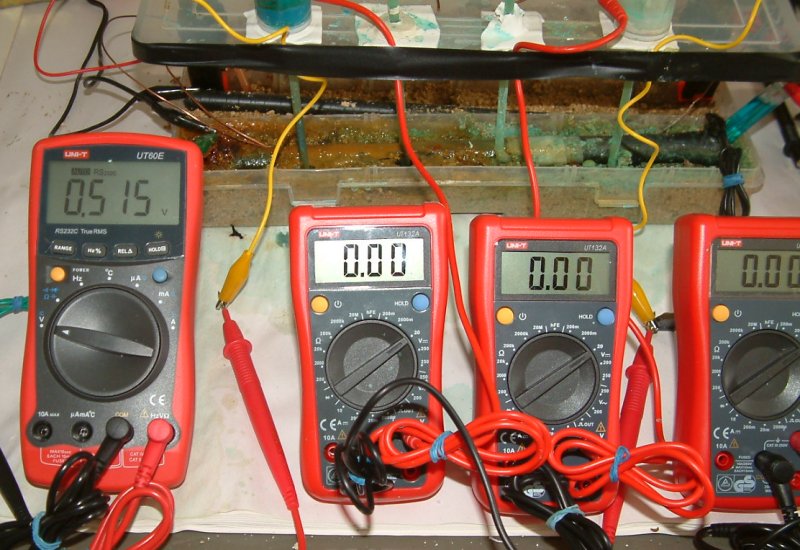
This picture was taken less than a minute later and we can see that the readings on all of the meters have changed but the arrangement has not.
This picture shows that the readings have changed again and that the two half-cells are still in good working condition and connected to the two relevant meters. It also shows that the copper connector between the two sections of the tray is still in place on the right hand side. This is carrying charges from the anode section to the subject pipe section.
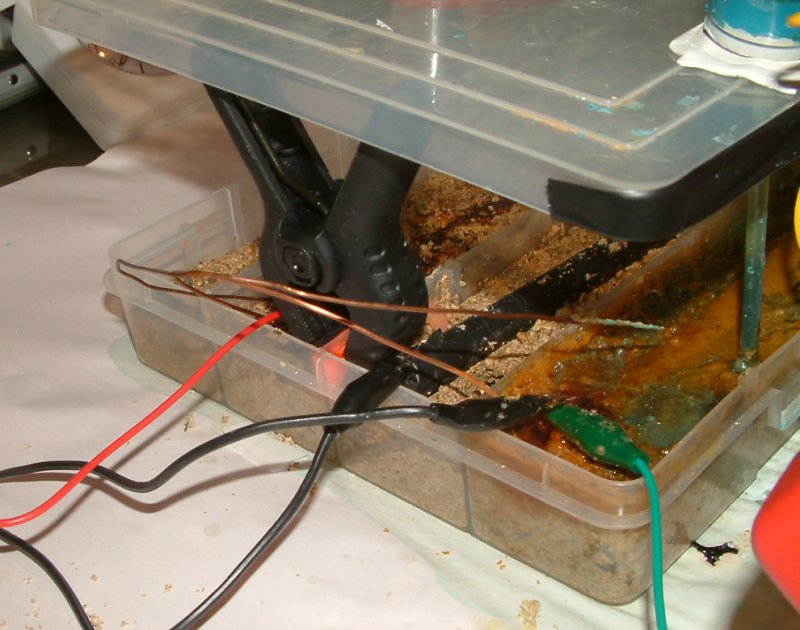
This shows the two copper conductors on the left hand side of the tray connecting the anode section to the subject pipe section. This is causing corrosion to the copper due to the charges passing into the electrolyte.
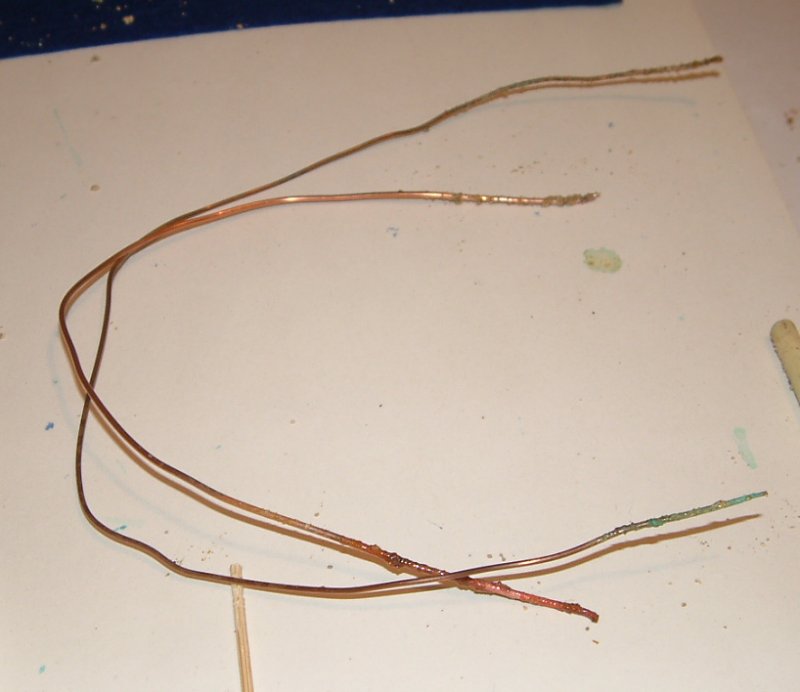
The copper is taken out to show the corrosion that might be regarded as 'interference corrosion' in pipeline circumstances as it derives from charges coming from the electrolyte or ground, passing through the metal and returning to the ground at a different location that has a lower electrical potential.
This picture shows the effect on the readings of the removal of the copper connectors on the left of the tray.
It can be seen that the copper connector is still in place in the right of the tray and that the readings are changing compared to the last picture that was taken less than a minute ago.
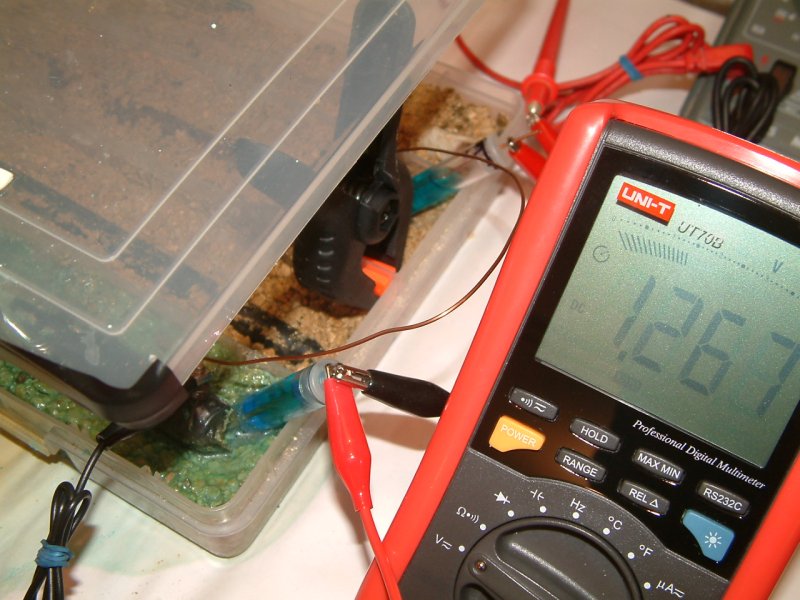
This picture is a close up of the arrangement on the right of the tray.
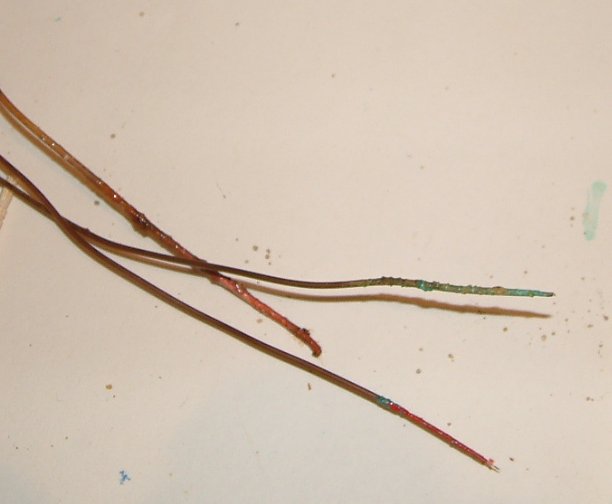
This picture shows the corroded ends of all three of the connectors between the sections of the tray.
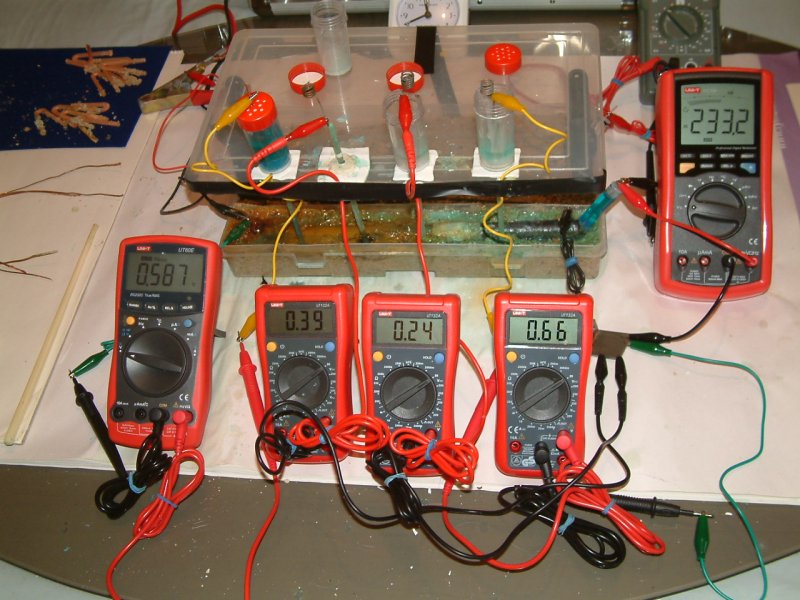
This picture shows the readings on all but one meter after the removal of the third copper section connector.
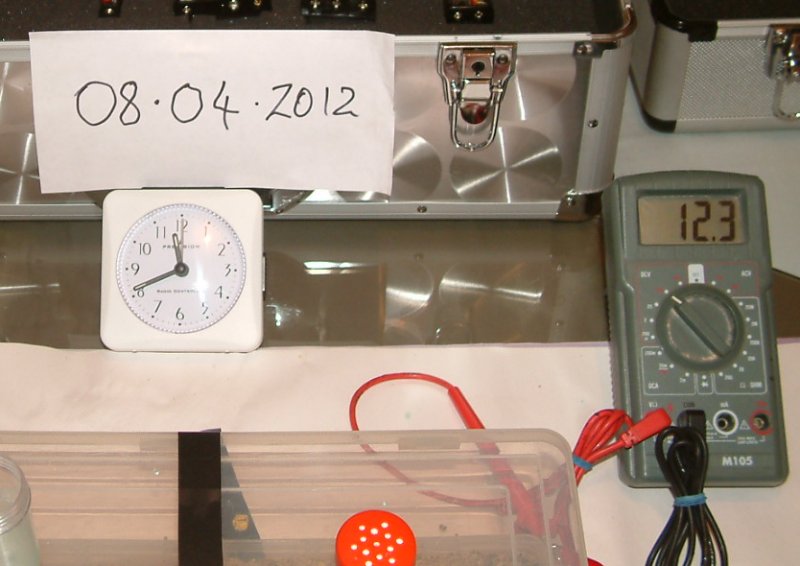
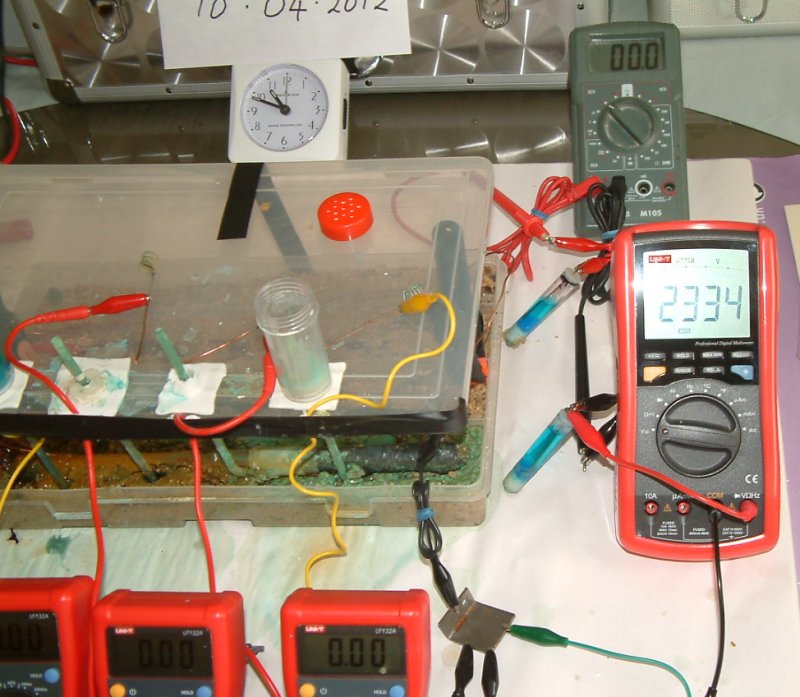
This picture shows that there is a potential difference between the two half-cells of 12.3 volts and the pipe-to-soil-potential is now 2.309mv.
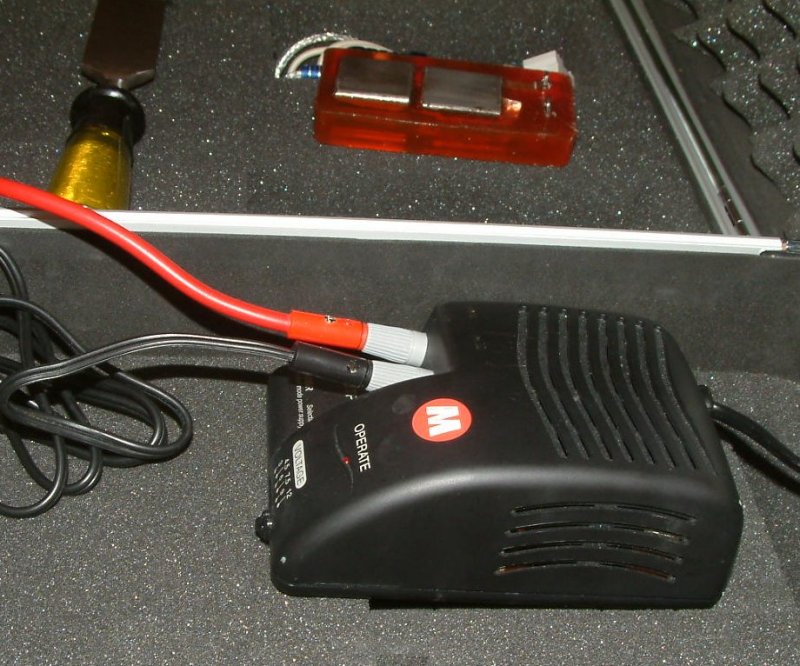
The power supply is switched off.
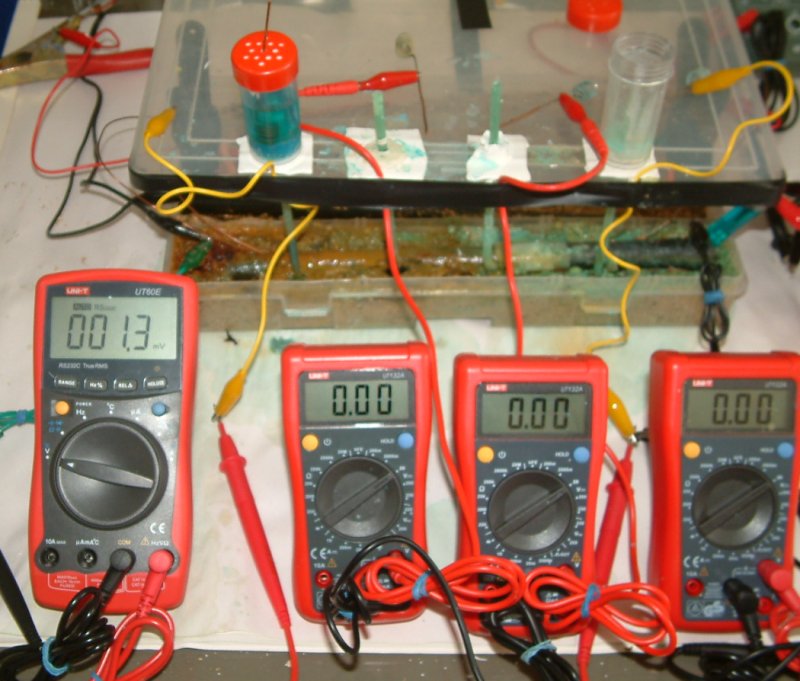
This shows the readings as soon as the power supply was switched off.
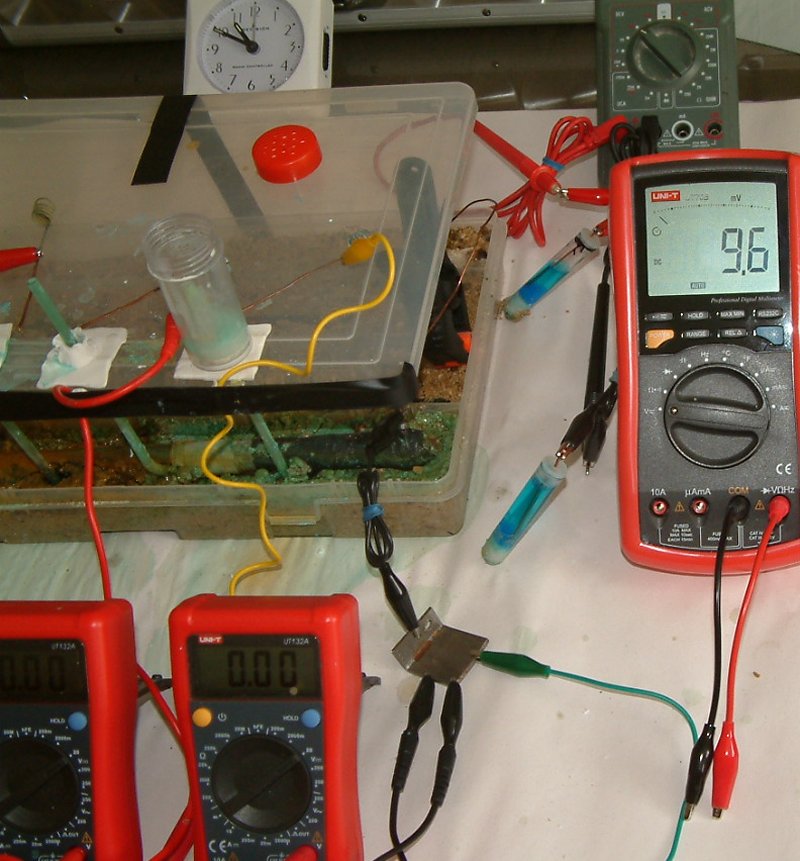
This shows that there is 0.5volts between the two half-cells and 226.8mv pipe-to-soil potential. This clearly demonstrates that the half cell cannot be regarded as a reference potential. Which one is the reference in this case?

These meters are all connected to the metal to electrolyte interface as specified in DIN50918 but the other pole is to a copper wire in gelatine and CuSO4 solution respectively as seen.
The values on the meters are the result of a common connection to the pipe metal and the unique interface reaction in each case. This proves that the half cell cannot possible reflect the corrosion status of the pipeline metal unless it is placed at the anodic interface with the electrolyte.
In real life this can be tested at an excavation site by placing the half cell closer and closer to a coating fault that is half exposed. It can be further tested by noting the readings when the coating fault is covered again for this experiment.
This shows that the copper sulphate has leaked into the subject pipe section of the tray during this experiment.
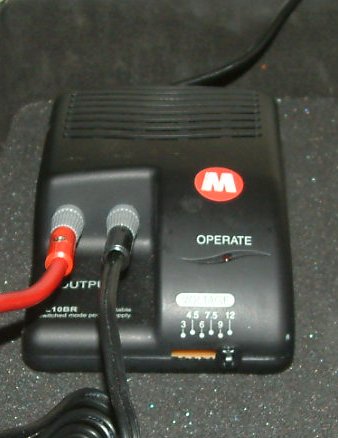
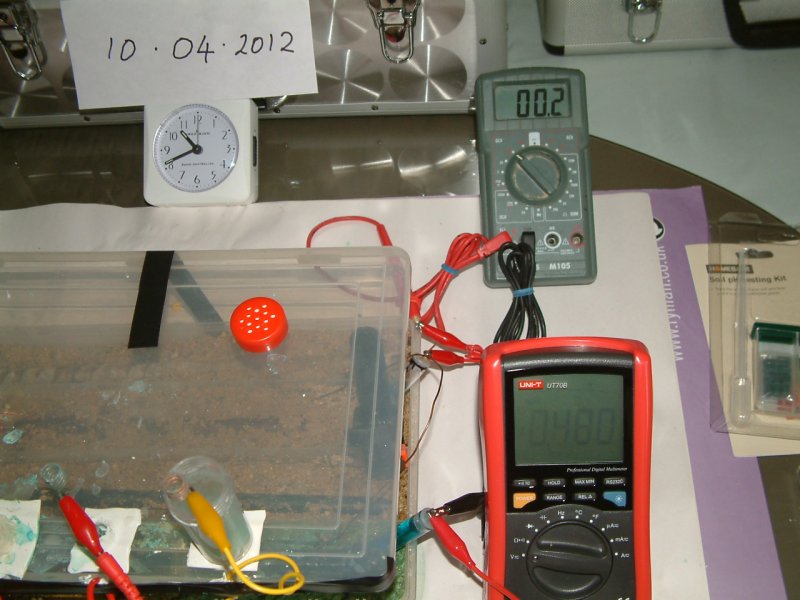
The power supply was on set at 12 volts during this group of photos.

It can be seen that this picture was taken at 1040 on 10th April 2012.
The half-cell to half-cell reading is 7.2 volts and the pipe-to-soil potential is 4.06 volts
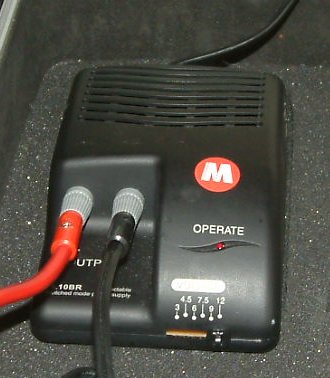
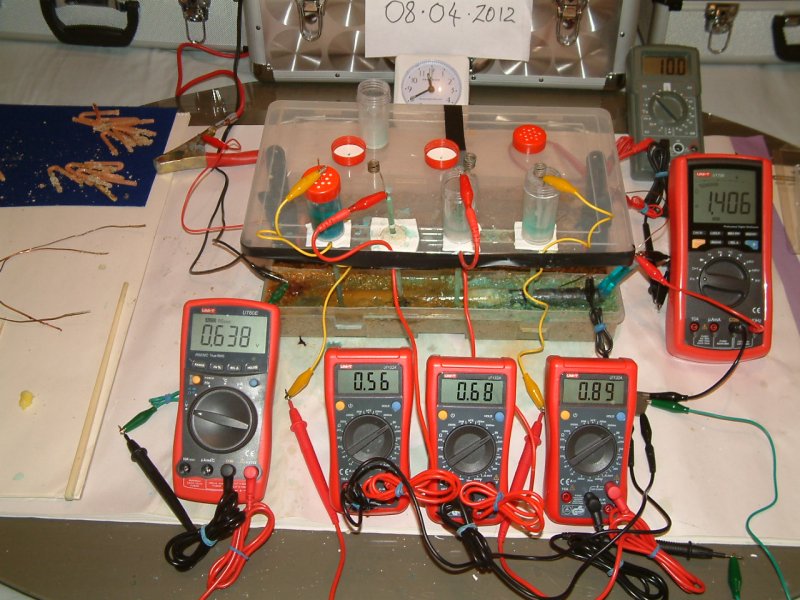
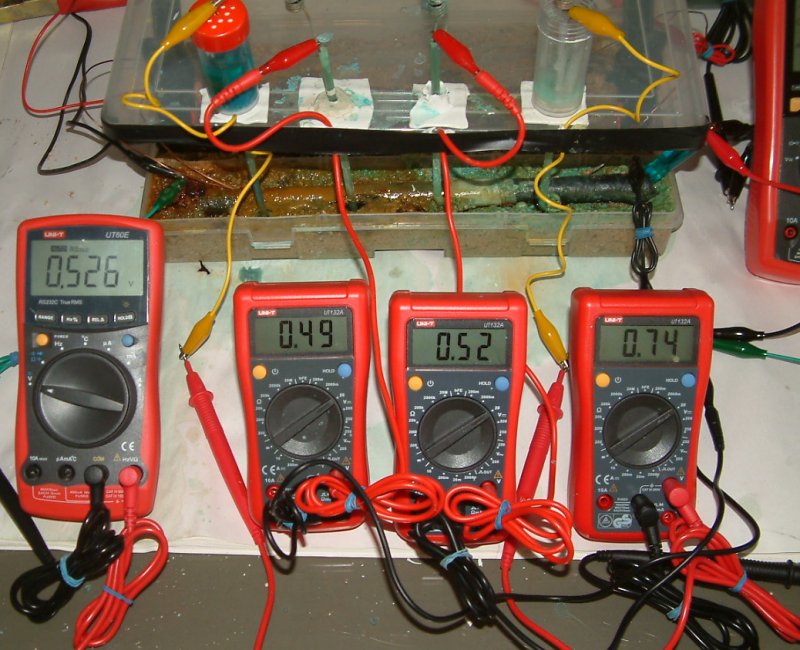
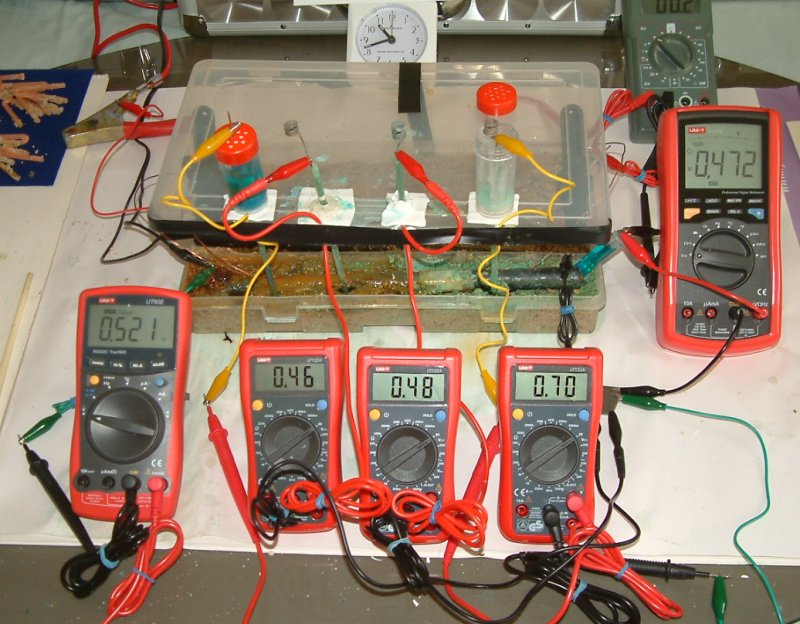
The power supply is on and set at 12 volts.
The two copper connectors are in position on the right hand side of the tray.
The readings can be seen on the four meters with interface connections.
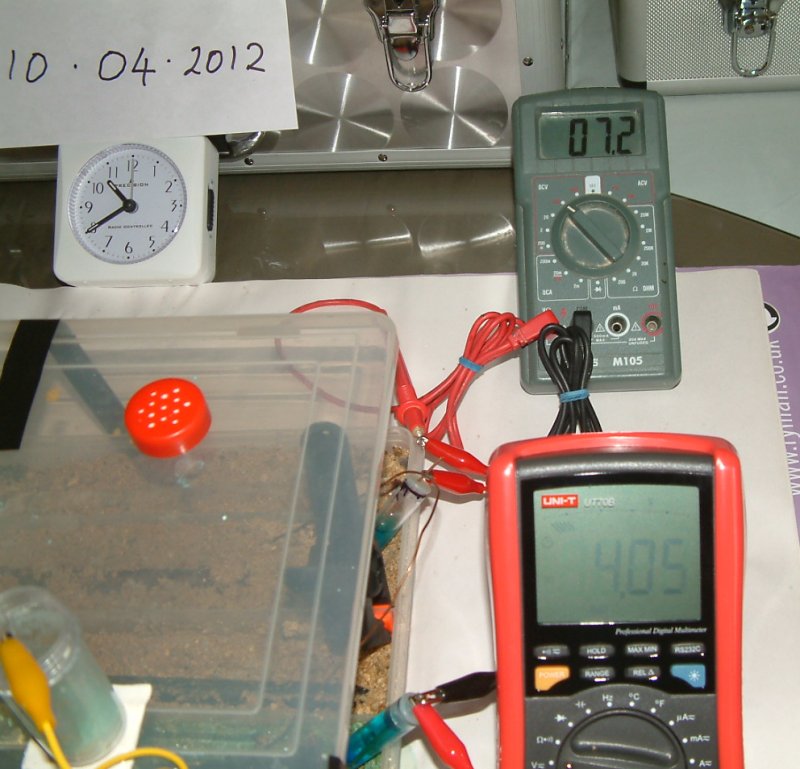
At 1040 on the 10th April 2012 the potential difference between the two half-cells is 7.2 volts and the pipe-to-soil potential is 4.05 volts.
This picture shows that all the front meters are connected to the same connection as the pipe-to-soil meter. It is certain that they are all measuring the variable potential of the half-cell and the interface reactions.
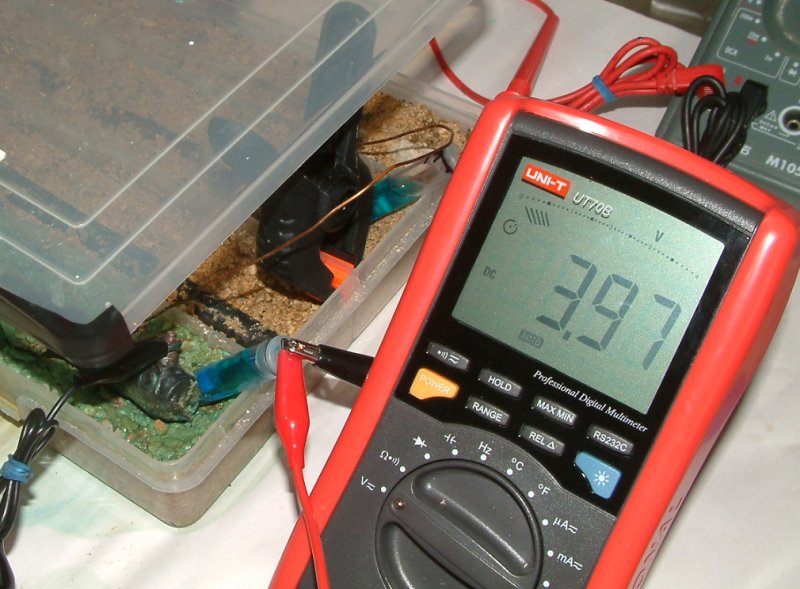
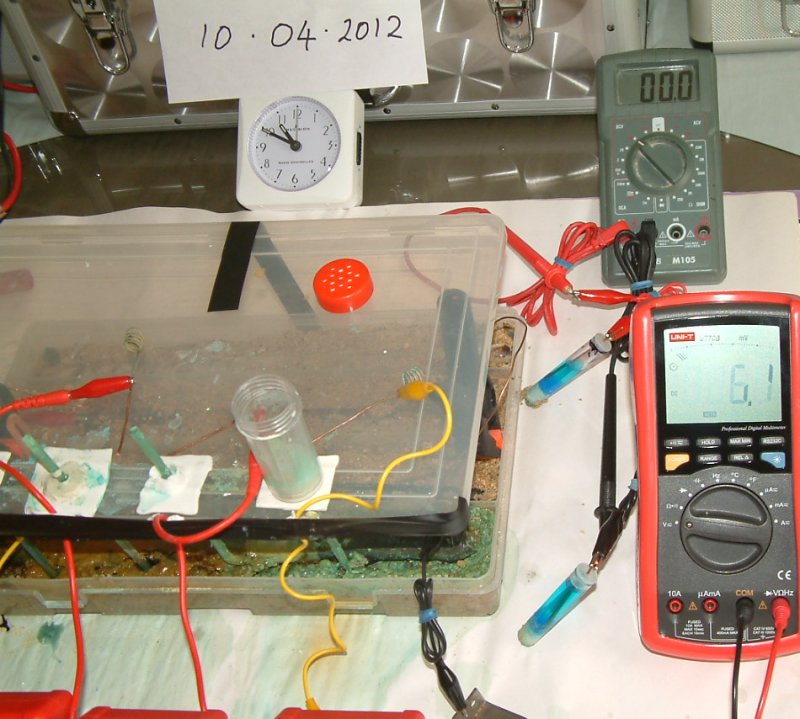
The pipe-to-soil potential is seen as 3.97 volts.
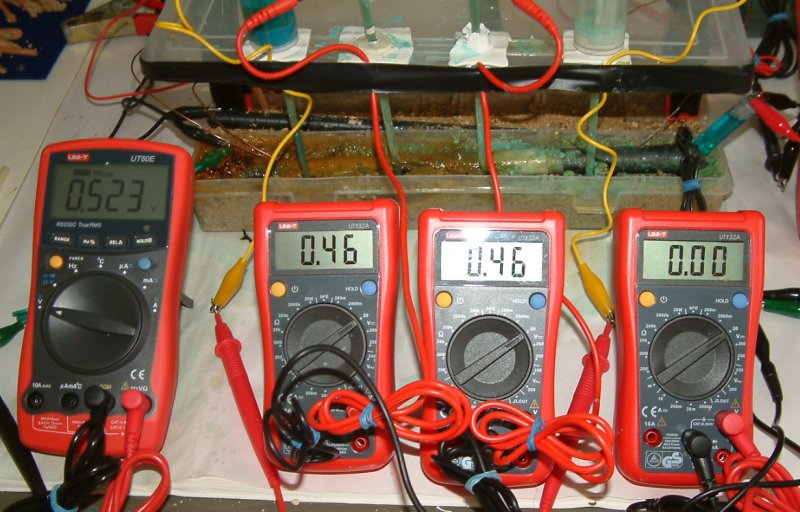
The power supply is then switched off.
The result of this power off is seen on the four meters.
The half-cell to half cell reading is 0.2volts and the pipe-to-soil potential is 0.480volts
These readings were shown about a minute later.
The front left meter is diconnected from it's copper electrode.
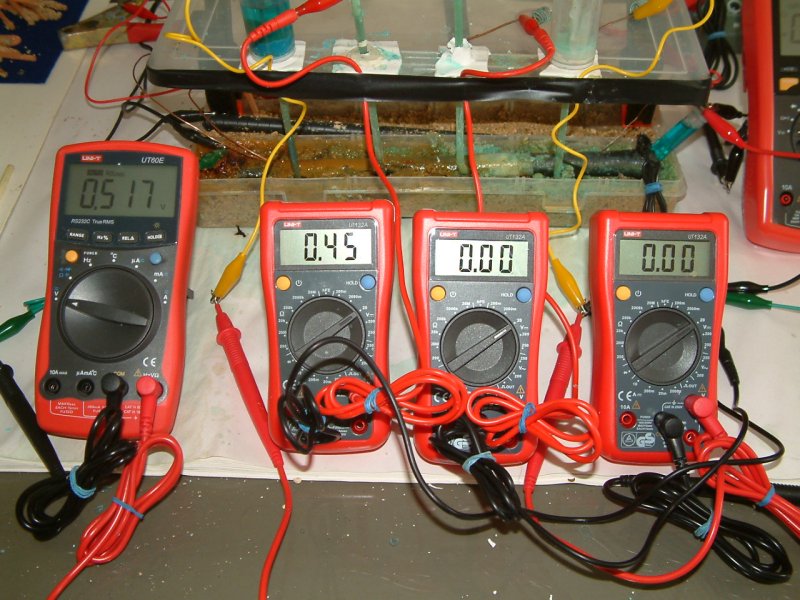
The next meter is disconnected from it's copper electrode.
The third meter is disconnected from it's copper electrode.
The large meter on the left is disconnected from it's electrode but does not lose voltage immediately.
The connections were cleaned and gradually the voltage declined.
Finally the reading reached balance. This needs further experimentation and sorting out.
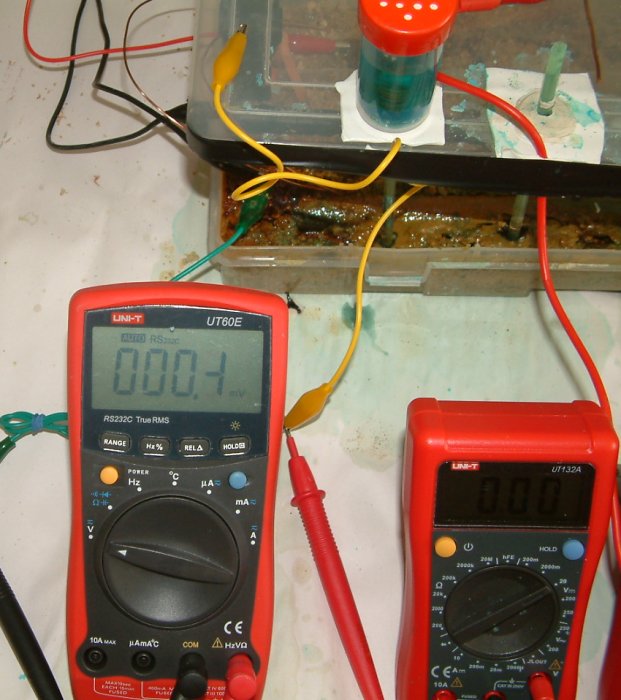
The two half-cells were taken from the tray and rested on the paper backing.
The voltage on the grey meter disappeared.
The voltage on the other meter declined and it was still connected to the subject pipe.
Even when totally disconnected the meter showed a declining value that must be investigated.
The following picture show the dismantling of the aparatus and are very informative.
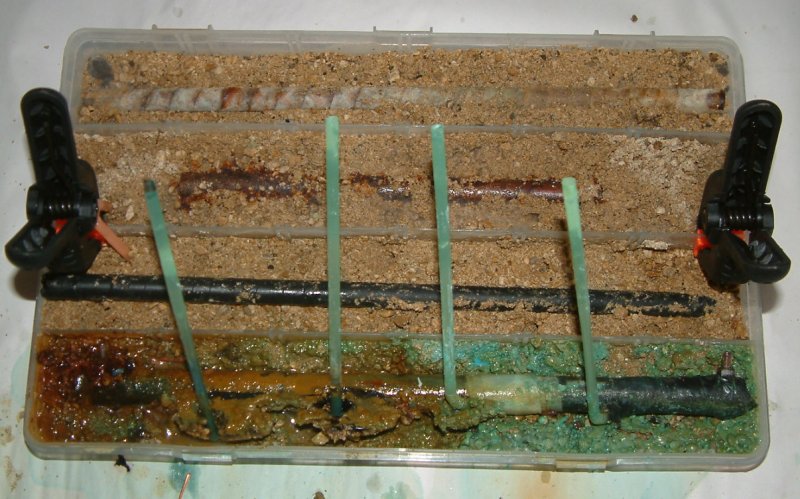
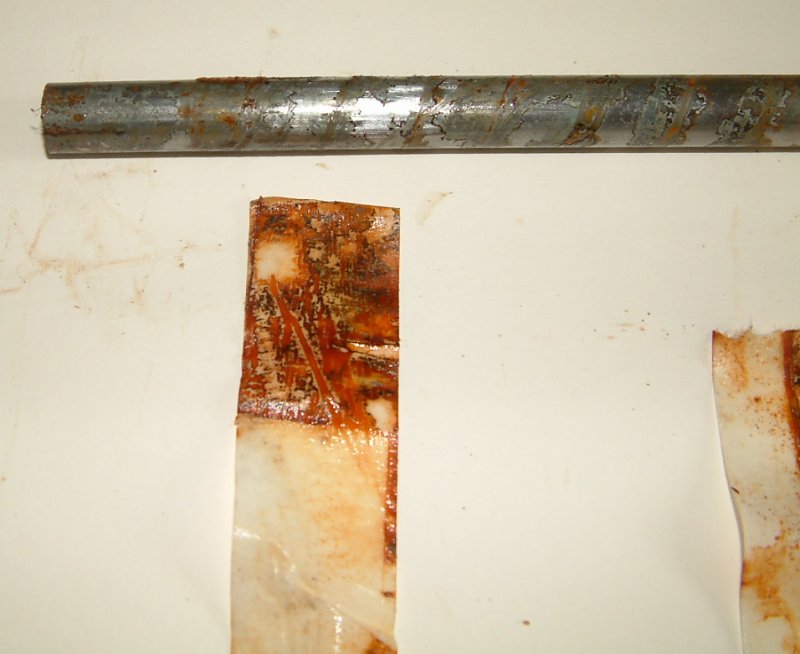
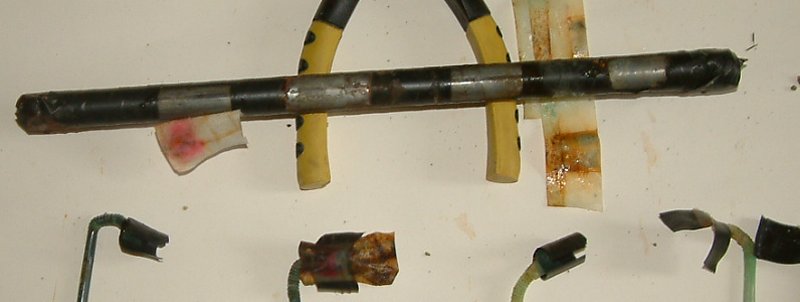
The pipes are seen in the same position as during the experiment.
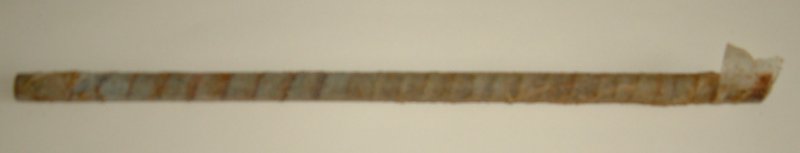
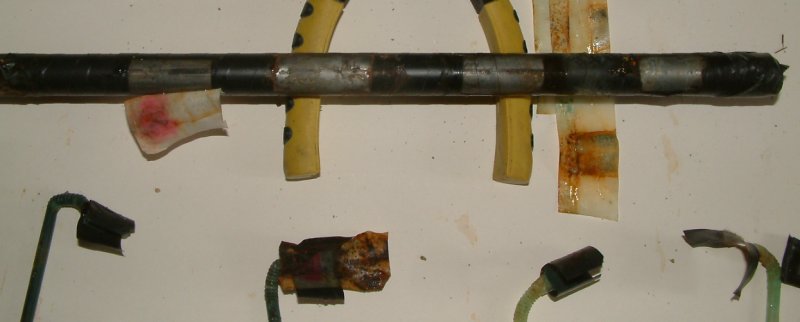
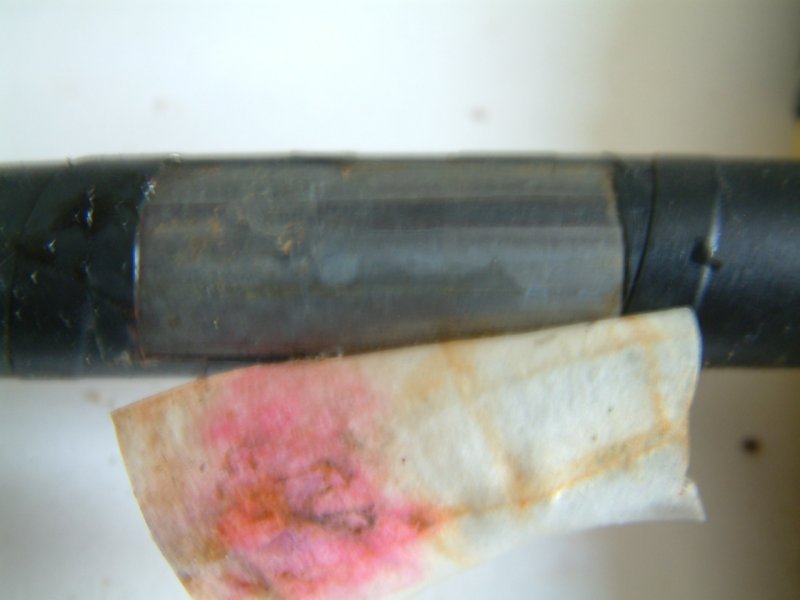
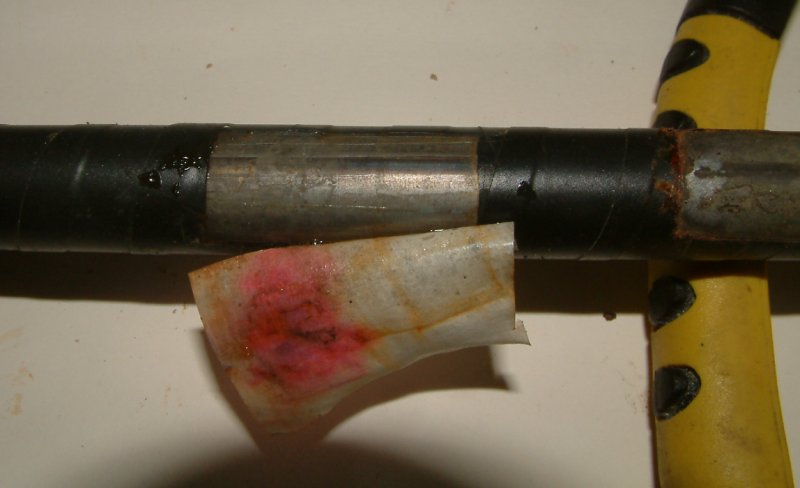
The pipe that was wrapped in masking tape is carefully cleaned off.
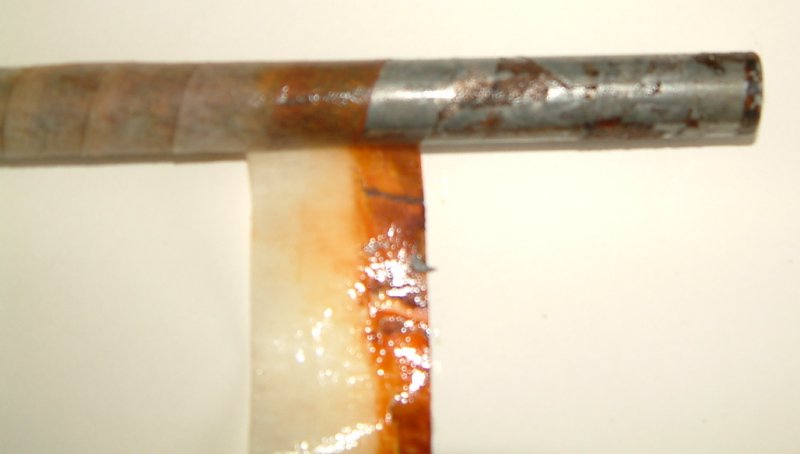
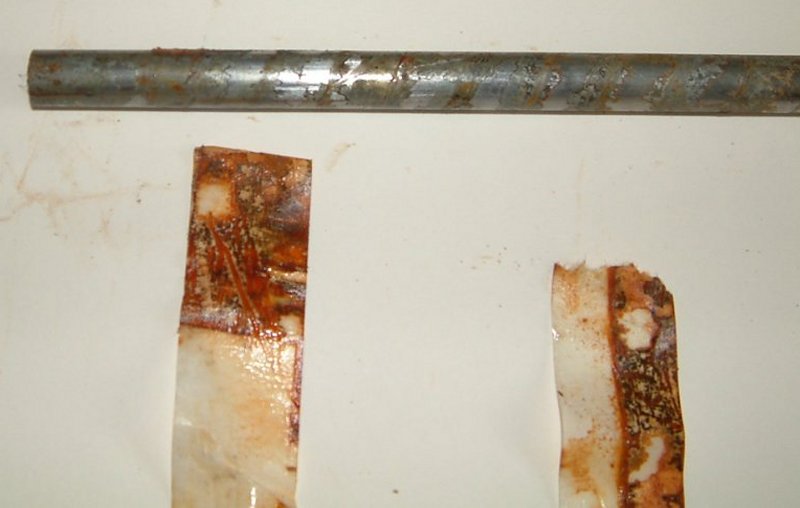
It is unwrapped, examined and photographed.
The wrapping is kept for analysis.
and the process noted for future experiments
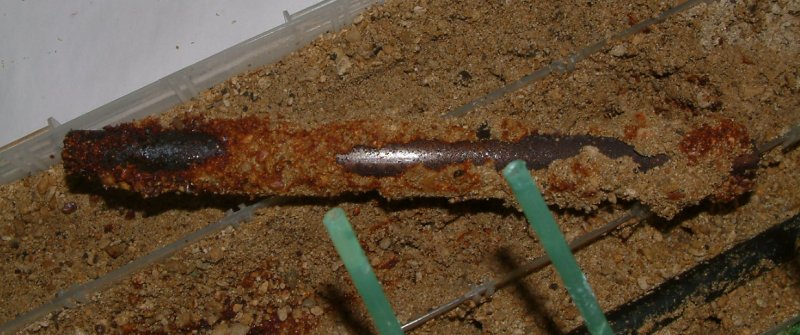
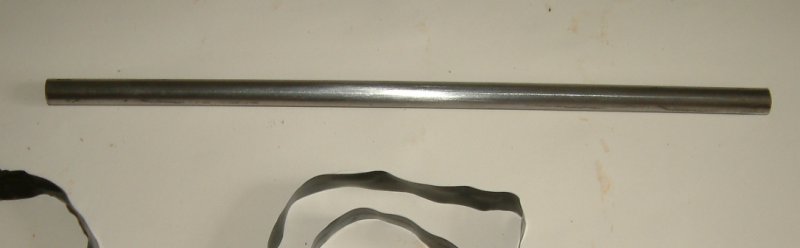
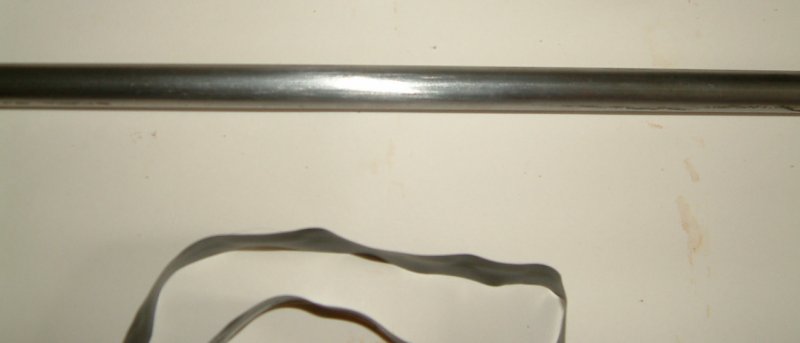
The anode is lifted from the sand, inspected and photographed.
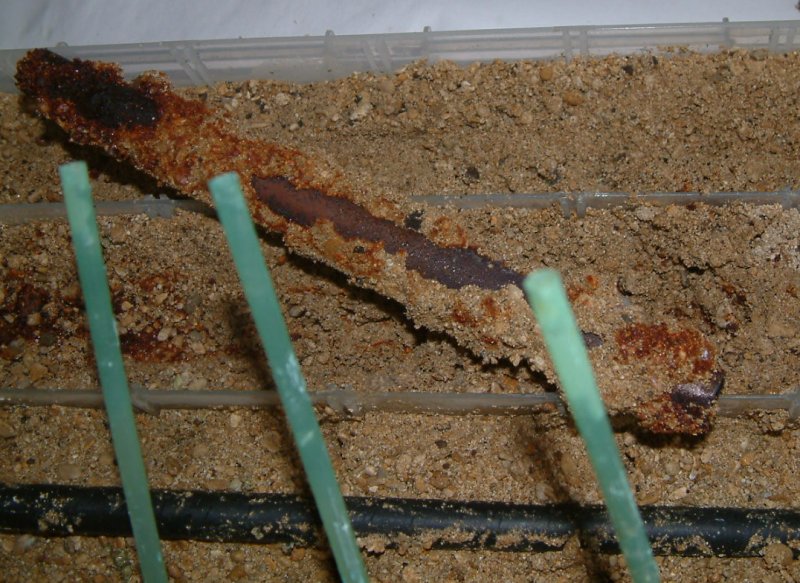
This has been subject to forced corrosion similar to that caused by interference current in the field. It is also like any impressed current anode into which charges are pumped to make the electrical potential higher than the surrounding ground.

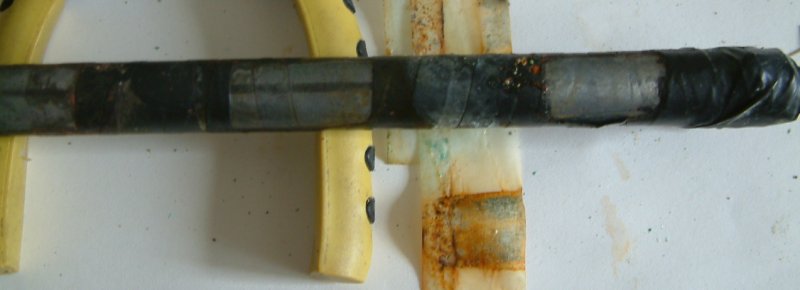
The fully coated pipe is removed from the tray.
It is unwrapped, inspected and photographed.
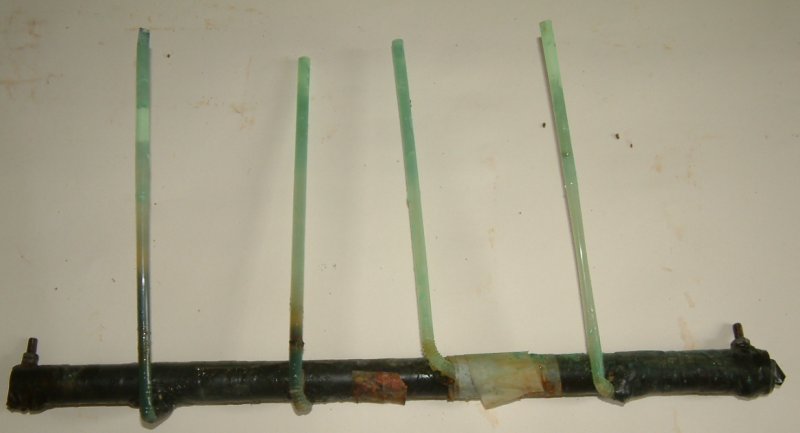
The subject pipe is removed from the tray and washed of sand.
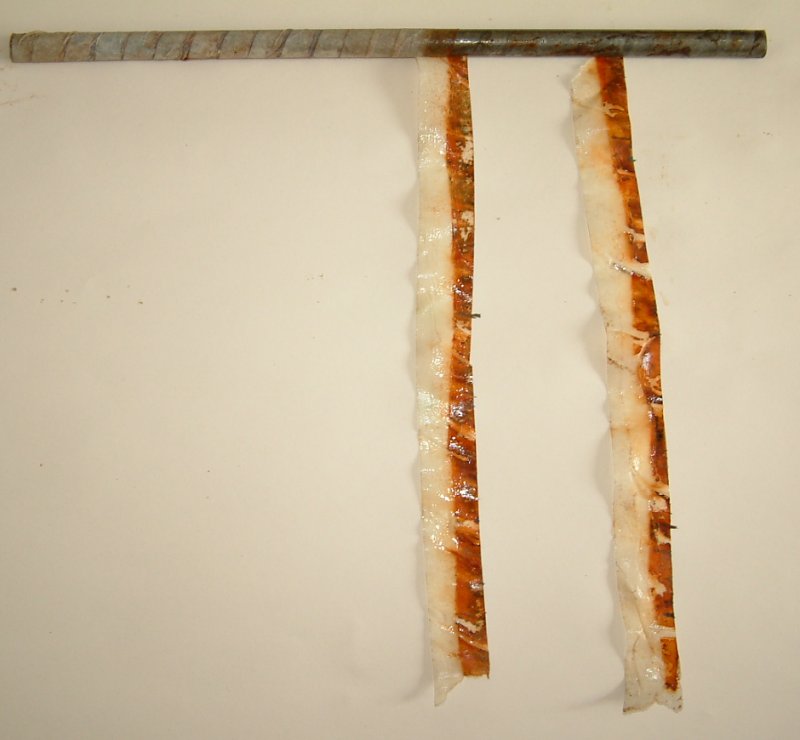
the Lugin capillaries are carefully removed.

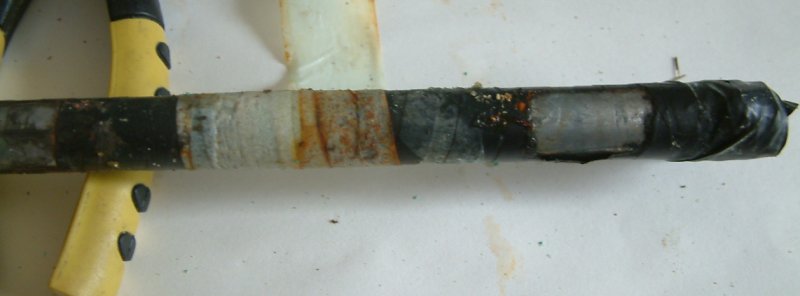
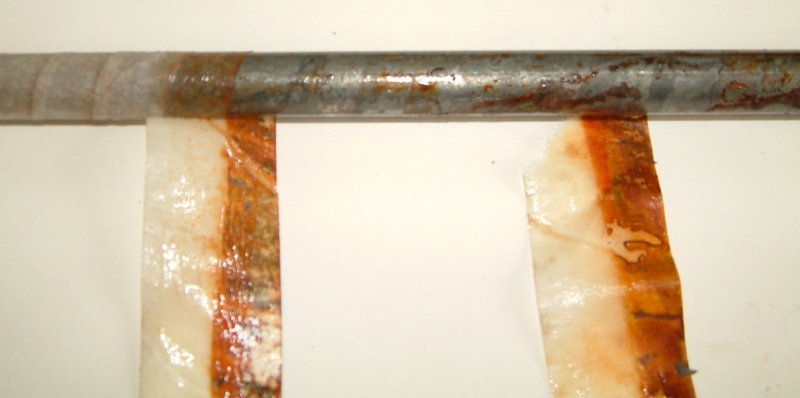
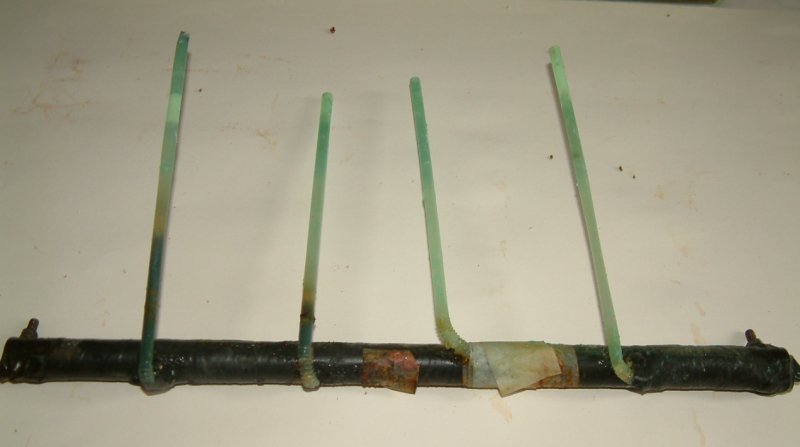
This shows the coating fault with anode and cathode.
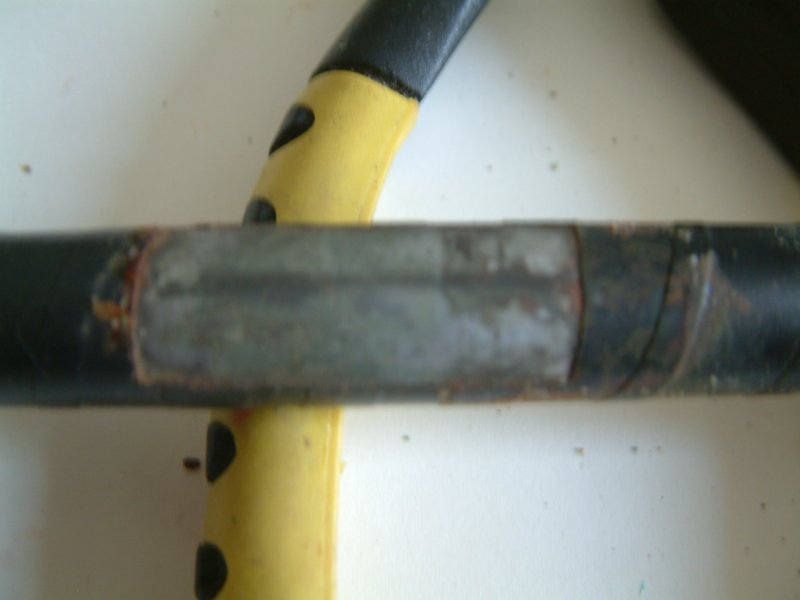
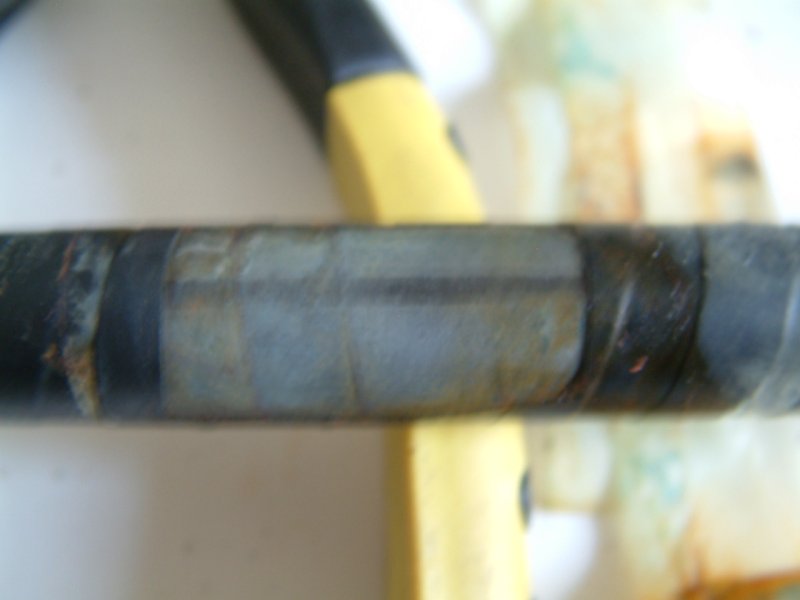
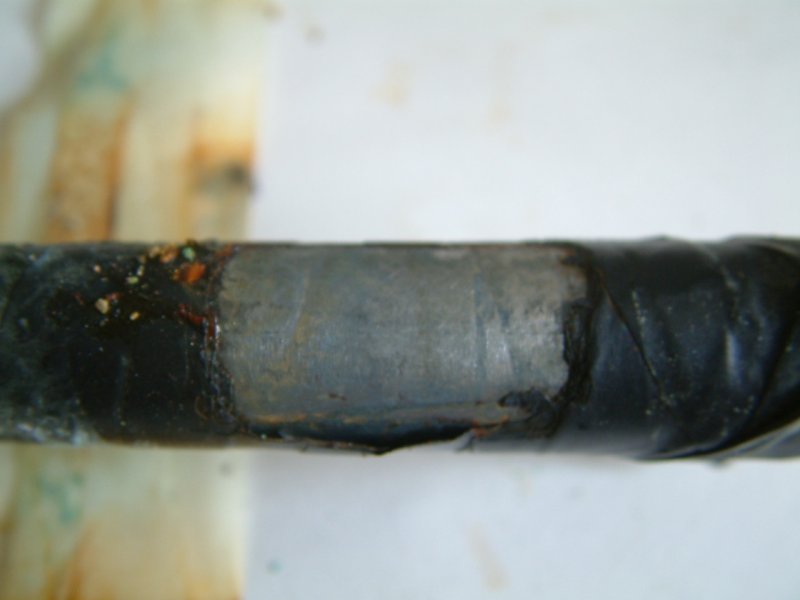
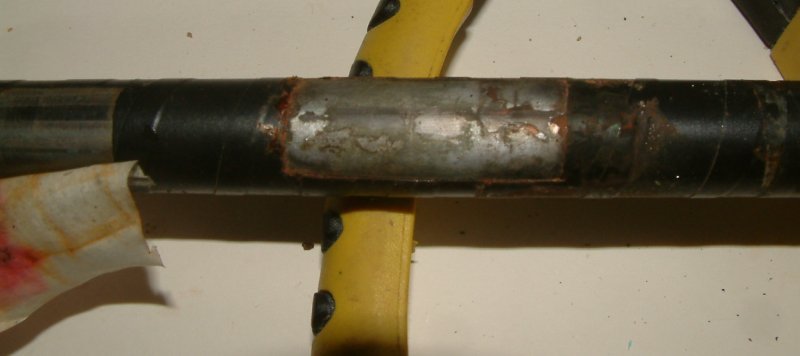

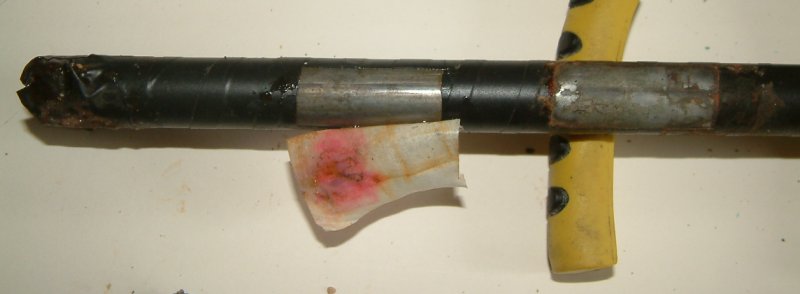
Each coating fault is examined and photographed and the corrosion product kept for analysis.


The coating is stripped back and inspected for signs of cathodic disbondment.

No conclusions are drawn from this experiment as science requires repeated observations.
It is very important that assumptions are not made on the basis of a single observation and therefore data and photographs must be recorded to be compared with further experiments.