
Cathodic Protection Interactive Experiment/Demonstration.
Bench experiments that show that the 'half-cell' is NOT a reference electrode.

'Pipe-to-soil potentials' are voltages.
The conventional cathodic protection measuring circuit has too many variables to be analysed.
The National Physical Laboratory in the UK saw this demonstration in 1984 but would not respond in writing.
The Institute of Corrosion Science and Technology saw this demonstration supported by site video clips in the 1980's.
This demonstration begs questions of many of the cathodic protection professional specialists who are practicing today and is supported by electronics and electrical engineers universally.
DCVG proves that this demonstration is correct and disproves any attempt to analyse CIPS in the conventional way.
This is a model of the electrical situation that we must confront in the application of cathodic protection to pipelines. We need to model a pipeline with a coating fault buried at the top of layers that will represent the stratas of the ground that conduct electrical charges from the anode of an impressed current cathodic protection system.
Using a plastic tray makes it possible to make closed circuit measurements that are not possible in field work but the metal in the bottom of the tray can be used to illustrate the notion of 'remote earth' that must be considered during the application of cathodic protection.
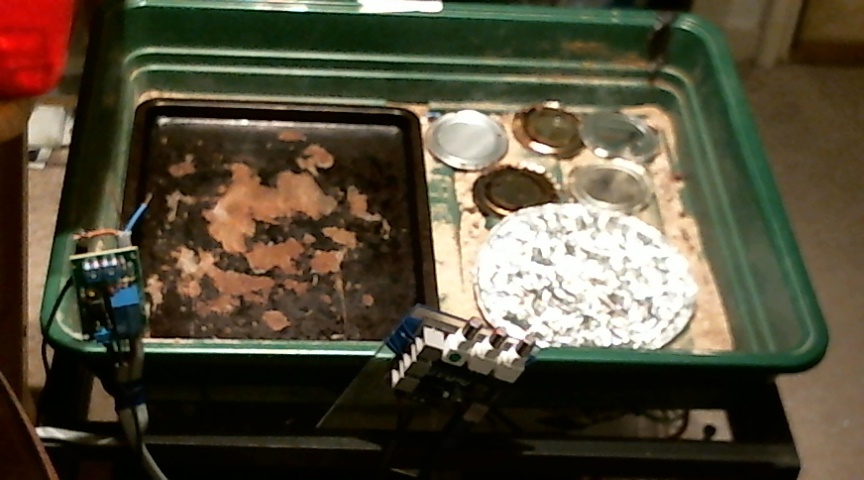
You can see that I have used a steel baking tin, an aluminium pie case and some can lids. These are conductive and random as are the layers in the ground. For example, deep well groundbeds can pass through all sorts of unpredictable conductivities in strata the affect the distribution of charges. Although it is impossible to model the actual effects, the layering in this demonstration is better than using a homogenous ground material to represent the structure that we are trying to visualise.
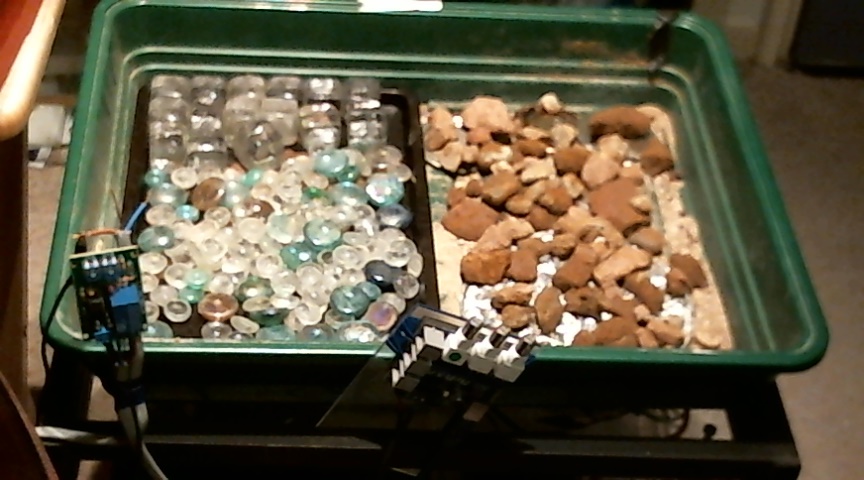
In this picture you can see that I have strewn a variety of rocks over the metal layer and these represent a random layer of resistances.
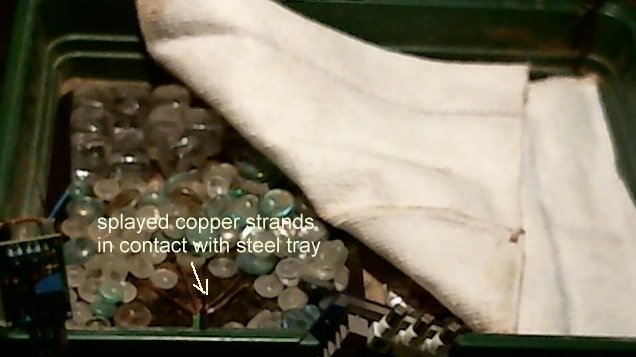
In this picture you can see a conductive path between the metal layer and the the surface such as might be provided by a deep well groundbed. This is a splayed copper earthing cale that can be seen at the front edge of the tray.
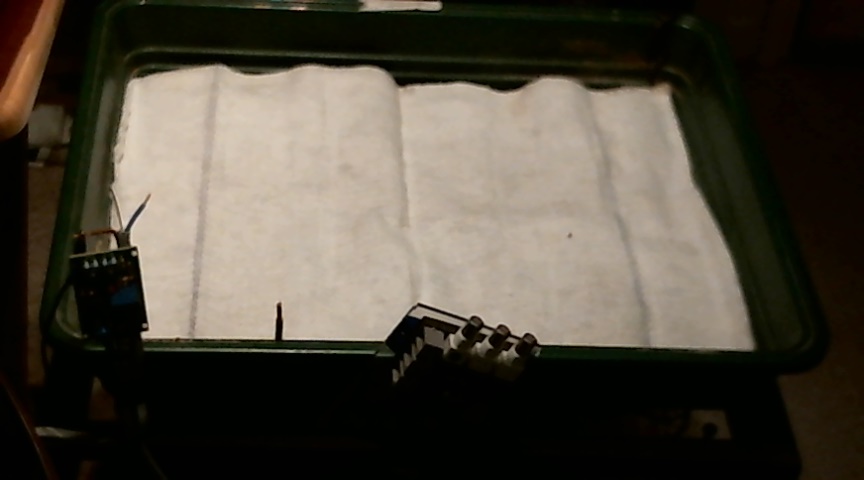
This layer of cloth represents the layer of organic material resulting from prehistoric forests and the like.
This layer of soil represents the sedimentary deposites from rivers, glaciers and the sea.
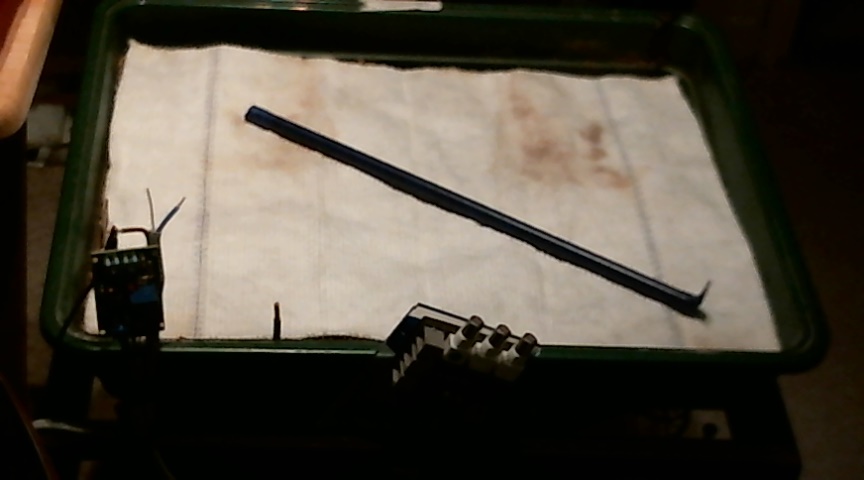
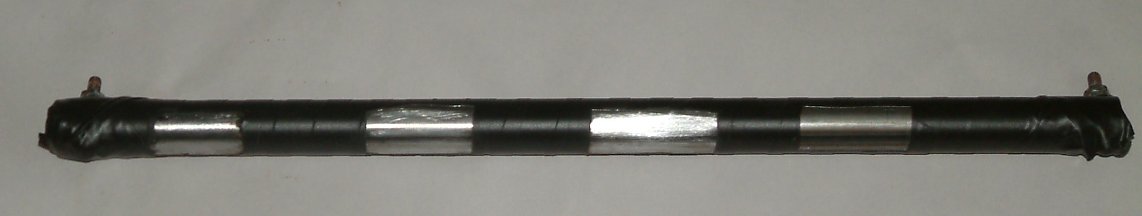
This is another organic layer, down to which the pipeline trench is excavated. The tape wrapped pipe rests on this cloth in the way that a normal pipeline is laid on selective backkfill.
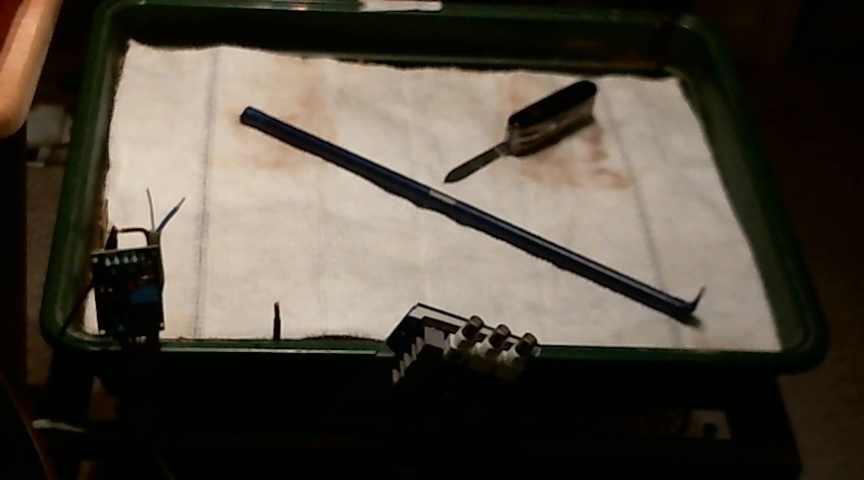
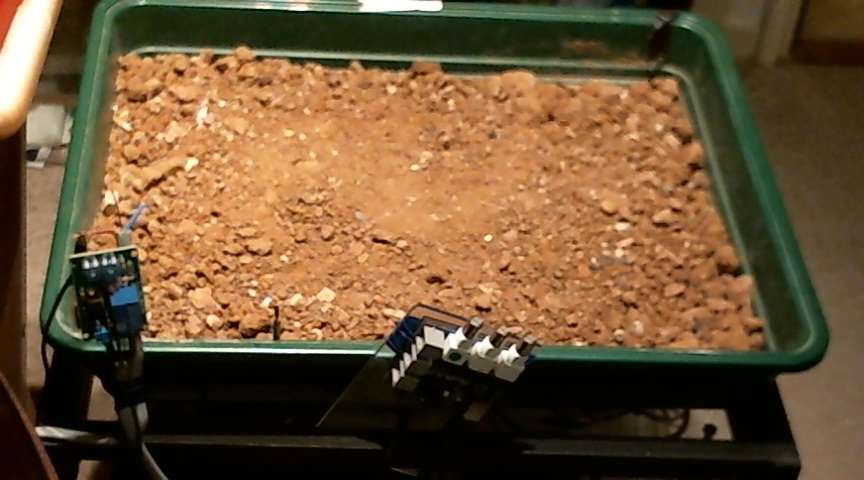
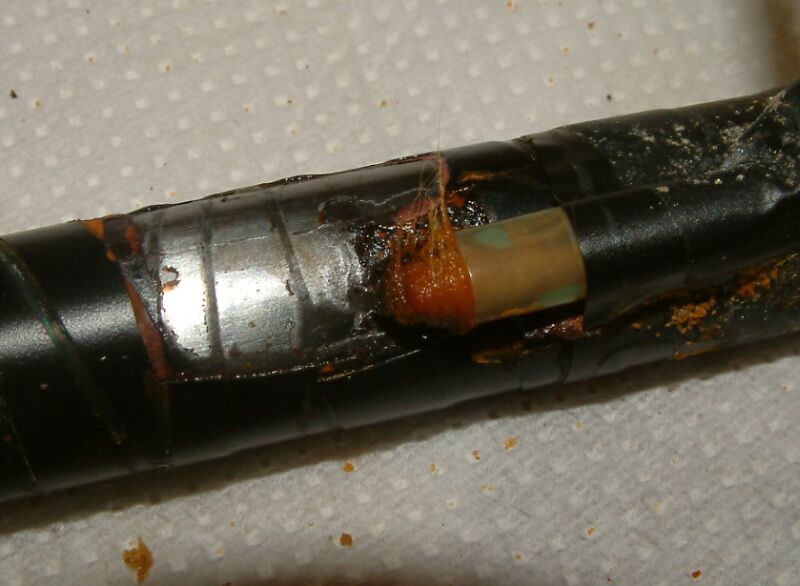
A fault is made in the coated pipeline so that we can study the flow of charges from the cathodic protection anode to the protected pipeline
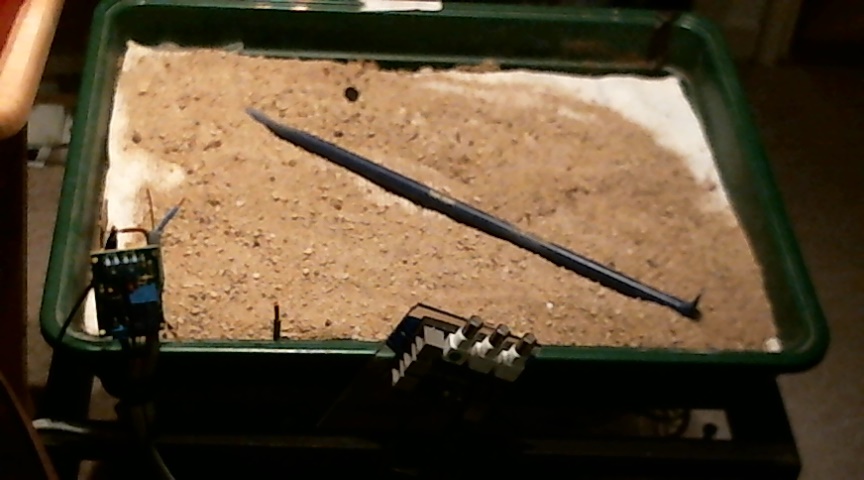
A layer of subsoil is added to the model to cover the pipeline
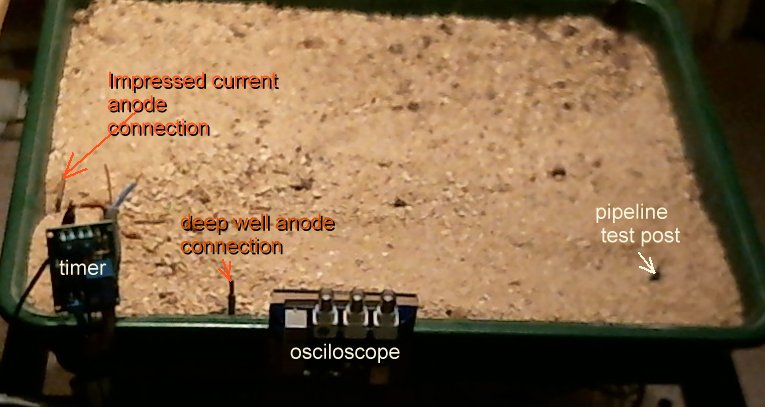
You can see the pipeline test post and along the front edge of the platic tray you can see the electronic timer, the deep well anode connection and the osciloscope.
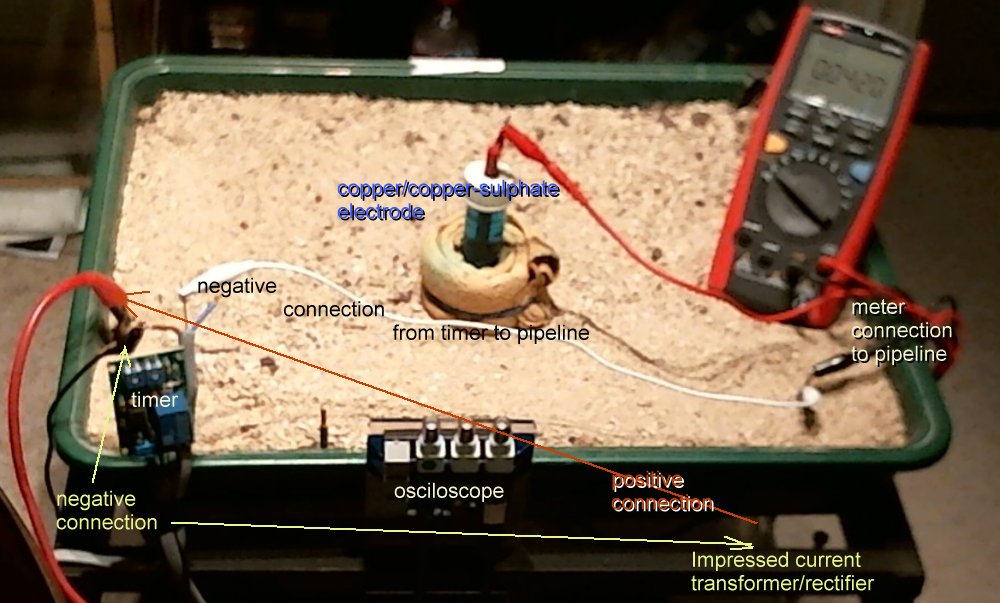
The basic set up of these experiments is easier to understand with the meter and the ground contact electrode in place to simulate a standard 'pipe-to-soil potential' measurment.
It can be seen that this is a voltage measurement between the potential of the copper rod in the saturated solution of copper sulphate and the metal of the pipeline.
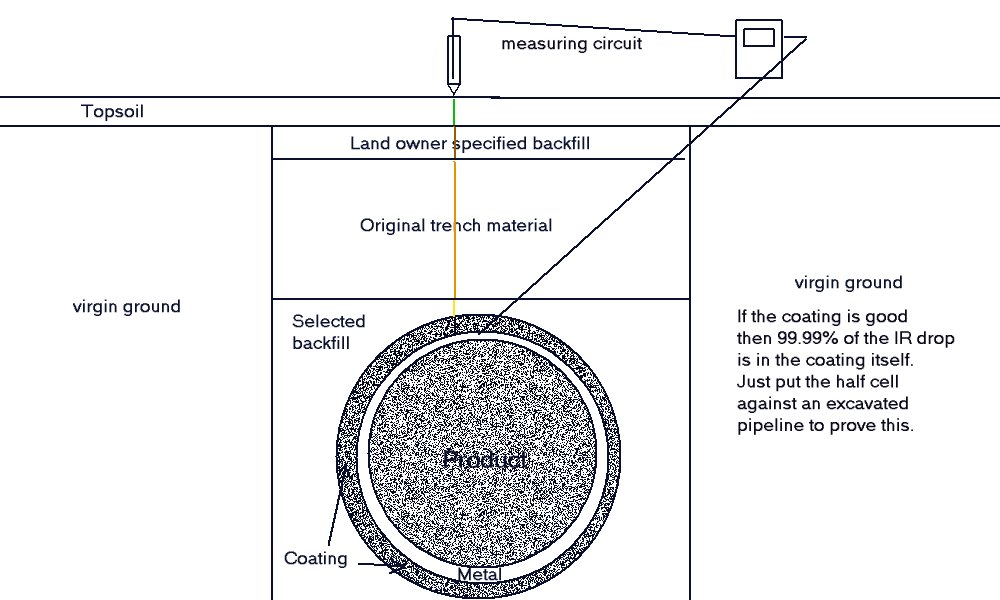
The voltage measurements that we record during these experiments are similar to the measuring circuit experienced in field work that can be seen in this drawing.
We now need to examine the copper/copper-sulphate electrode.
It is a copper rod in a tube containing copper sulphate solution. Specialists claim that it has to be pure, saturated solution of copper sulphate or it will give innaccurate readings. Brian Wyatt claims that a half-cell scans a section of a pipeline but does not say how. NACE sell scientific papers written by people who call it a reference electrode.
Professional corrosion control engineers talk of 'pipe-to-soil' potentials and describe the measuring circuit as including an 'internationally recognised potential' against which we might measure a voltage.
This demonstration proves that the measuring circuit consists of a series of potentials that cannot be separated, measured individually or even mathmatically defined or removed.
It will be seen that switching off the cathodic protection system does not remove the inherent errors Described by some as the IR Drop in the soil) but leads to a confusion of readings that cannot be analysed as they are measured between two floating potentials.
Millions such readings are recorded daily in surveys known as CIPS or Close Interval Potential Surveys.
This animation shows that when the two 'half-cells' are close together there is little difference in their potentials ... 0.0021v and 0.0018v in this animation.

When they are moved about the tray you can see that the voltage changes 1.0470v through -0.0726v
The change in voltages is because the potential of the soil is different in each part of the tray. This is due to the reactions that are going on in the construct of the layers within the tray. This is similar to the electrical flux that is detected in cathodic protection field work.
In the above animation the two electrodes remain in the same position but the transformer rectifier is switched in and out of the circuit. It is not energised but it's presence alters the equilibrium of the complete system as seen by the changing voltages.
The next animation shows the readings being impossible to analyse because of switching and moving as experienced by all those engaging in CIPS surveys.
These voltages have all resulted from the difference between two potentials that are claimed to be a standard reference. The next animation shows the meter connected between the pipeline test post and the electrode. The spare electrode has been placed at the back of the tray to confirm that it is not connected to anything.

The next animation shows the readings being impossible to analyse because of switching and moving as experienced by all those engaging in CIPS surveys.

You can see that the variety of voltages cannot be related to anything in particular without a great deal of further information. Even then it will not indicate the corrosion status of the pipeline or the effectiveness of the cathodic protection system.
The following pictures show soundly based science.
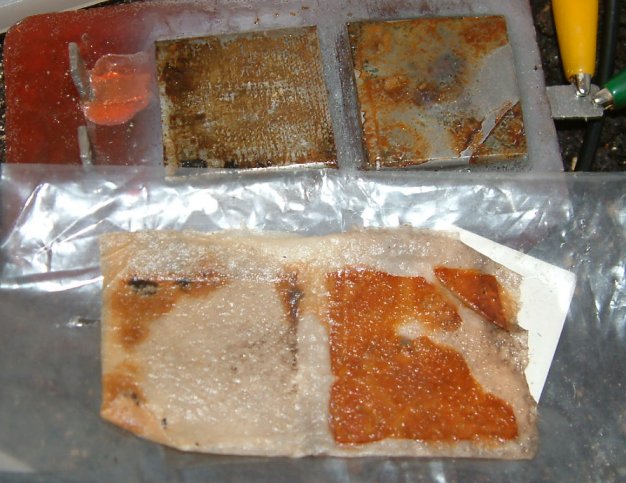
The correct way to measure the interface reaction is at the anode of a corrosion cell using a Lugin capillary and.
The straws were filled with inert conductive gel between the prepared anodes of each coating fault.
Several runs of the experiment were carried out to examine many features of cathodic protection monitoring.
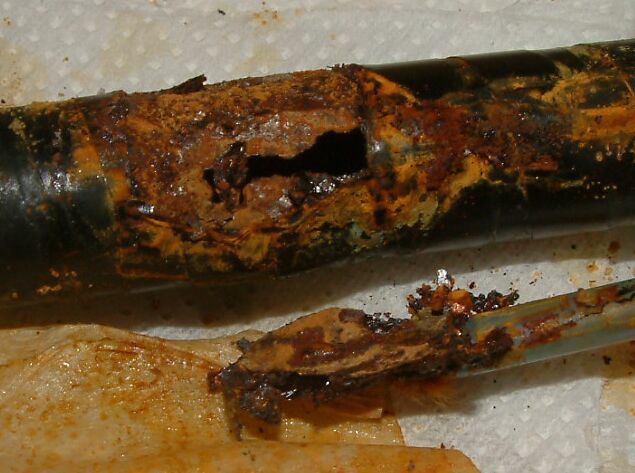
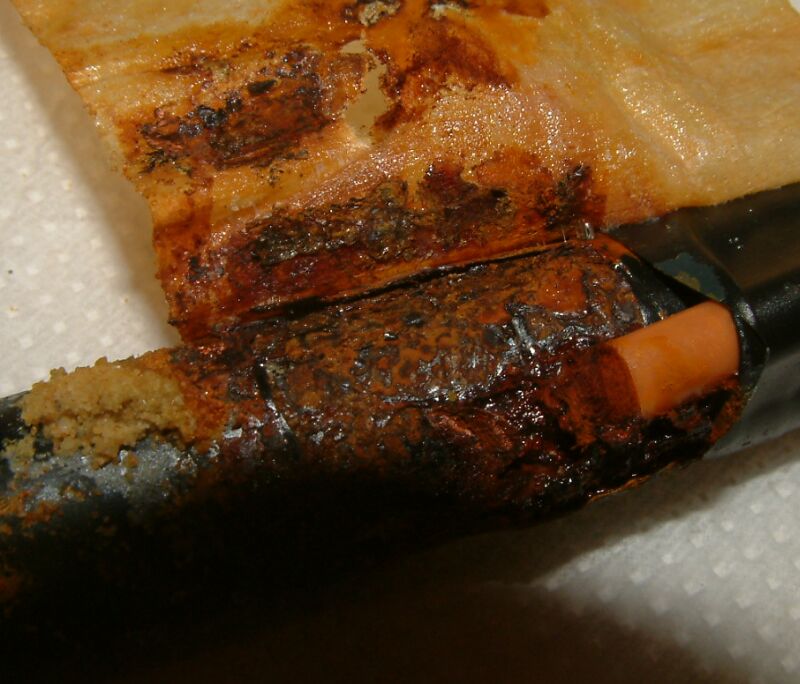
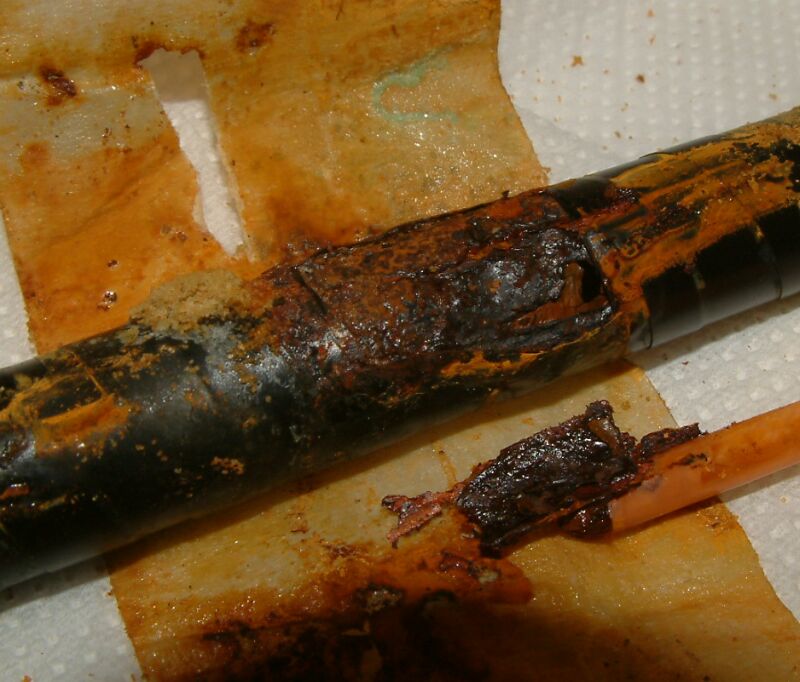
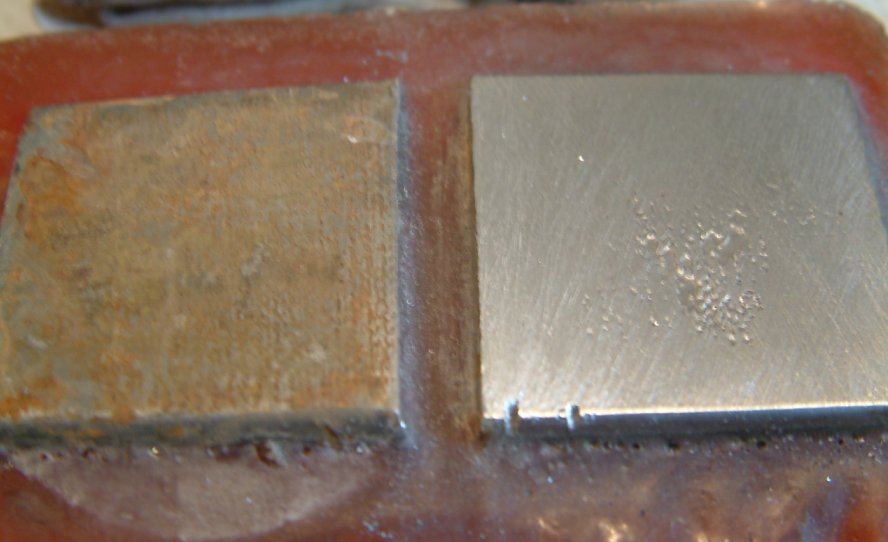
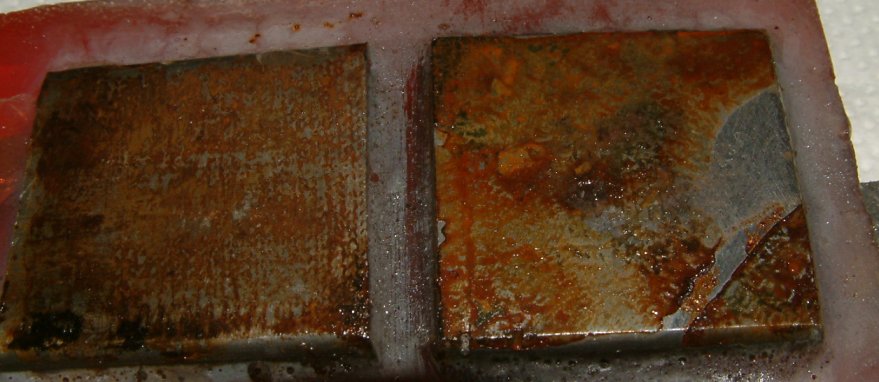
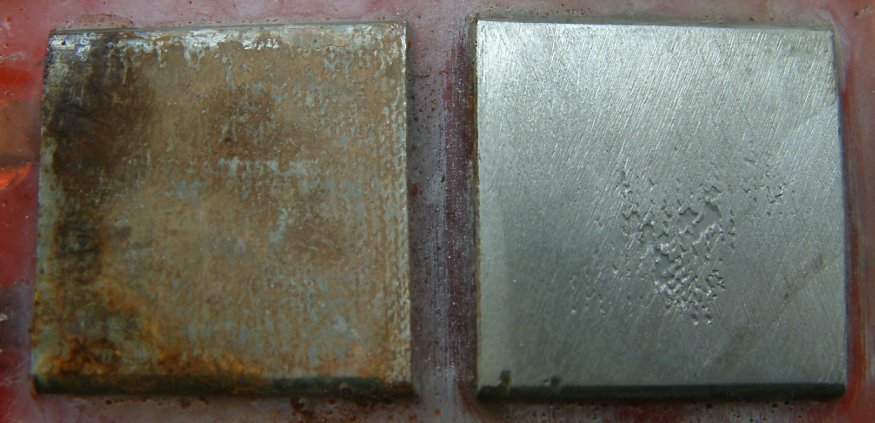
After each run of each experiment the subject pipe was unearthed.
It was cleaned and examined.
and then examined.
The following pictures need no explanation
The remaining pictures are of the Alexander Cell as it was used to confirm the corrosion current and real interface potentials during these experiments. The Alexander cell IS A CORROSION CELL.

A CIPS survey cannot be analysed without a voltage value as a criterion. The Alexander Cell was invented for this purpose and has been proved correct whenever used.
It has been suppressed for commercial reasons and I have complete documentation to support this allegation.