Pipeline Corrosion Control
74 DALCROSS
BRACKNELL
BERKSHIRE
RG12 0UL
Cathodic Protection Network Laboratory
This is the second in the series examining the actual measuring of corrosion.
In this series we use a copper/copper-sulphate electrode made of a plastic tube (the shell of a ball point pen) filled with copper-sulphate solution and a copper wire to connect to the probe of the meter.
The probe of this electrode is a tooth pick .
This serves as a luggin capillary to contact the electrolyte in which the subject metal us immersed.
halfcells
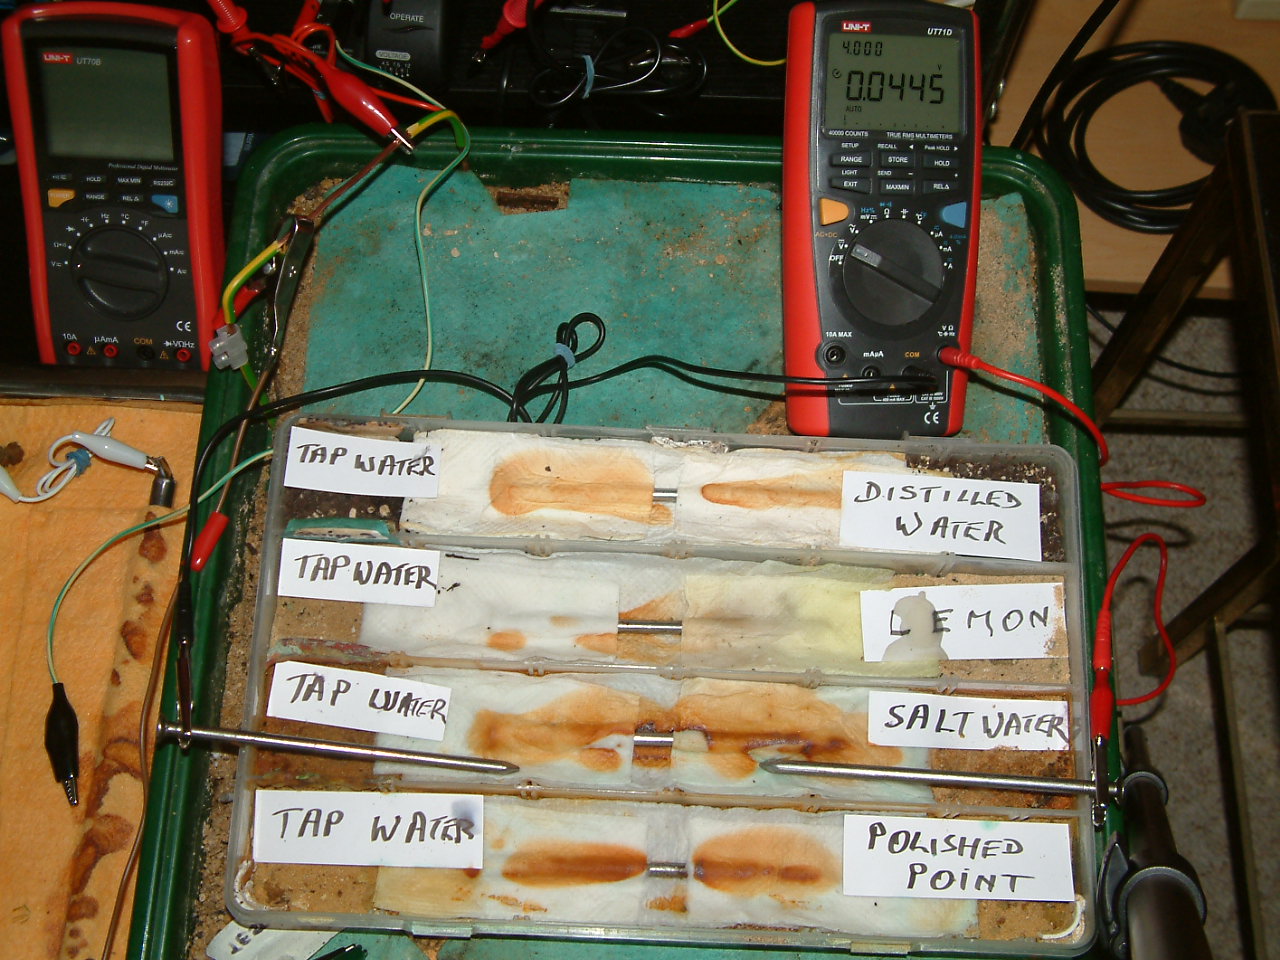
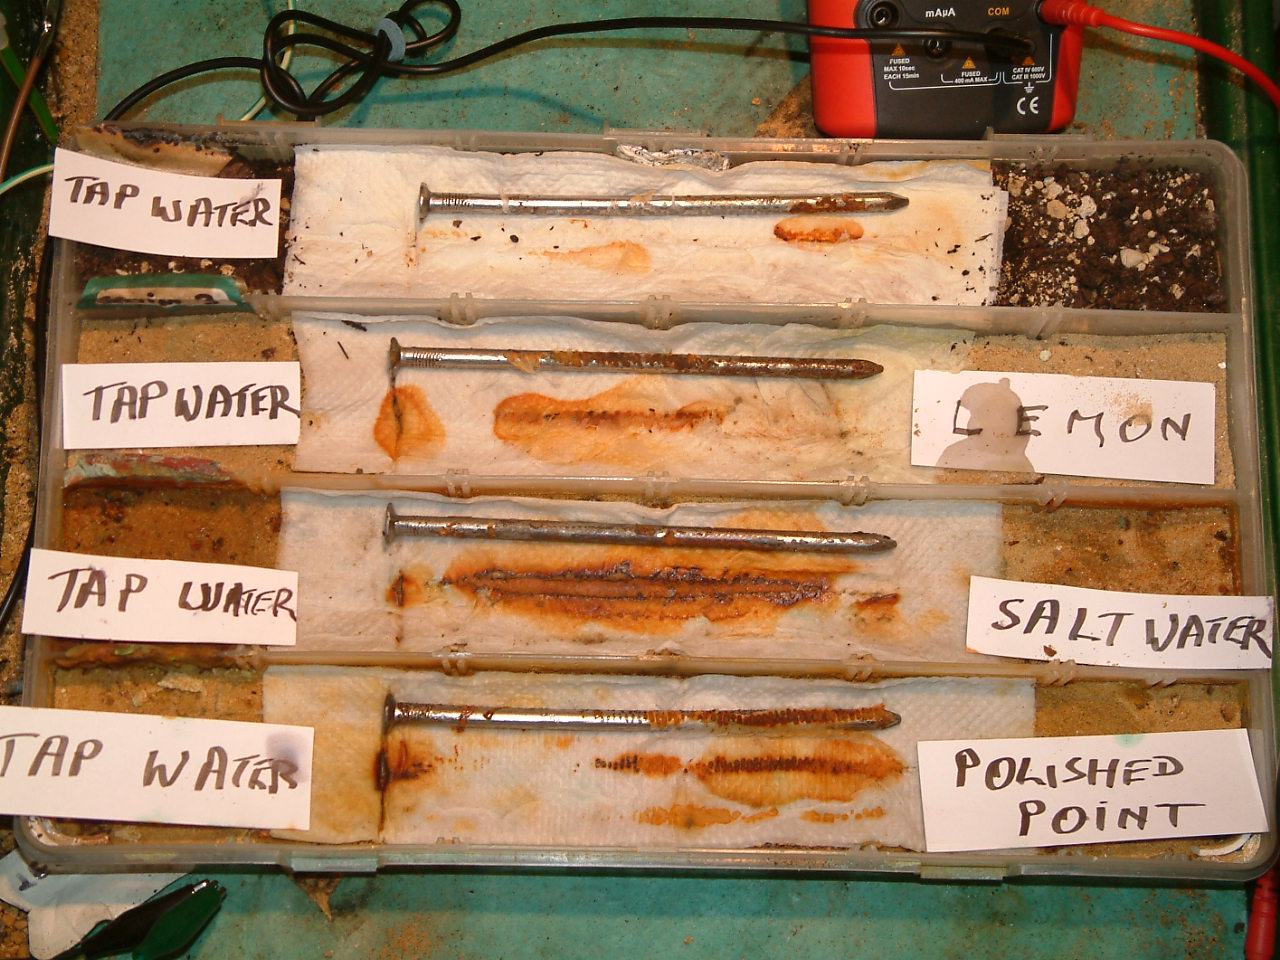
The next four pictures show the voltages between two nails when they are ontacting the electrolyte in which the subject nails can be seen to be corroding.
nailprobe1
You can see the voltage on the meter change as the nail-probes are moved. The nail connected to the meter 'common' is seen as the zero.
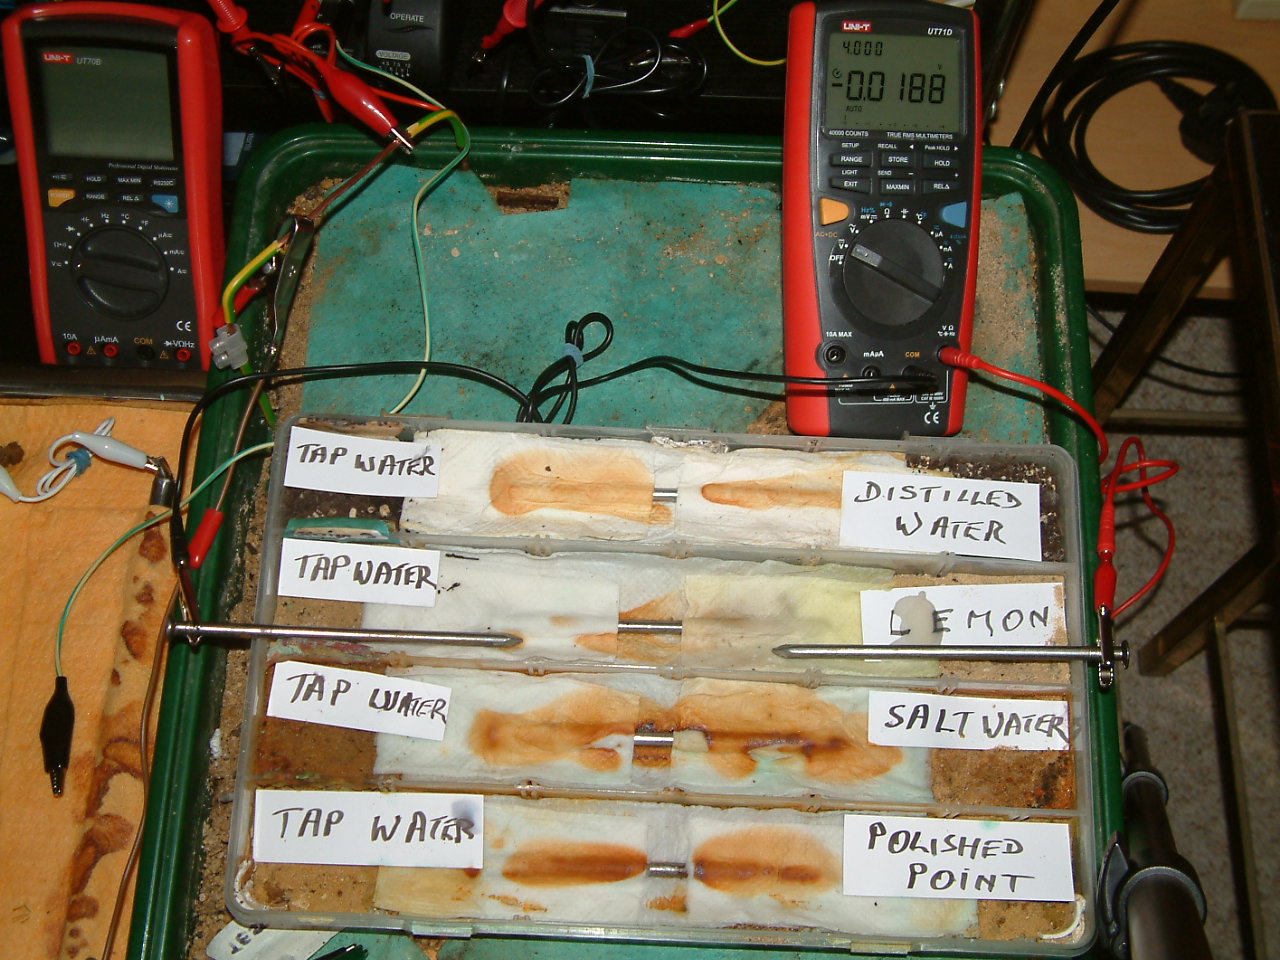
nailprobe2
The voltage on the meter is due to the potential of each probe-nail being different. The left hand nail-probe is zero for the purposes of the meter display.
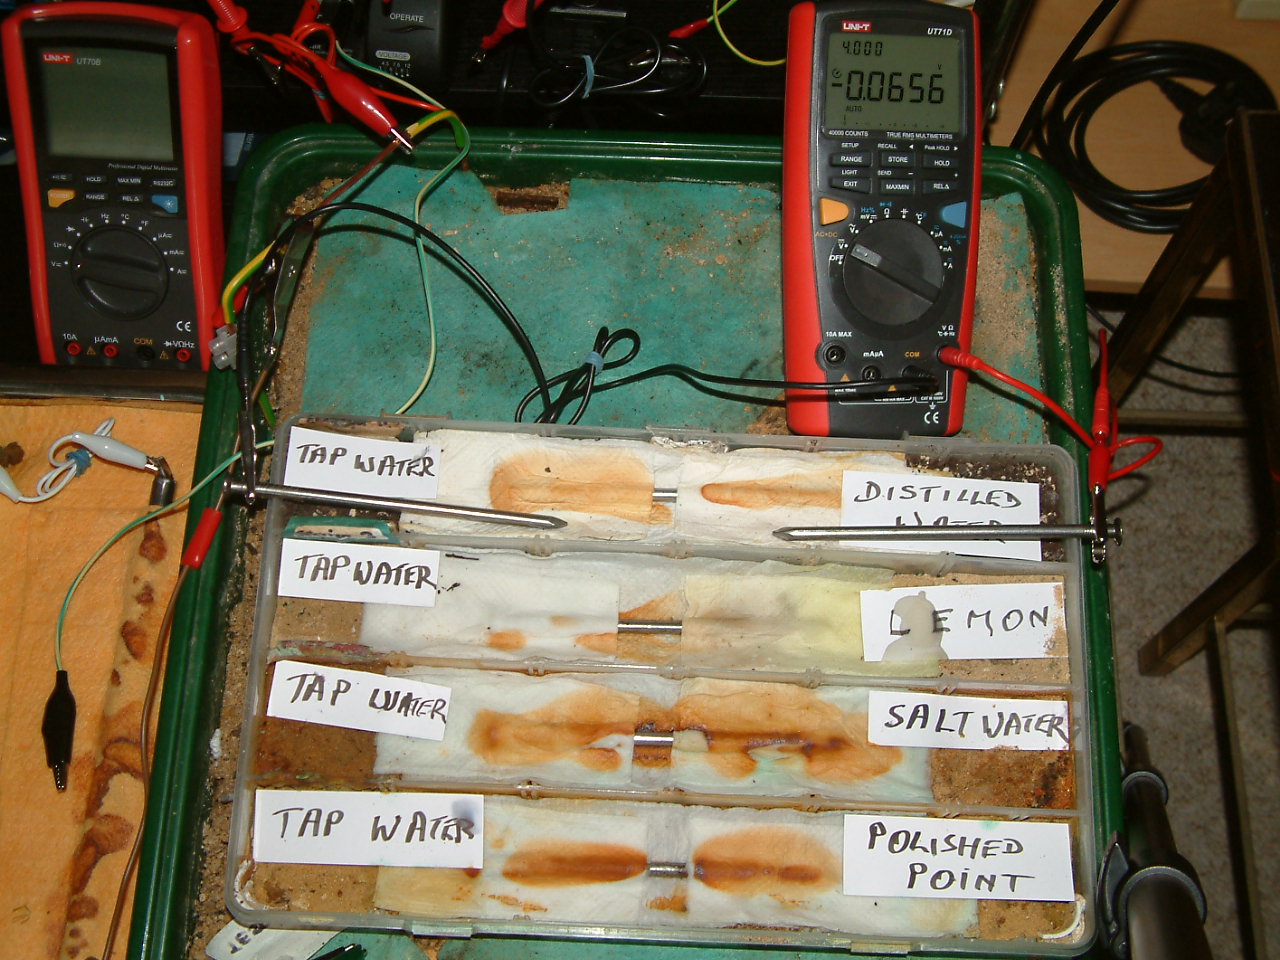
nailprobe3
The steel of each nail-probe has a reaction to the electrolyte that it contacts. This reaction EMF is added to the measuring circuit.
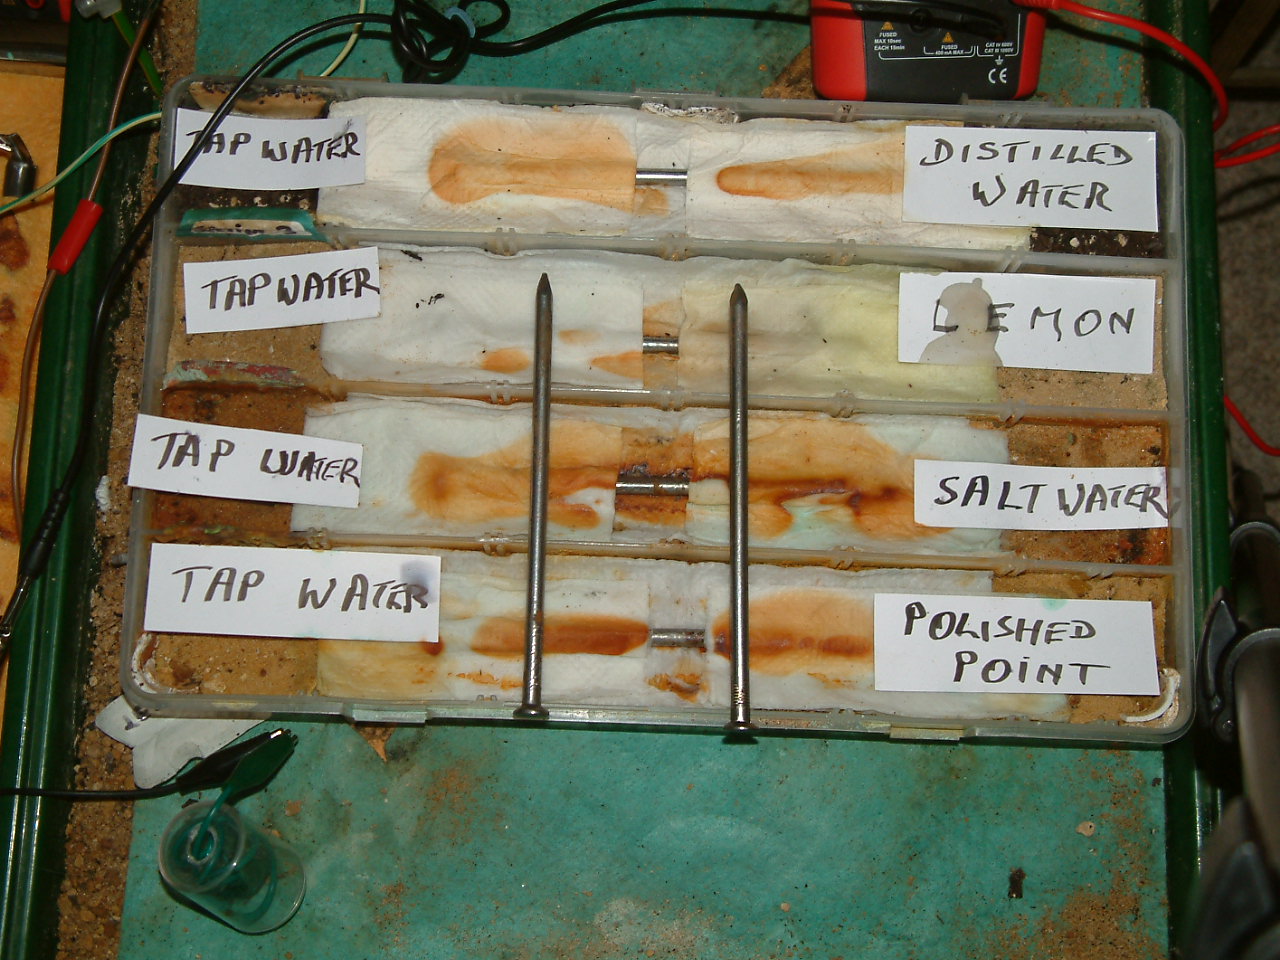
nailprobe4
This reaction potential is added to the potential of the electrolyte at both contact points. The potential of the electrolyte is due to other 'electrical pressures'. This is similar to the measuring circuits that we encounter in applied cathodic protection.
probenails
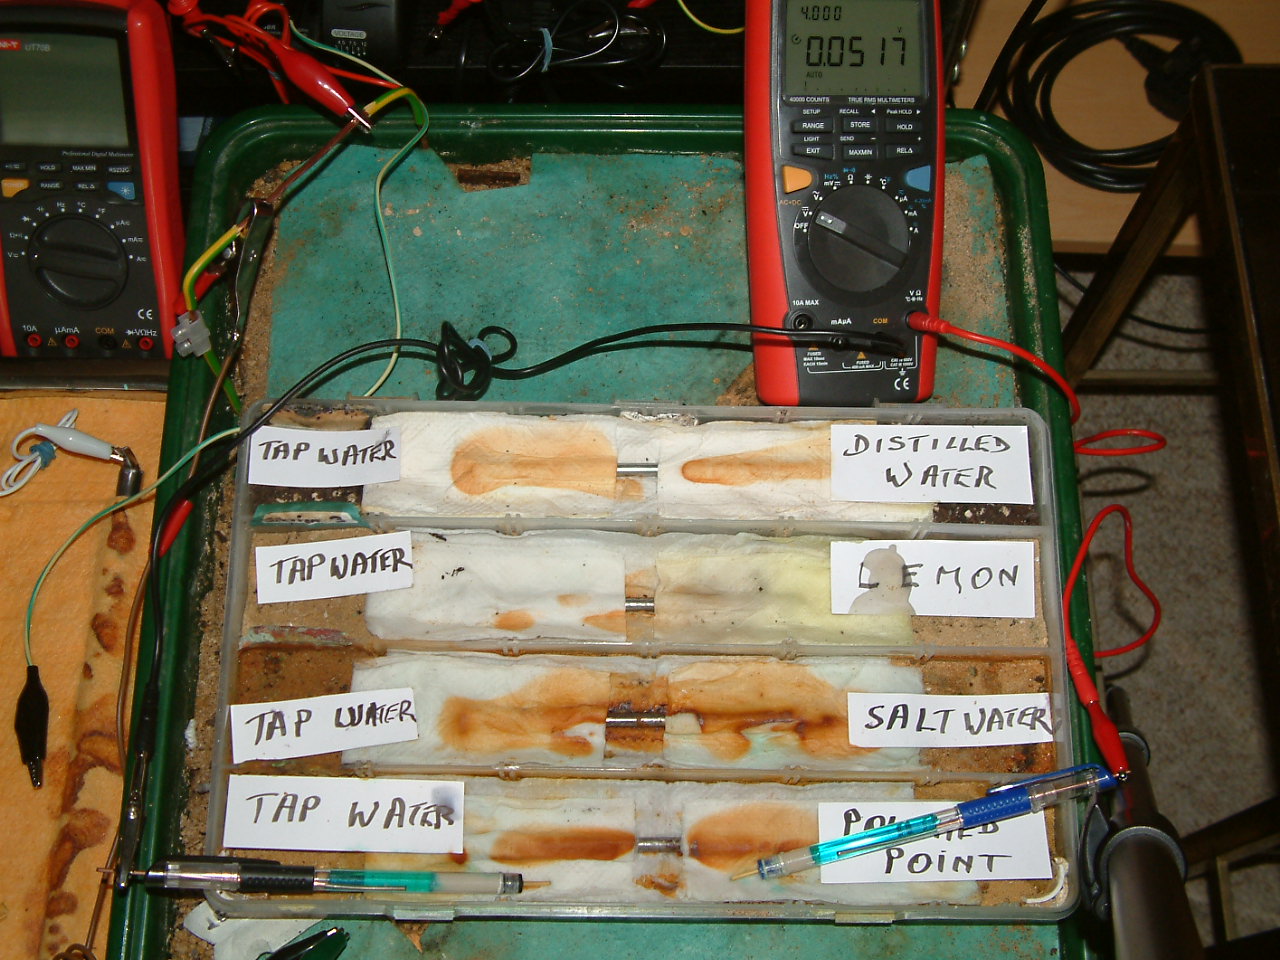
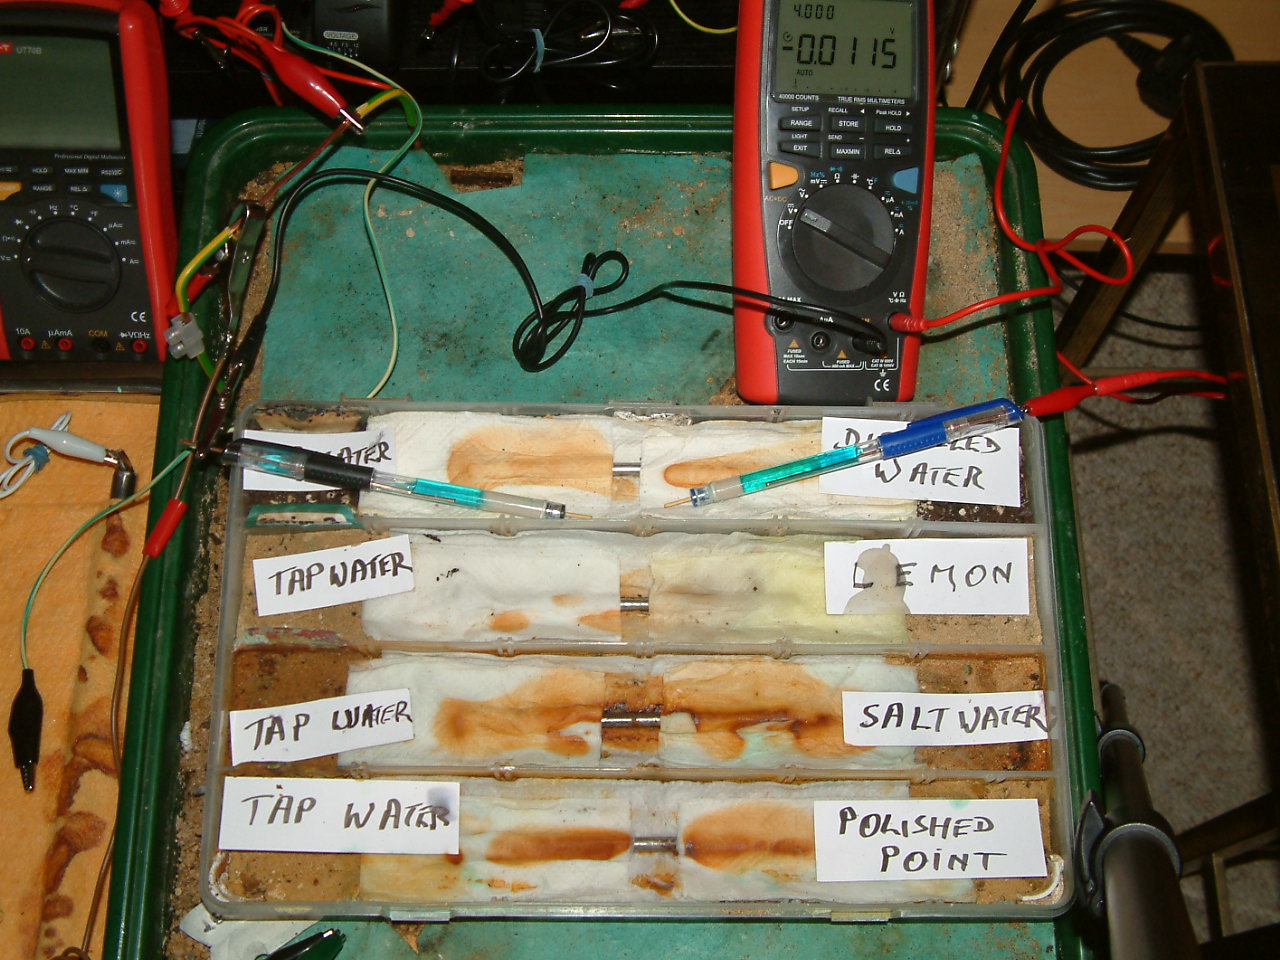
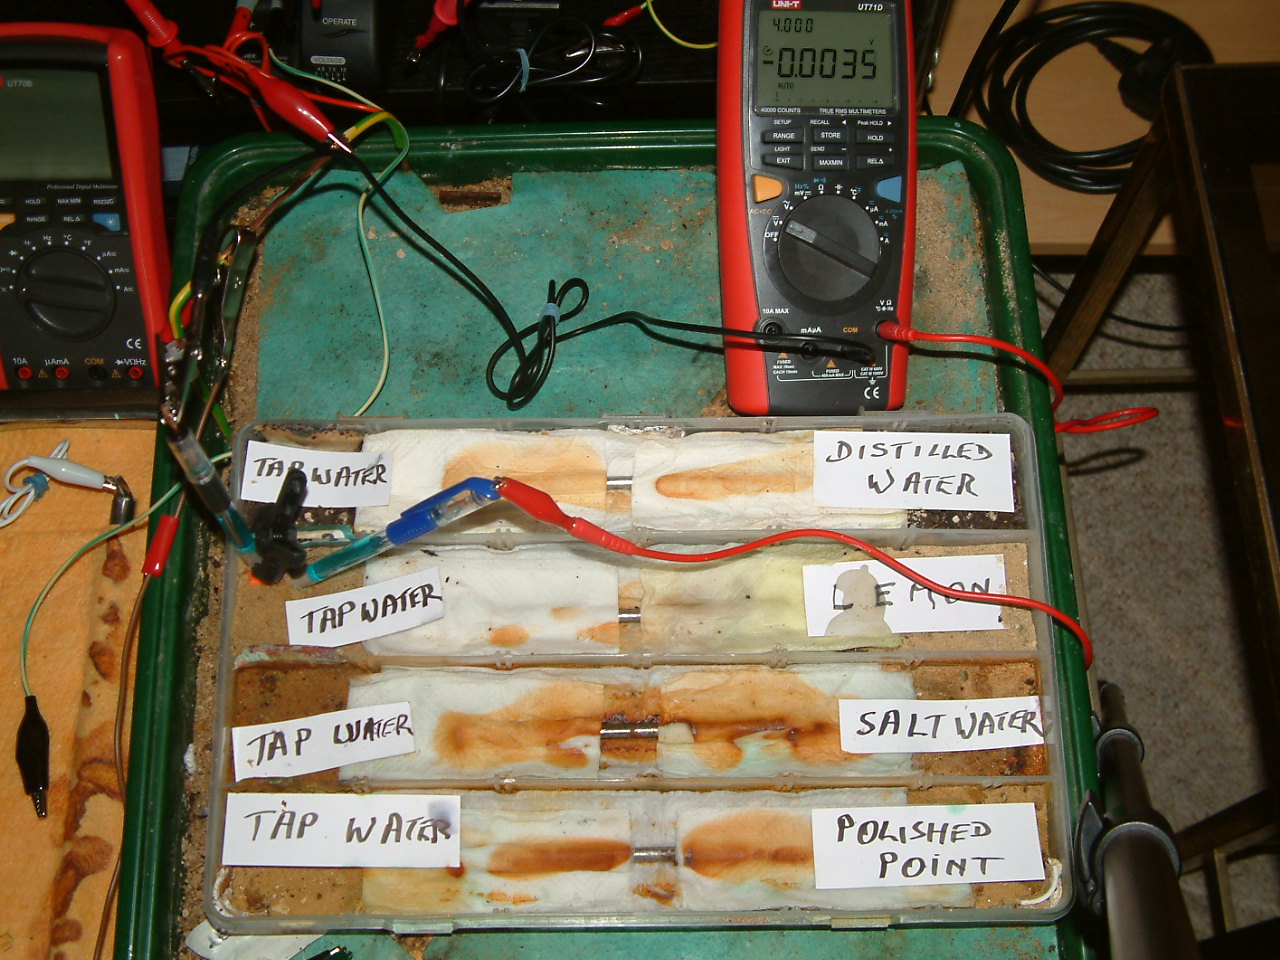
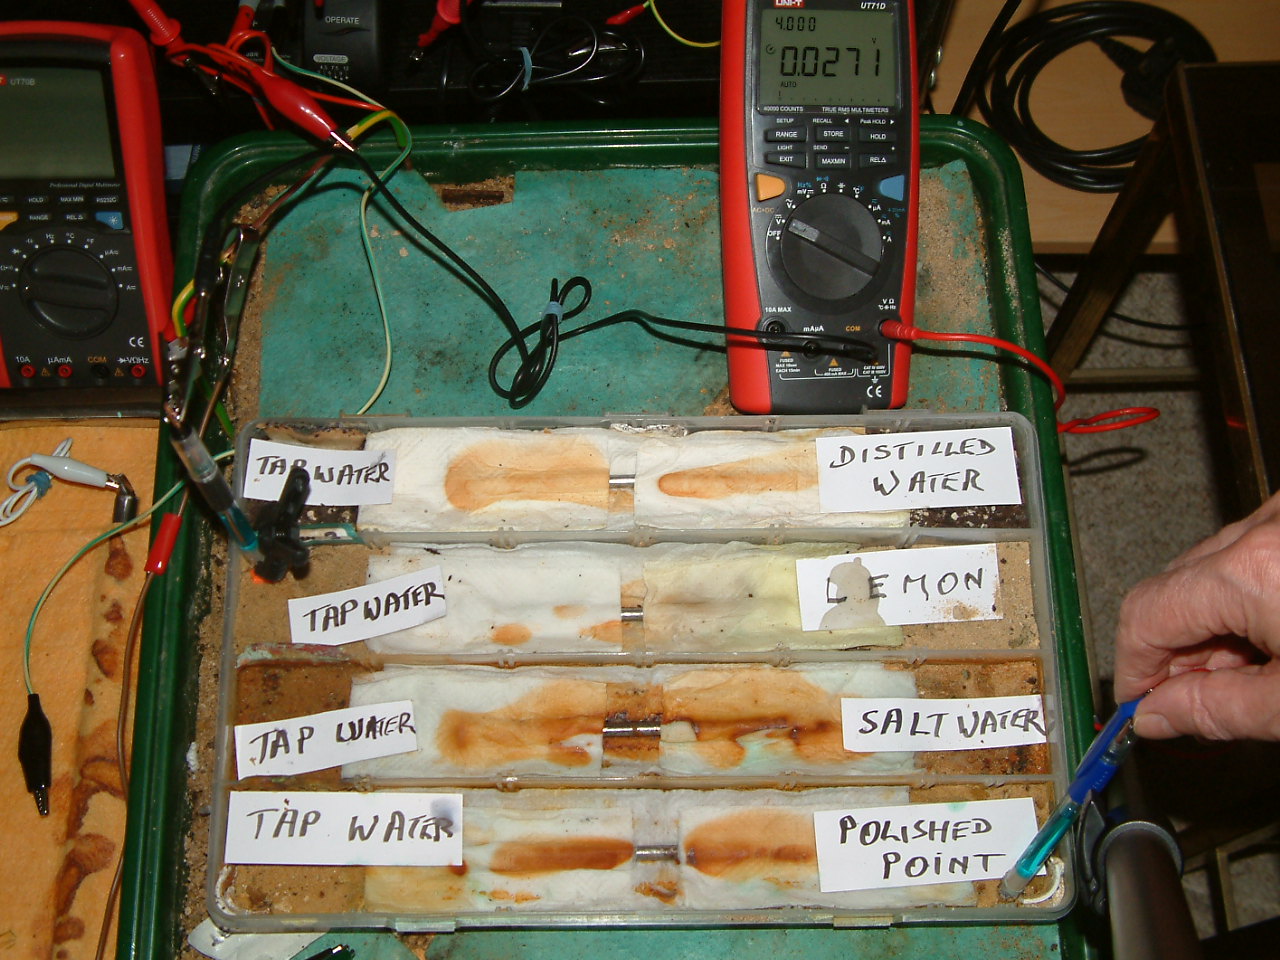
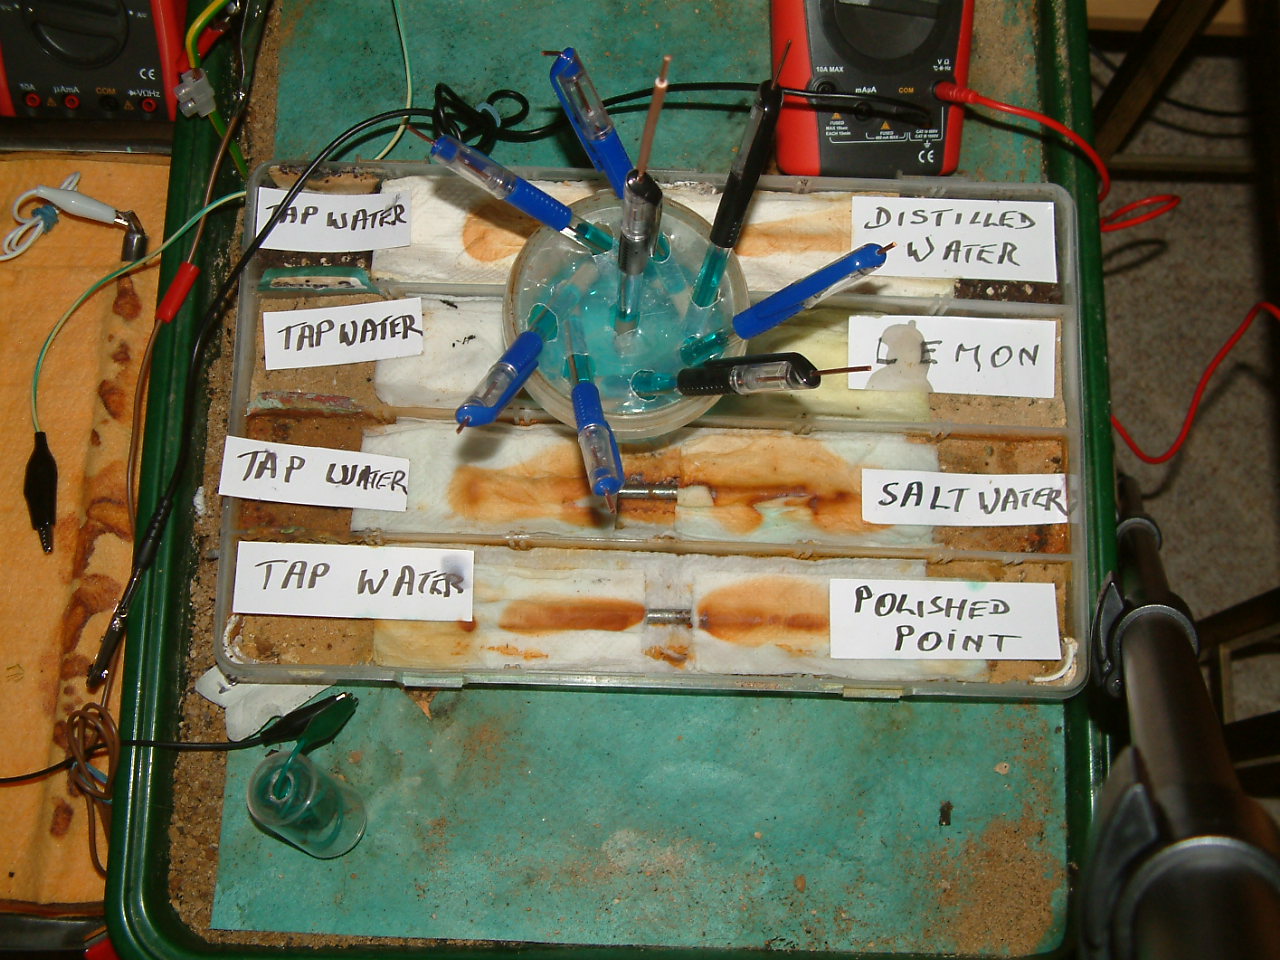
In the pictures that follow the Luggin probes are used to contact the electrolyte instead of the probe nails. The potential difference between the two contact points in the electrolyte is 0.0517v. The common of the meter being zero and connected to the Luggin capillary on the left hand side of the picture, there are more charges on the right hand point of contact thus giving a + positive display.
luggin1
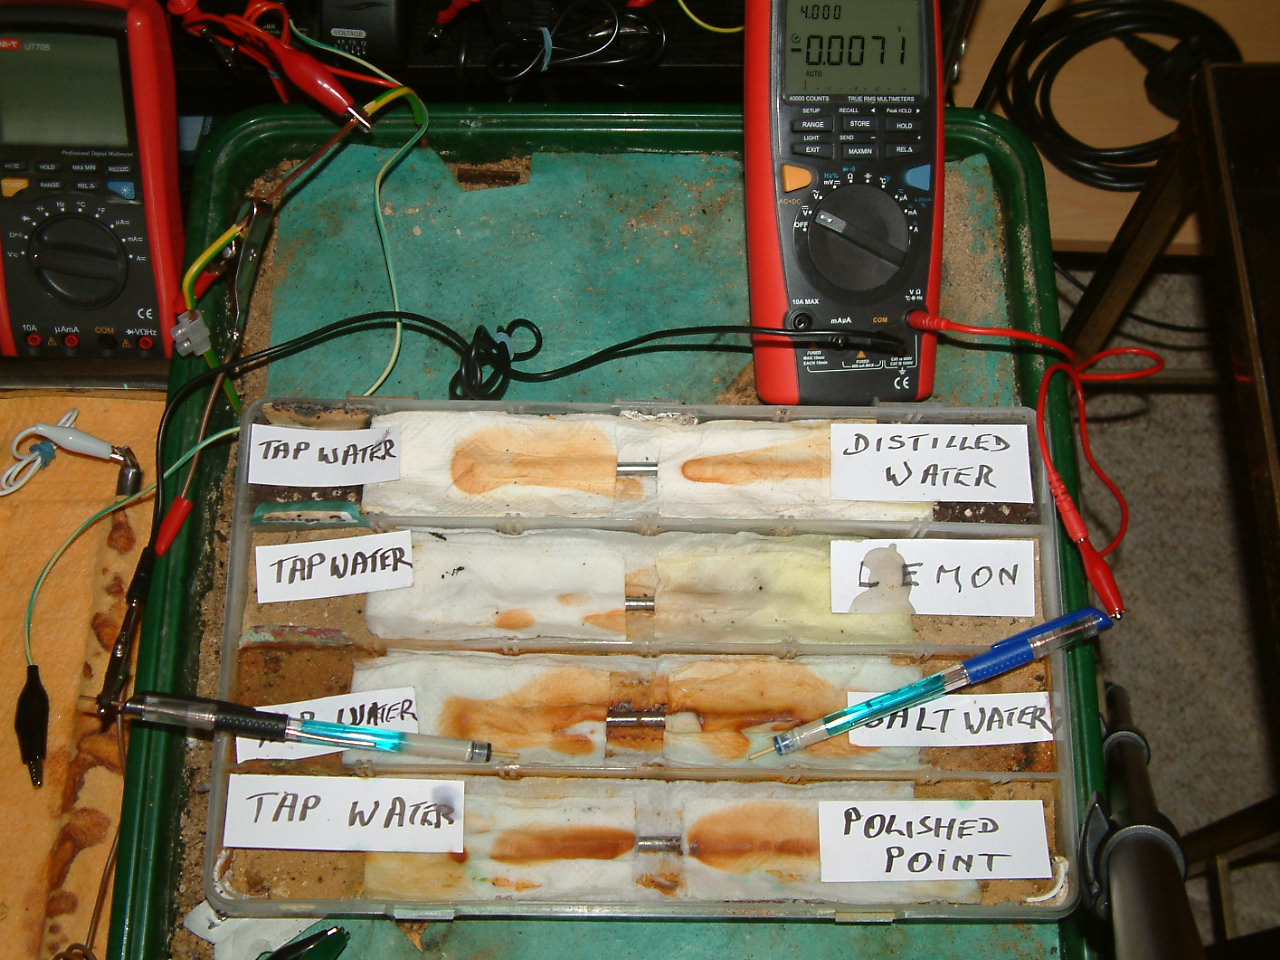
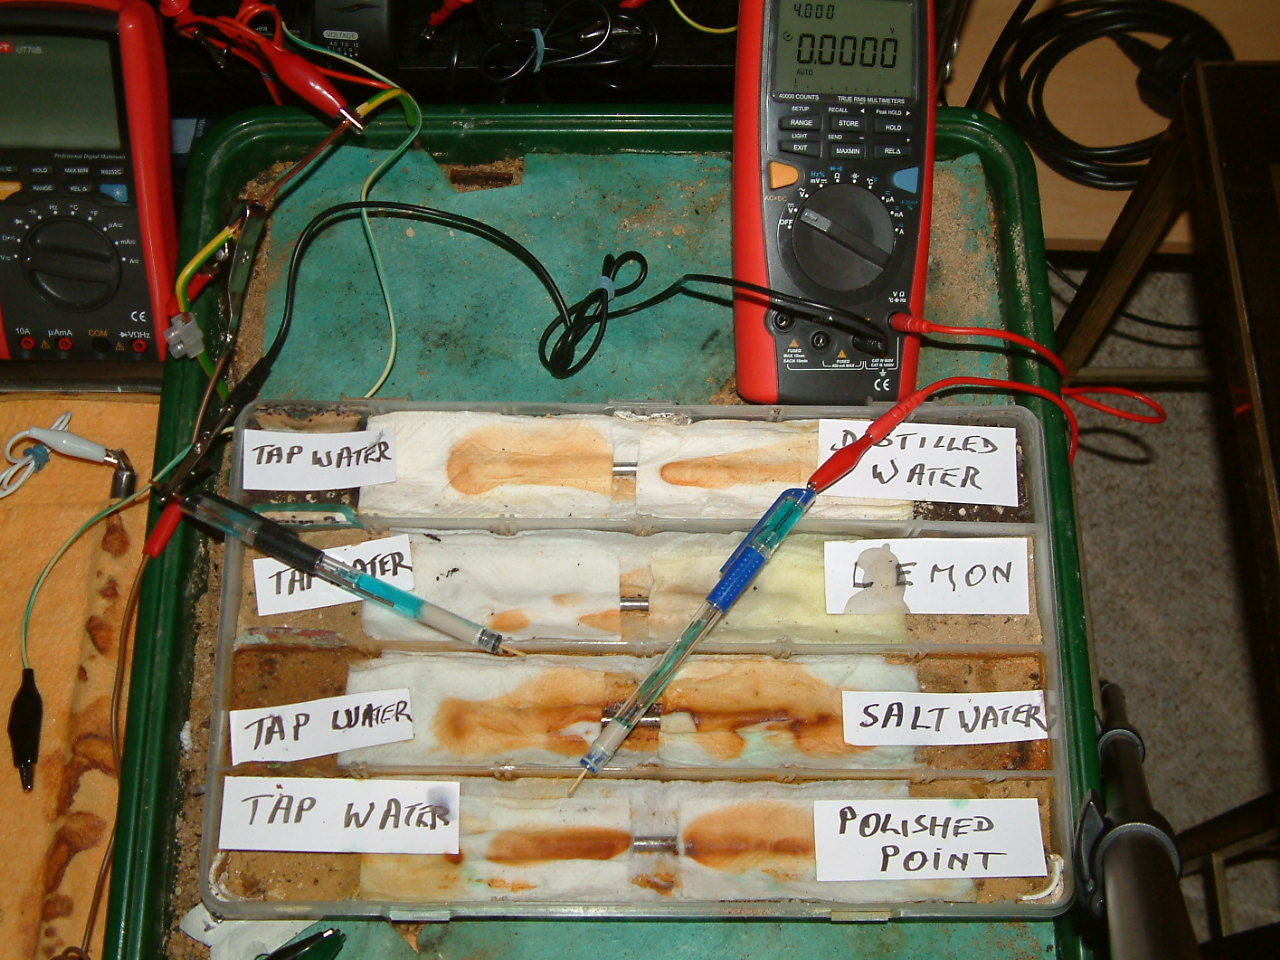
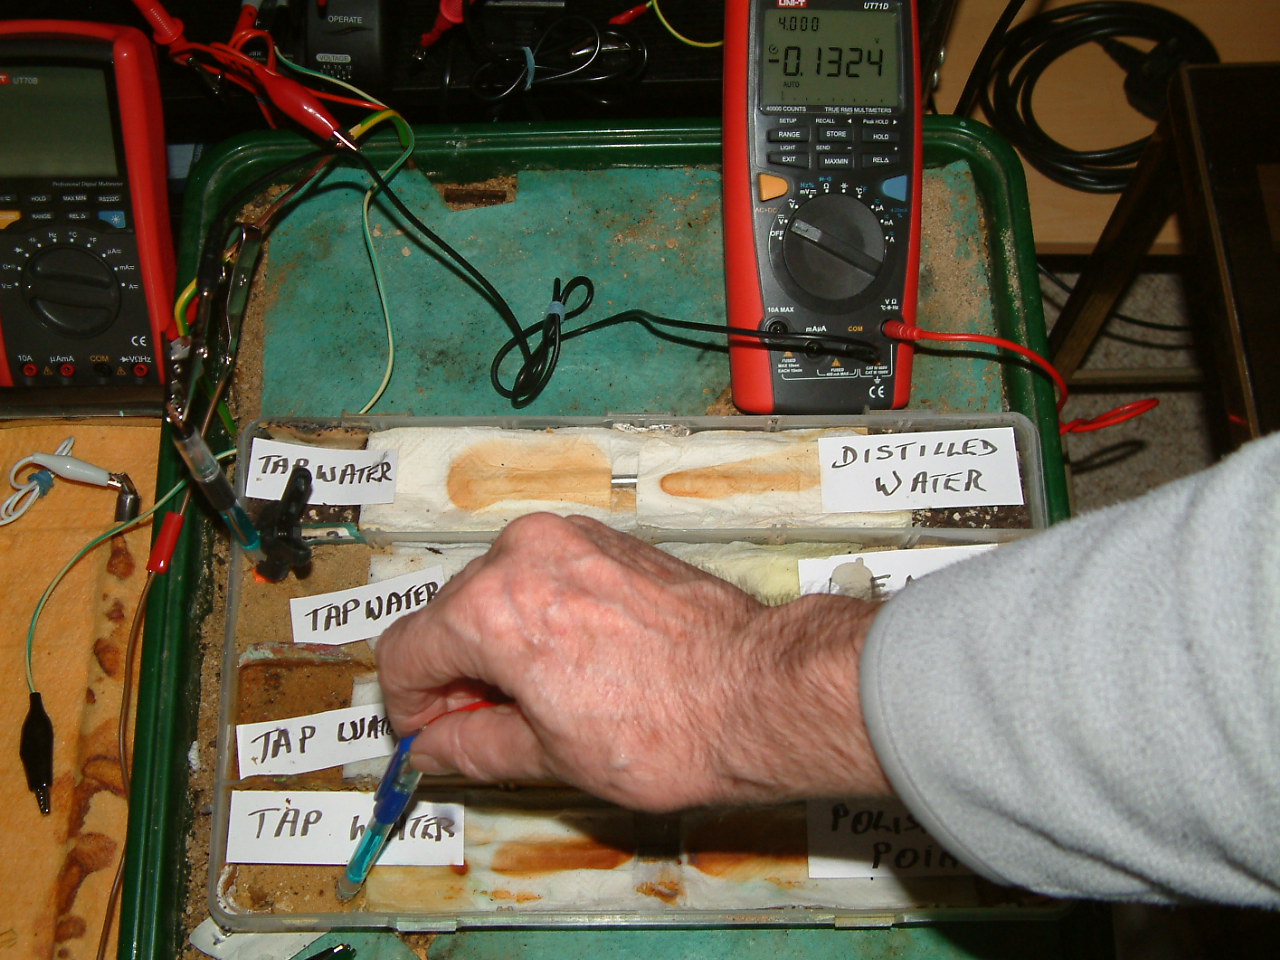
In the picture below the probes are moved to the second partition and the voltage is shown as -0.0071v
luggin2
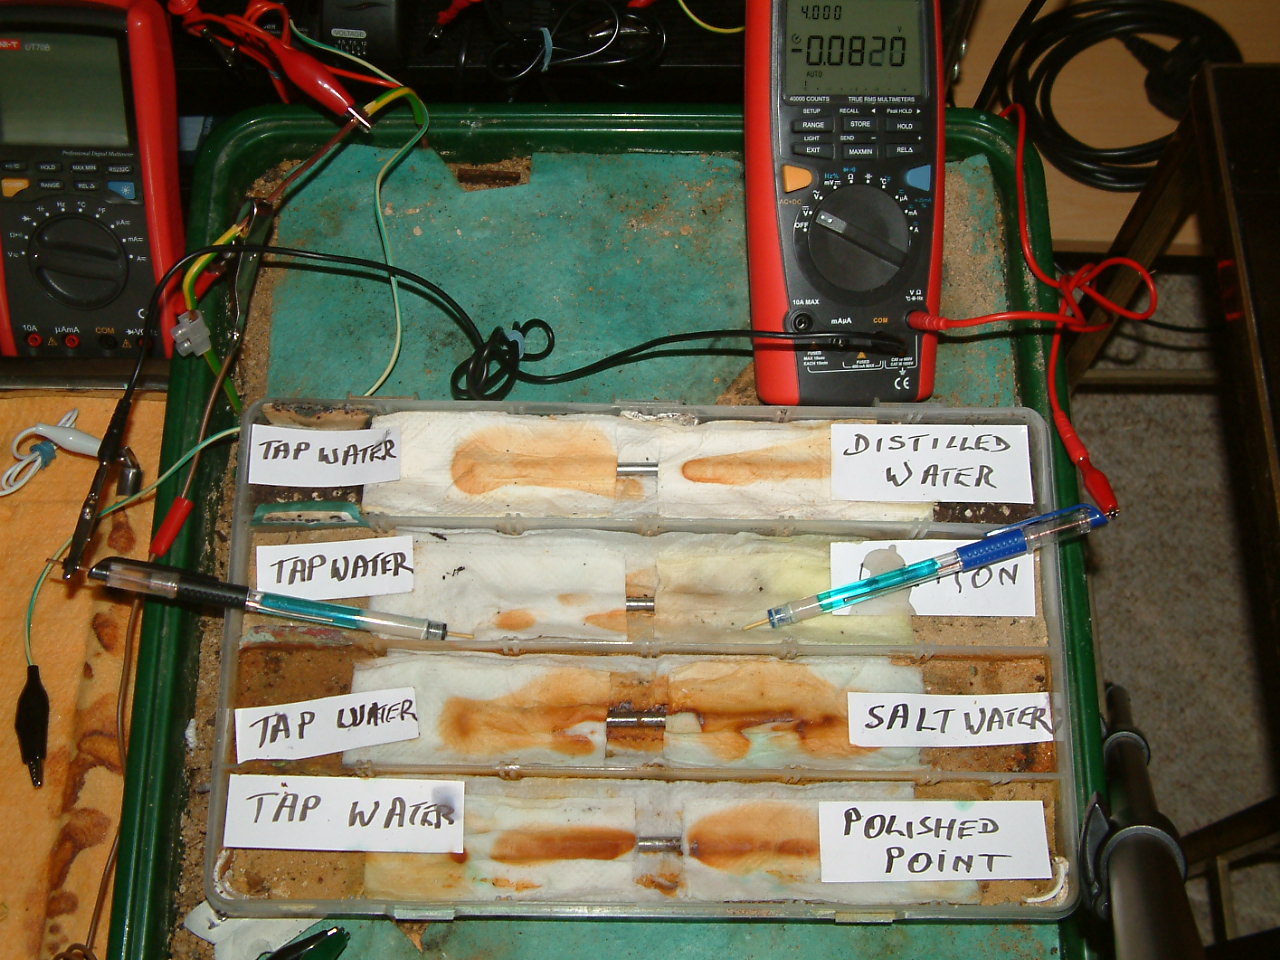
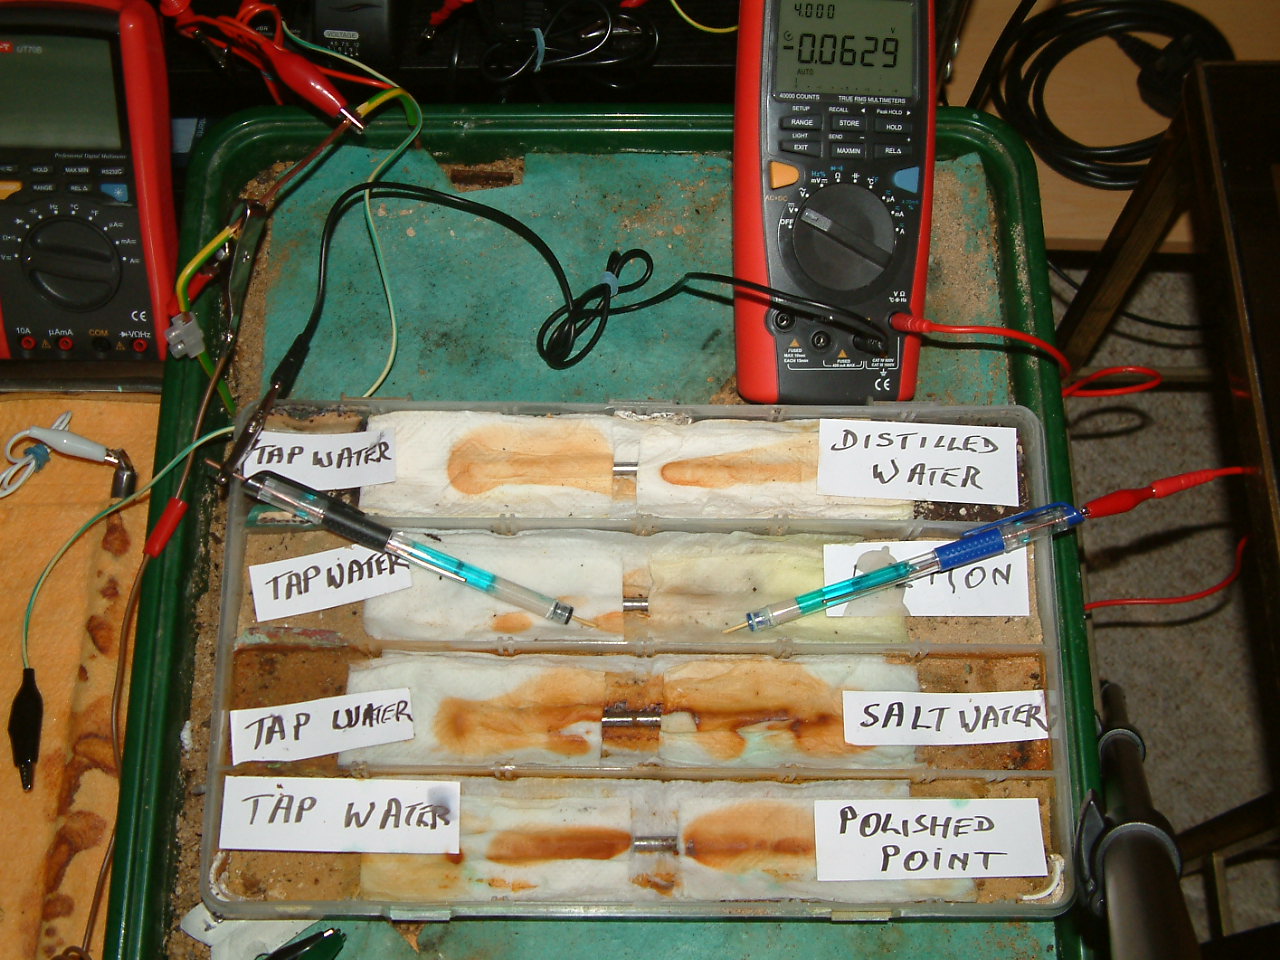
The probes are then moved to the third partition and the voltage shows -0.0820 v
luggin3
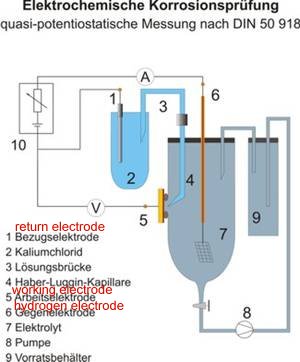
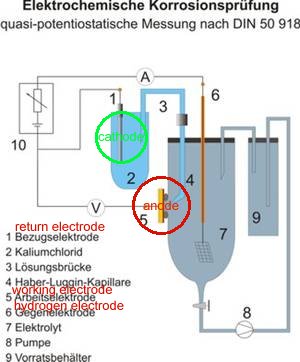
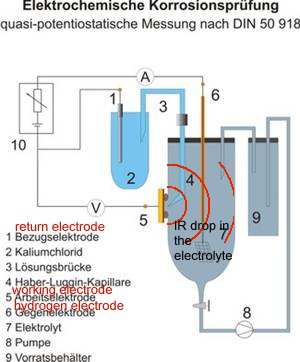
It should be noted, at this stage, that the probes are in the 'IR drop' of single corrosion cells between the anode and cathode of each. This feature is explained in the diagram accompanying DIN 50918
din50918
din50918a
din50918b
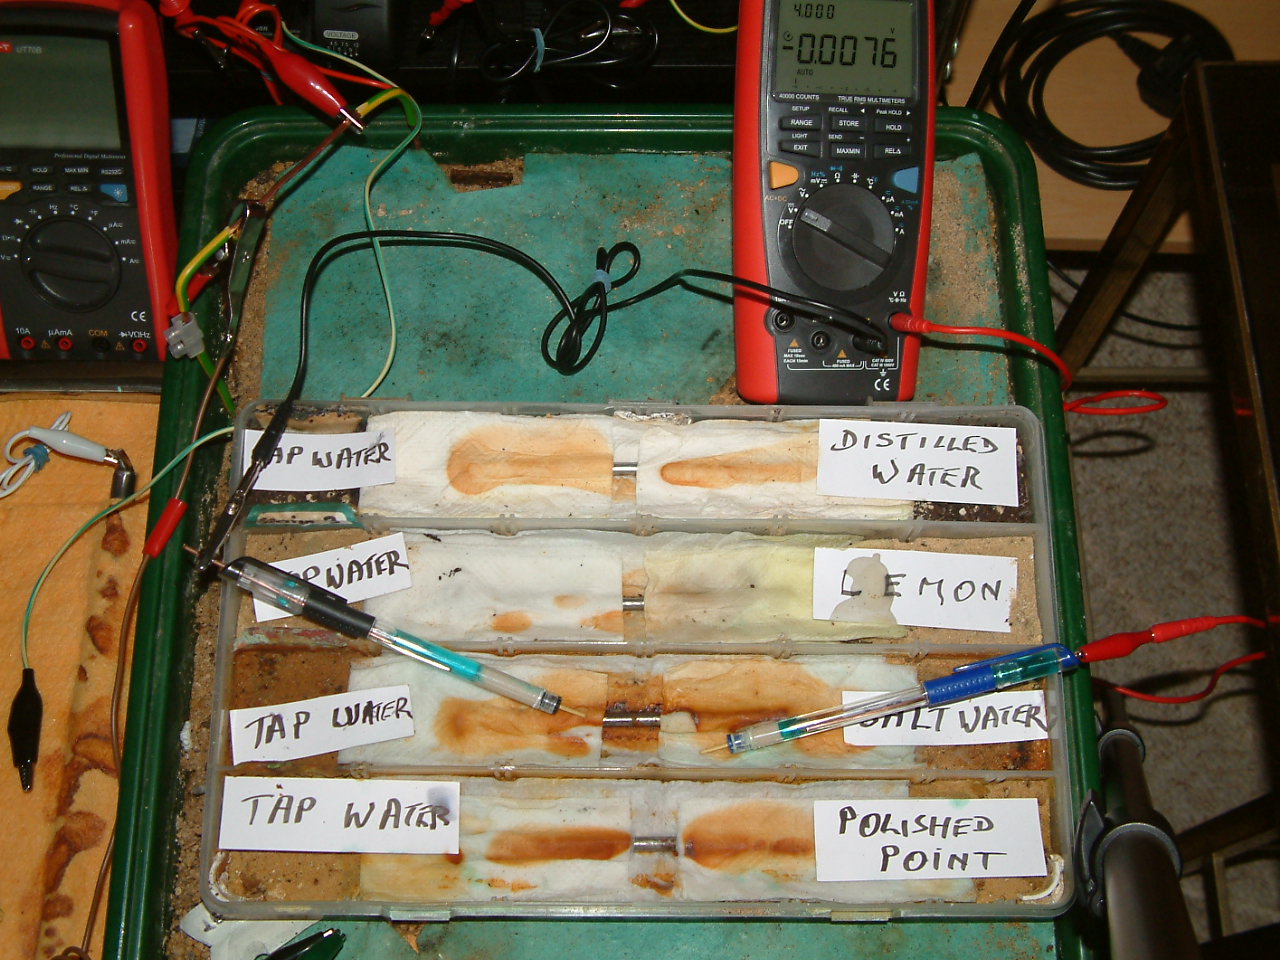
luggin4
The value displayed on the meter is the difference in the potential zones of the electrolyte in each insulated container. These zones are caused by diffusion in a similar way to the inverse square law of radiation (but not straight line directional).
luggin5
It can be seen that the exact position of each probe is crucial to each measurement.
luggen6
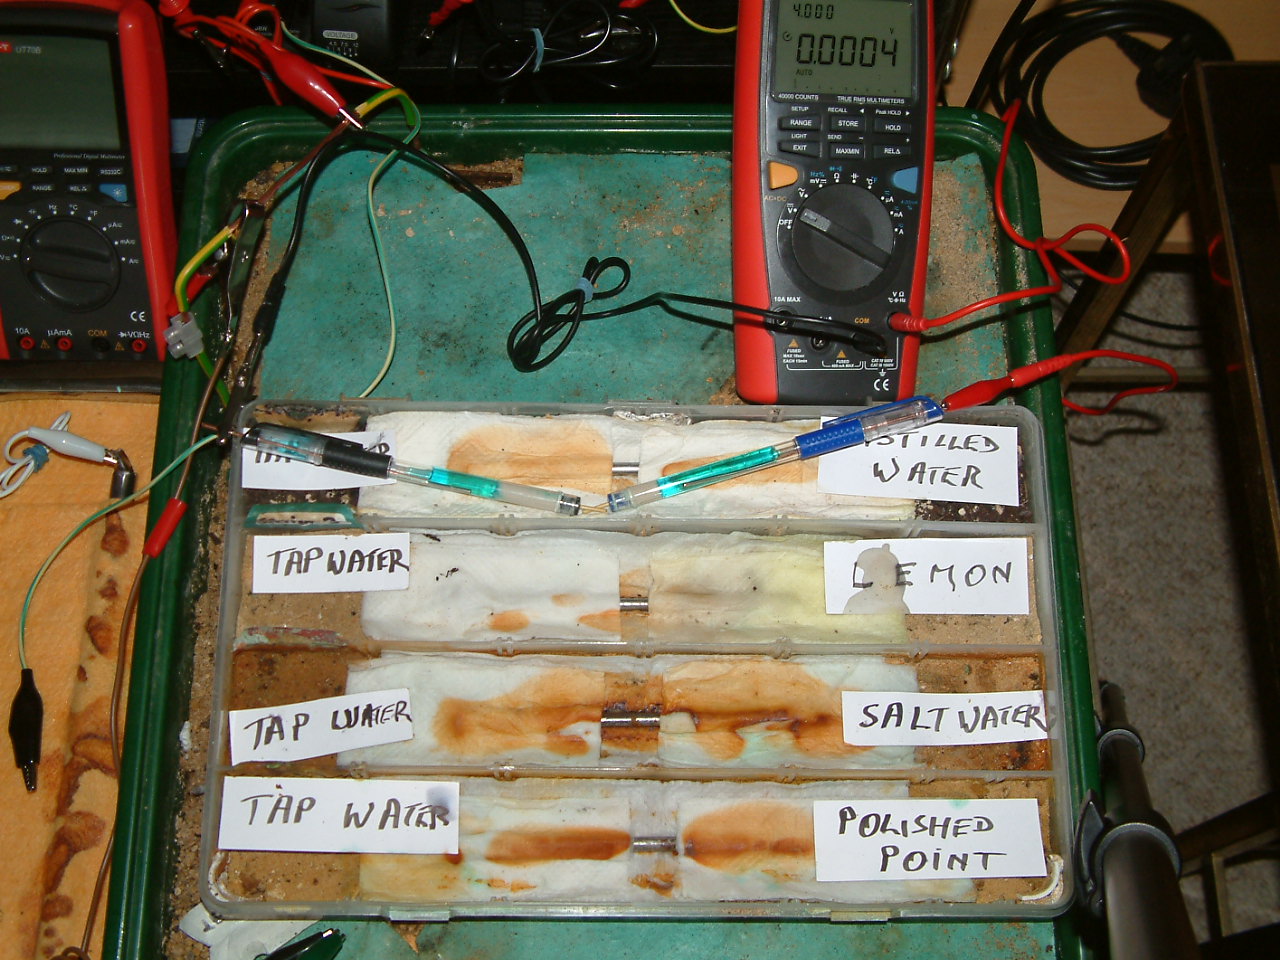
It can be seen that the two probes have almost the same potential when the tips are held together and produce 0.0001 volts to 0.0004 volts
luggin6
As the probes are moved apart they are each touching a different potential zone.
luggin7
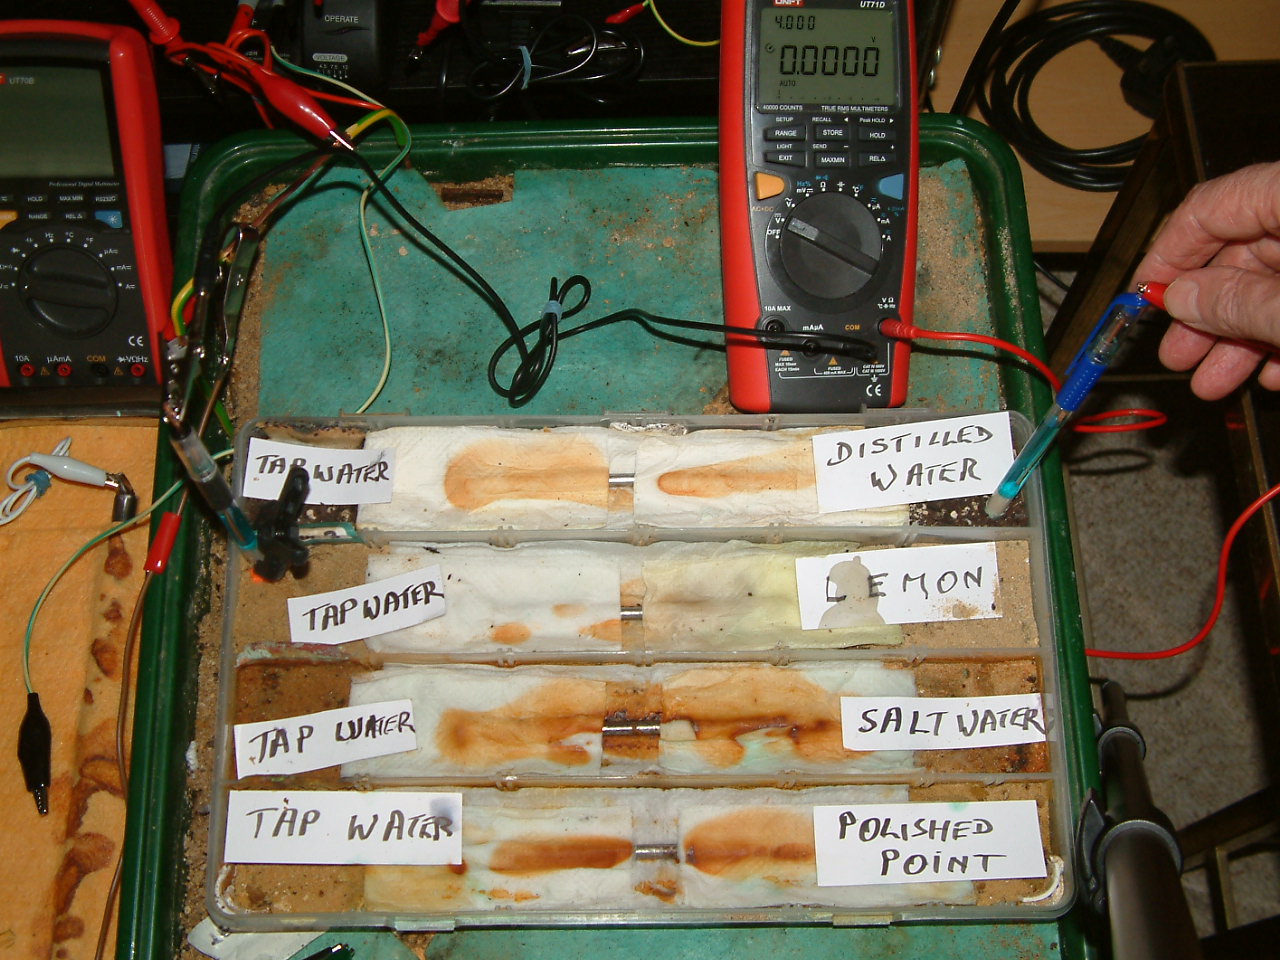
When the probes are separated by air there is too much resistance to complete the measuring circuit and a voltage of zero shows on the display.
luggin8
As you can see, there is no way to calculate the voltage between the probes when they are moved within the electrolyte and that is why the IR drop is a problem that the scientists must overcome when setting up their experiments,
However, we use this to our advantage when we practice DCVG and plot the ground potentials to indicate the flow of electrical charges from cathodic protection anode to the coating faults or bare metal on pipelines and structures.
luggin9
When the probes are touching low resistance electrolyte (or ground) there is less voltage between them.
luggin10
luggin11
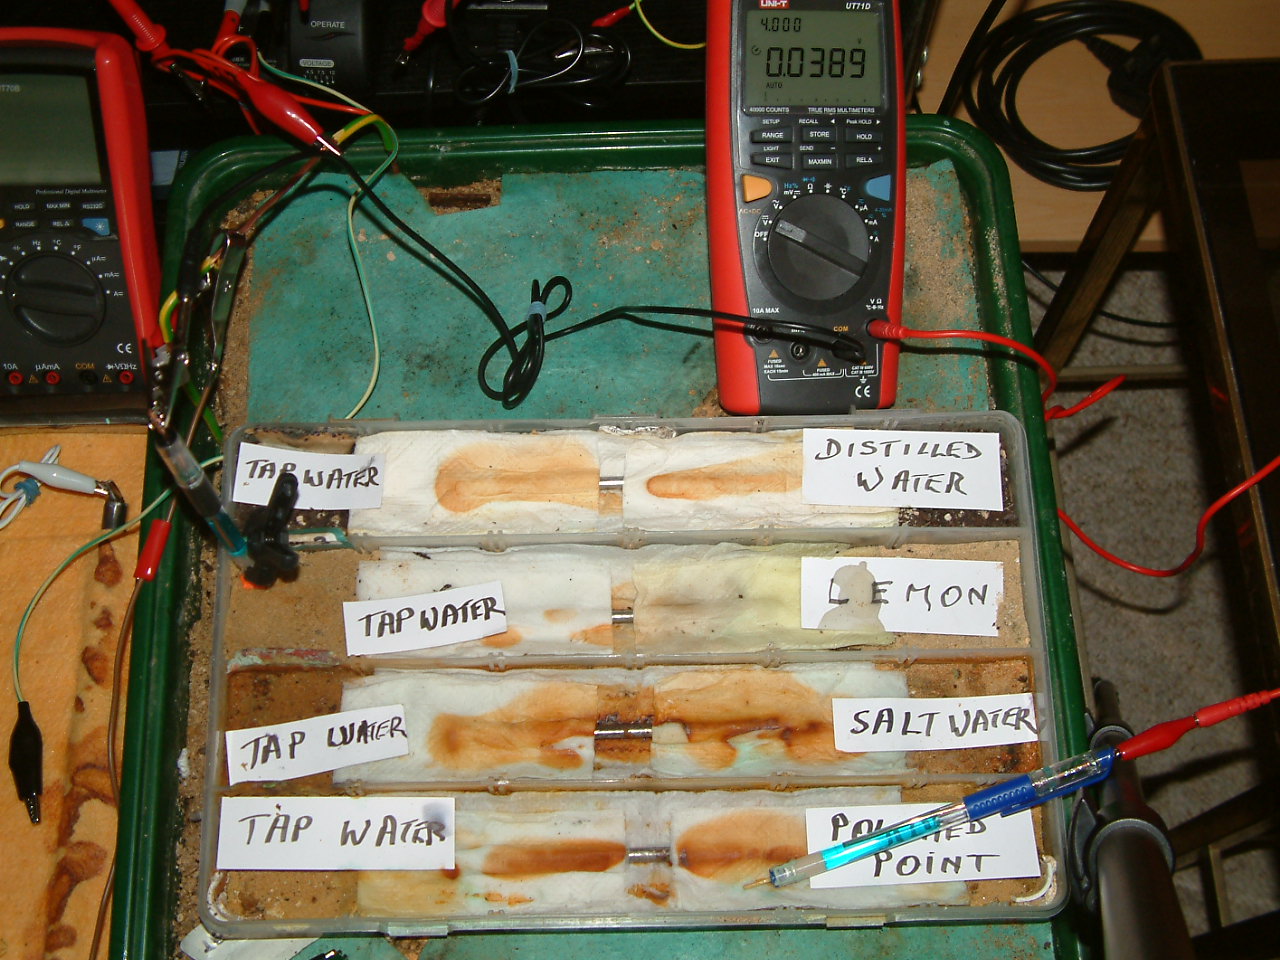
The probe connected to the 'Common' of the meter has now been fixed in partition three as a fixed reference and the meter sees this as zero.
lugin12
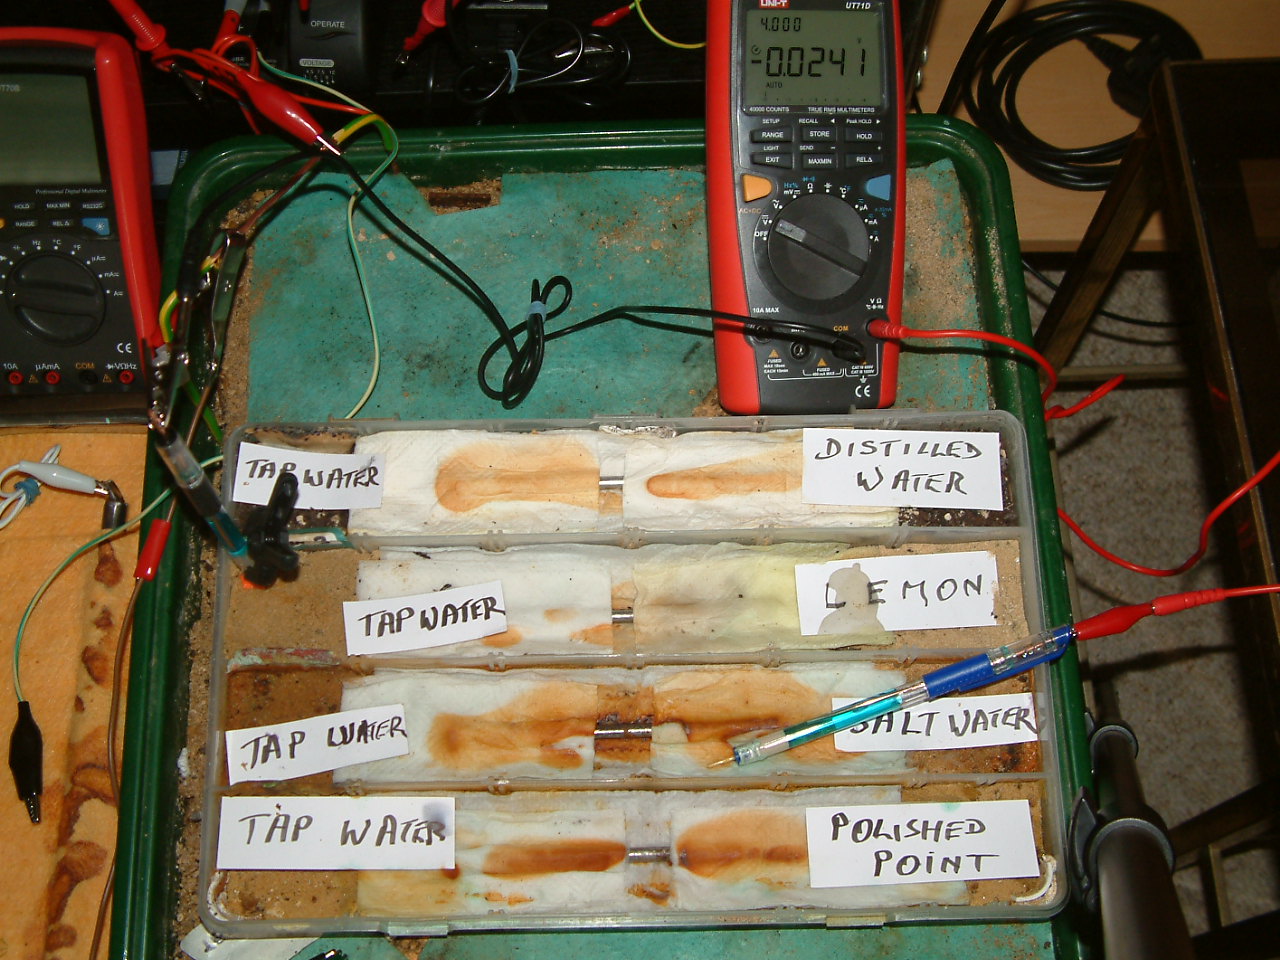
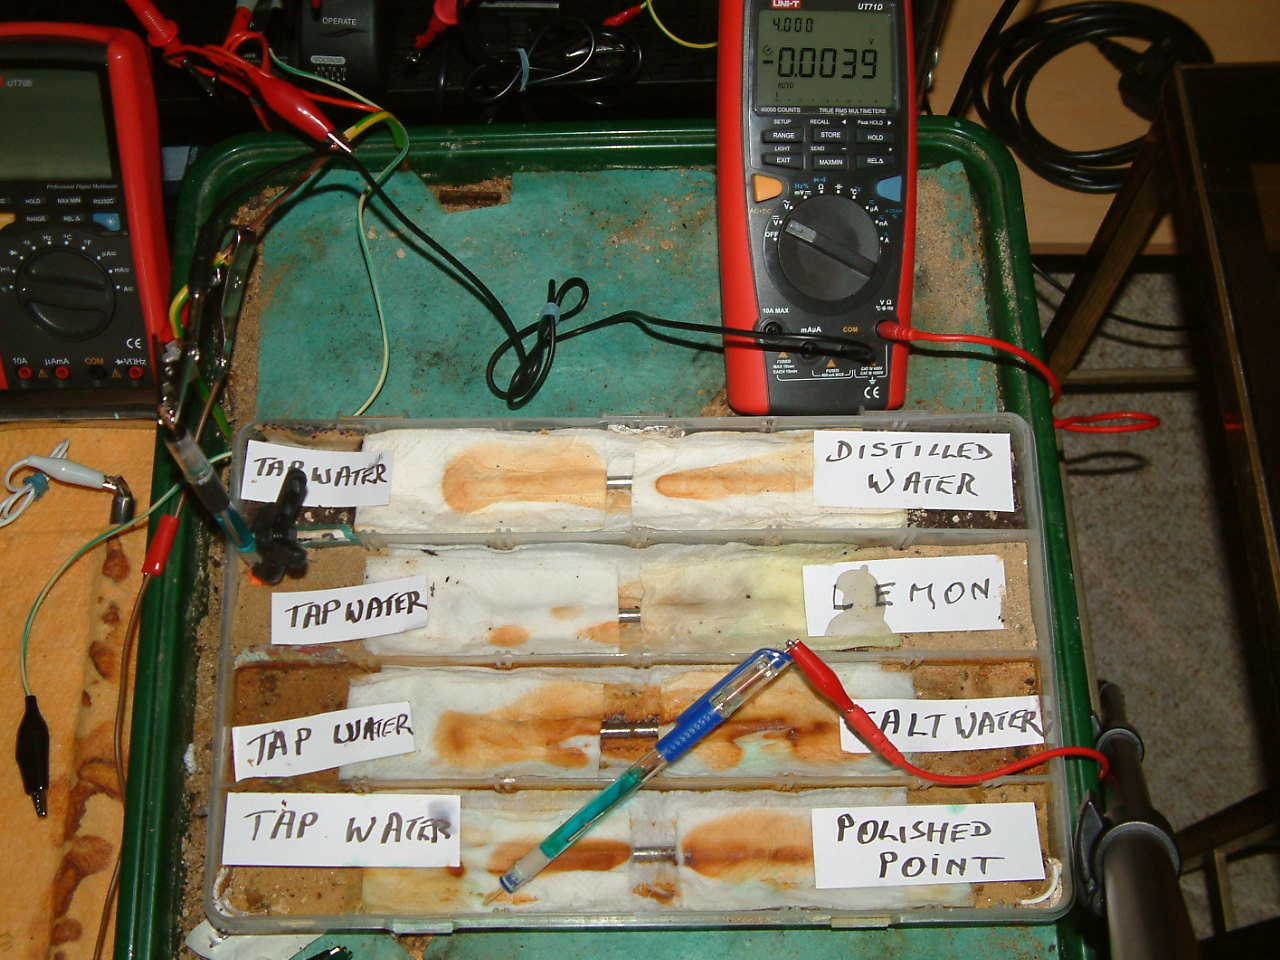
It can be seen that the movement of the 'roving probe' from partition one to partition two has reversed the polarity of the display from 0.0389 to -0.0241.
20
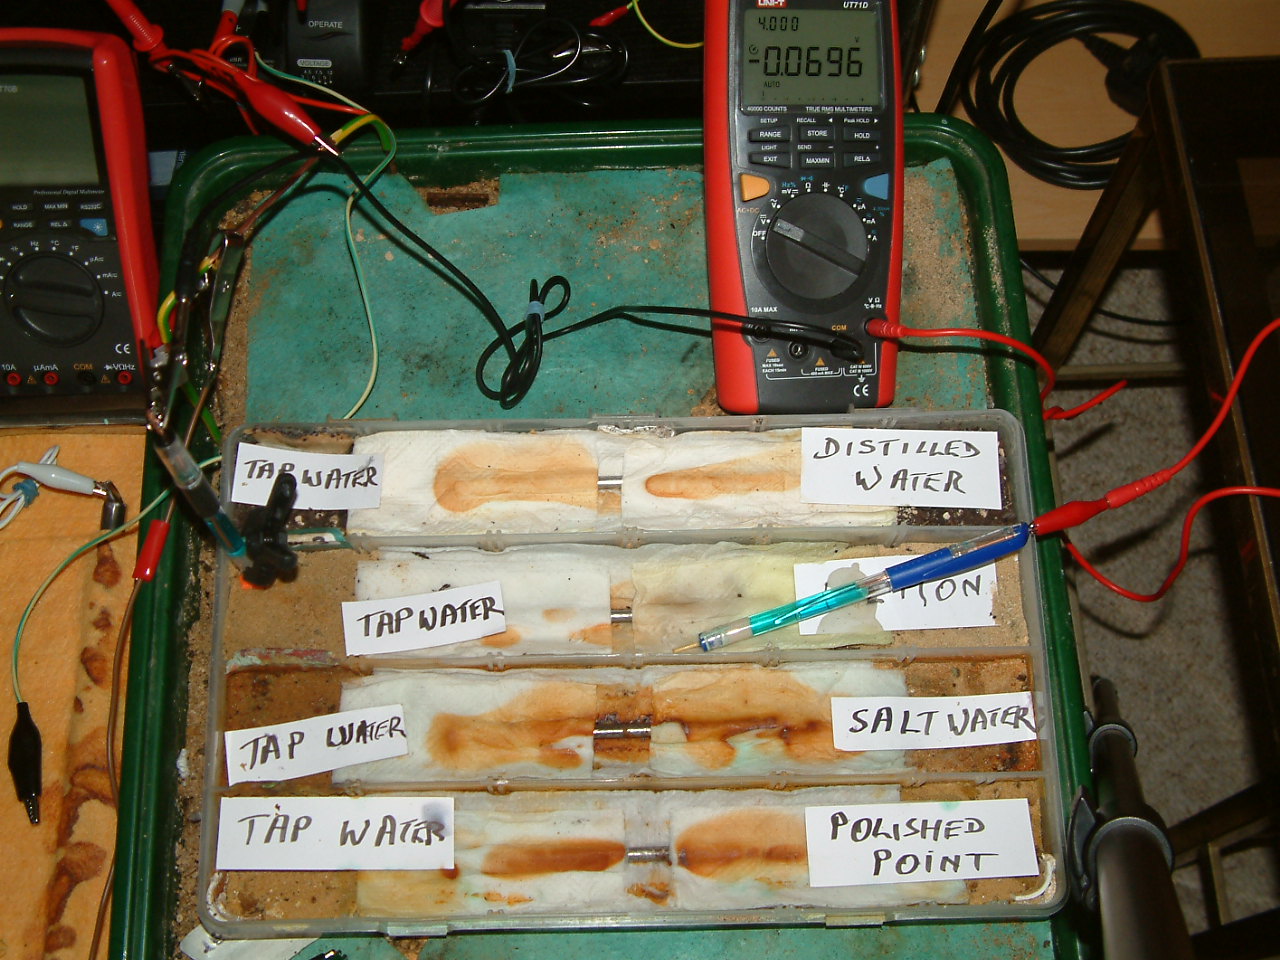
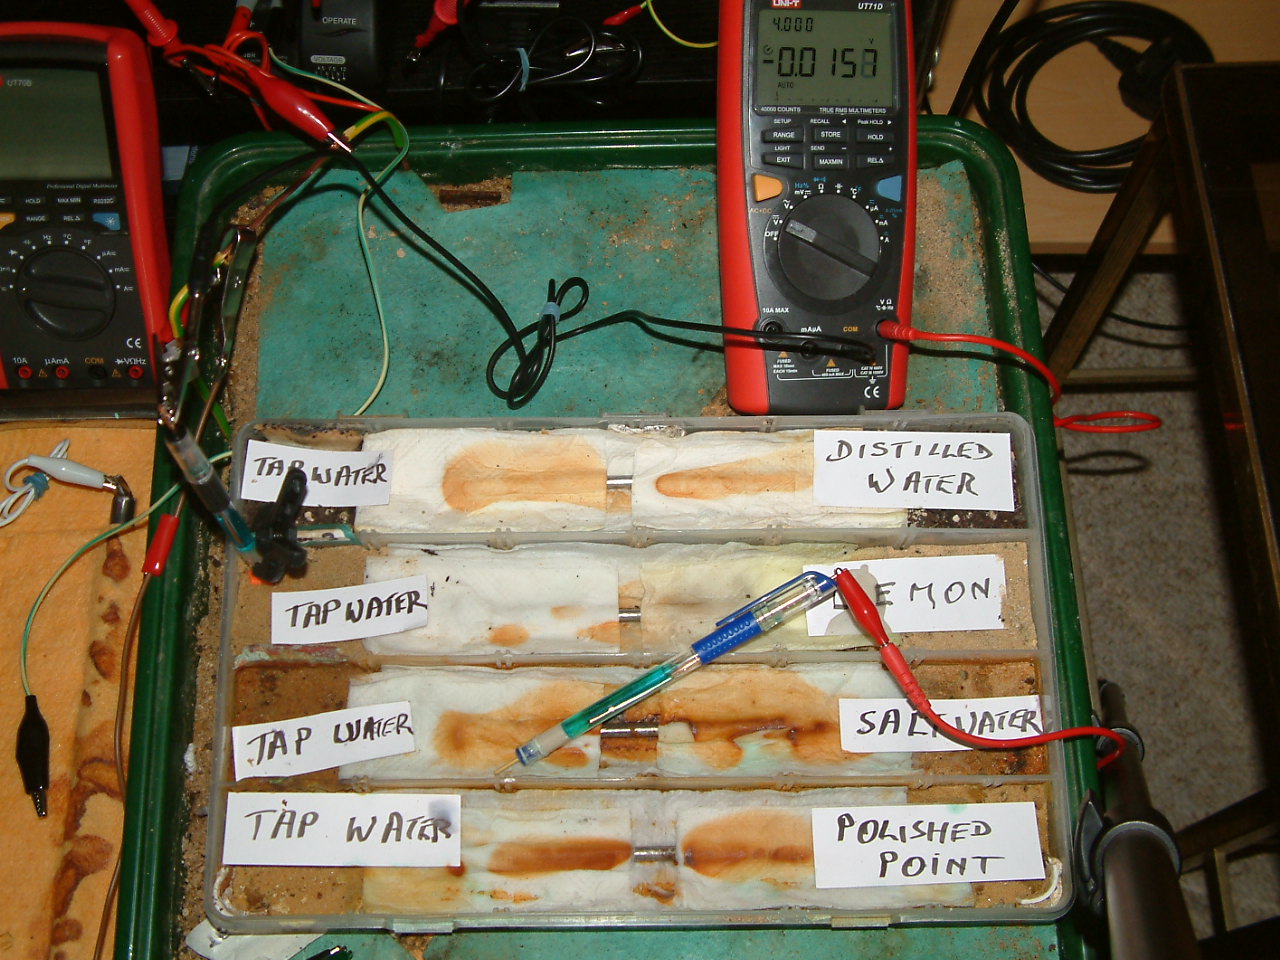
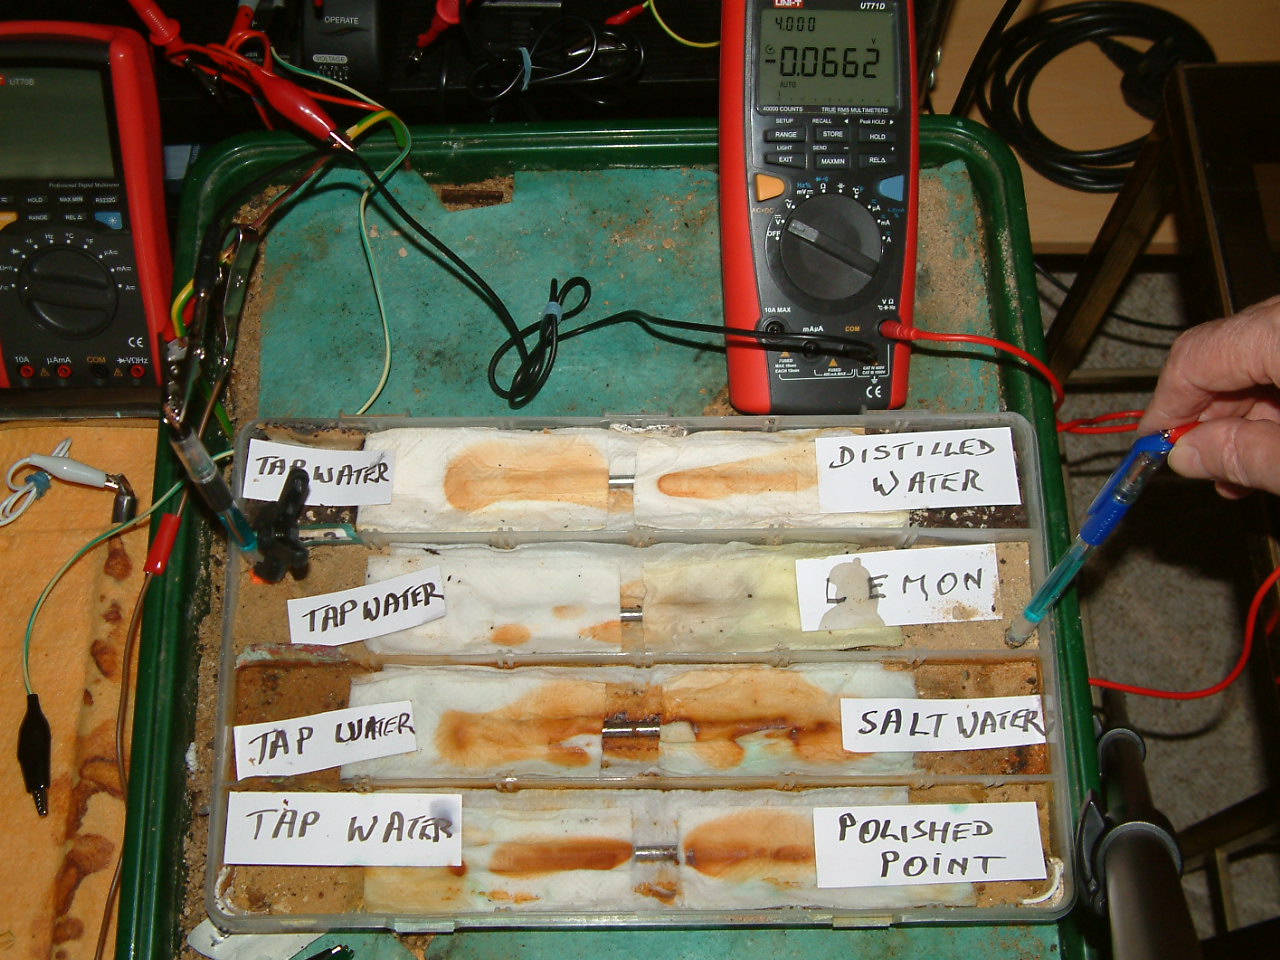
It can be seen that the movement of the 'roving probe' from partition two to partition three has increased the voltage from -0.0241 to -0.0696
21
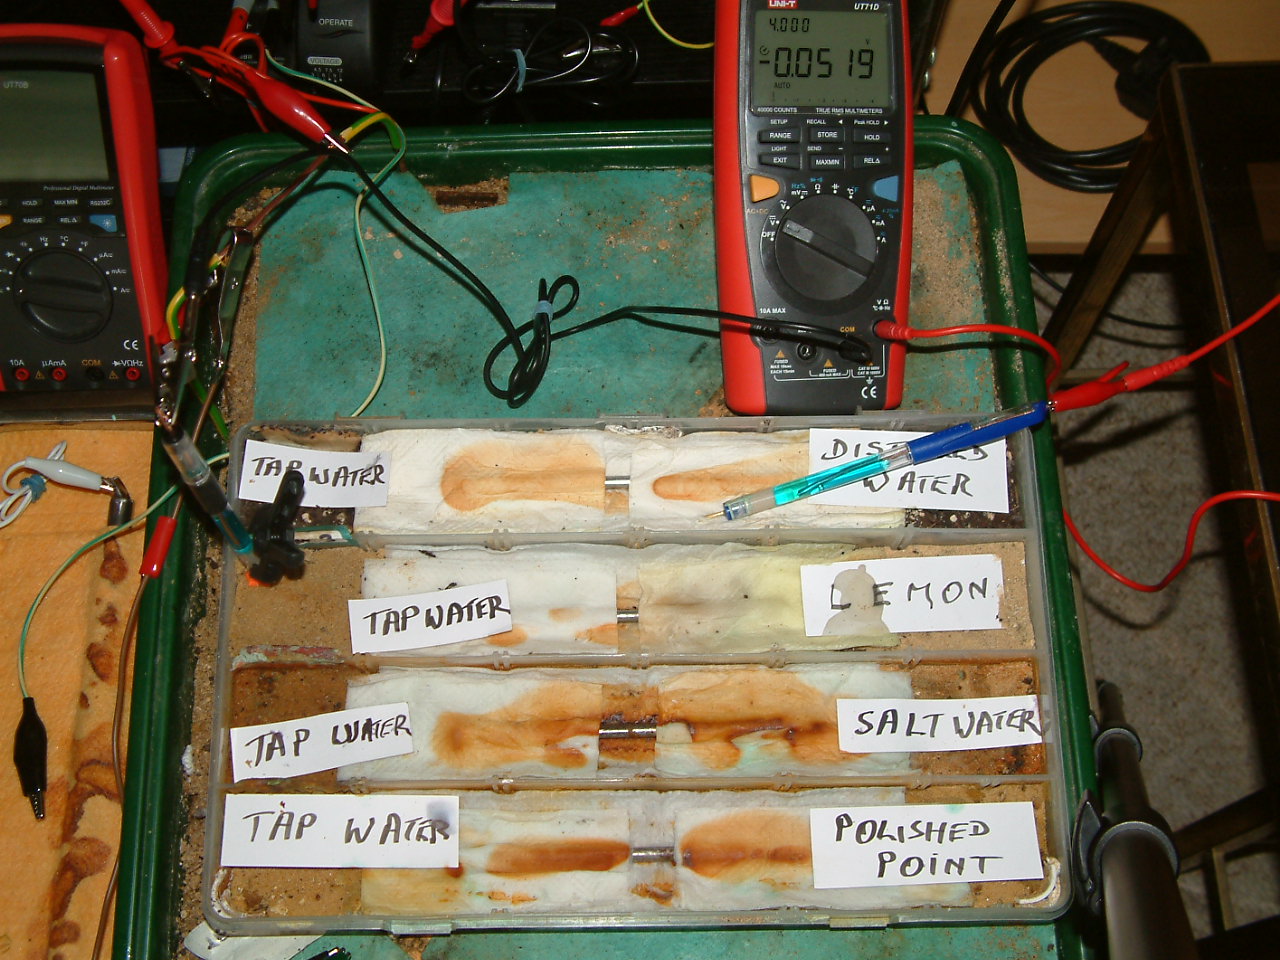
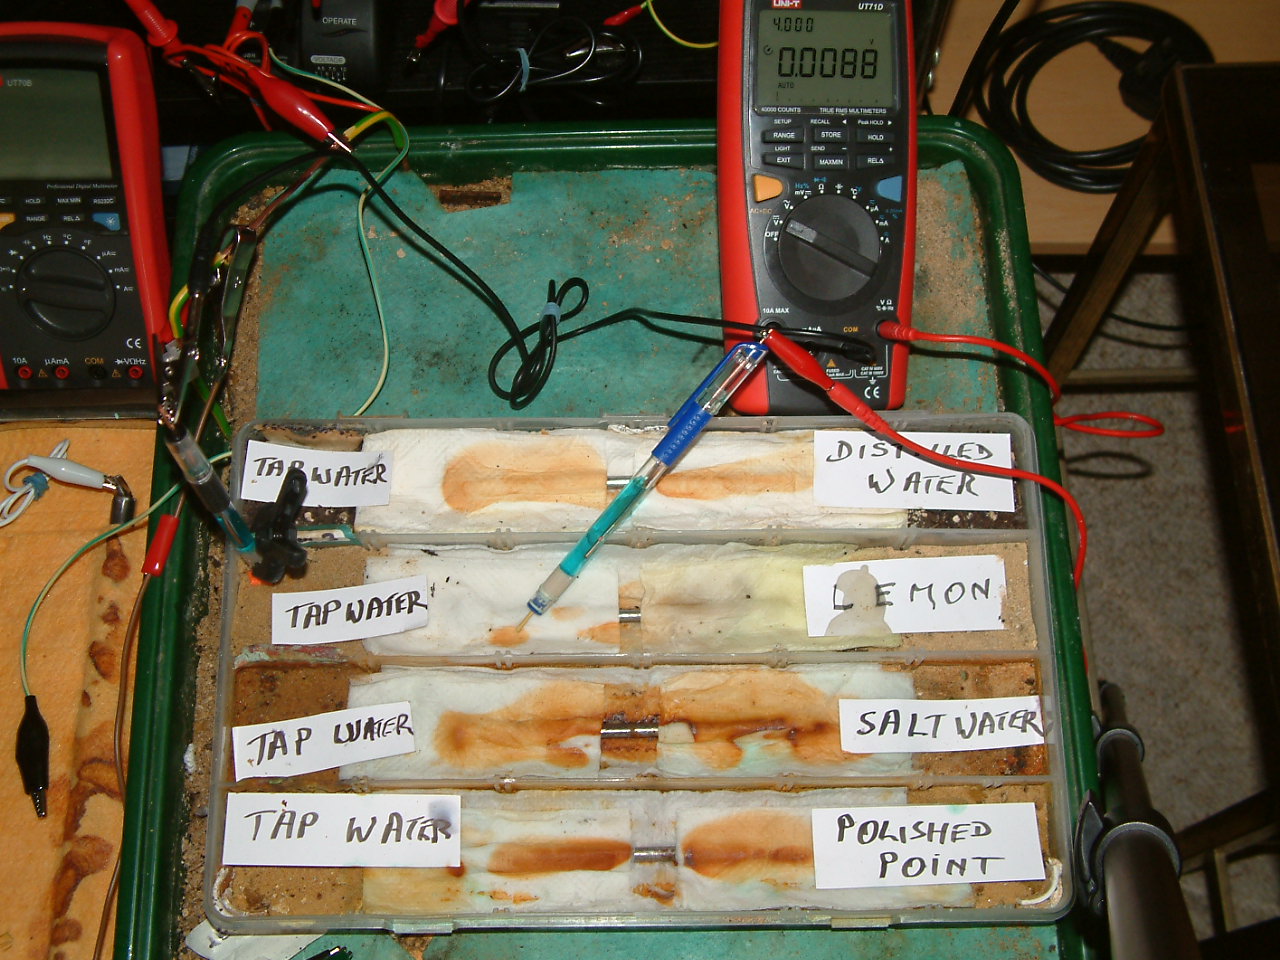
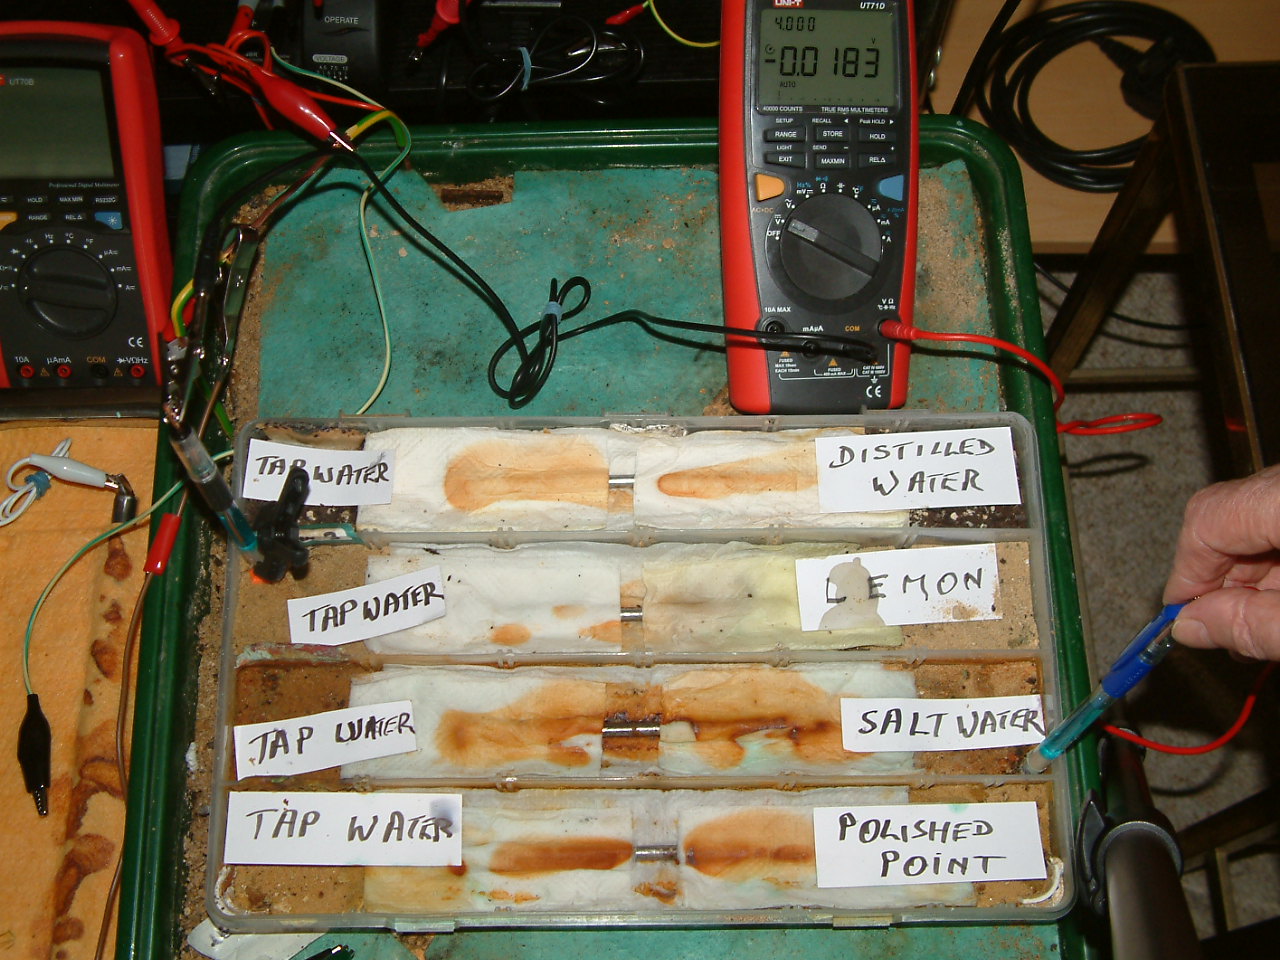
Moving the probe to the position seen in the picture below results in the display of -0.0519 volts
22
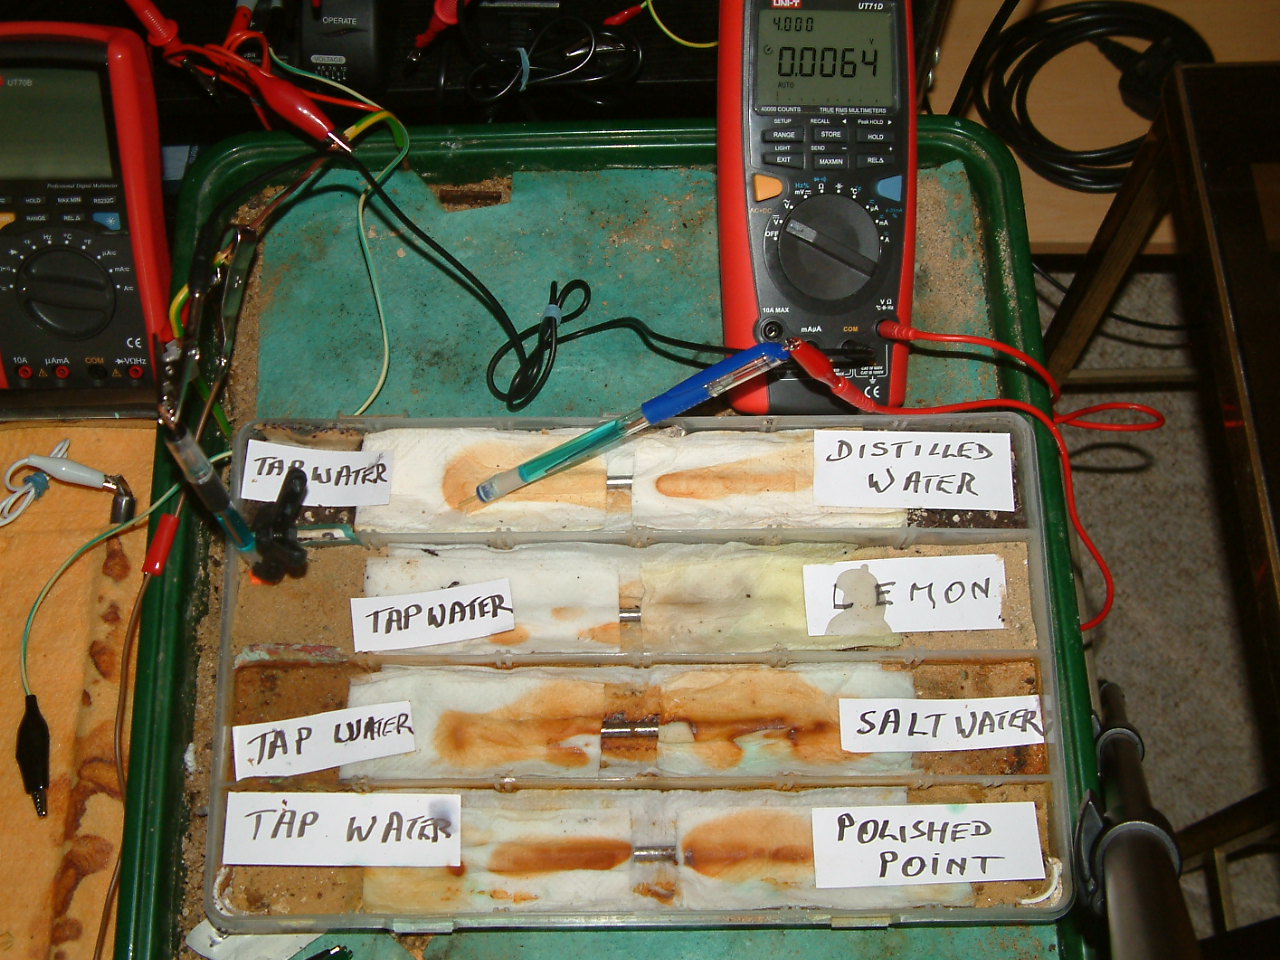
in the picture below you can see that the two probes are closer together but in a different partition of the test tray. The voltage has changed polarity and is now 0.0064 volts. The position in which the probe is now placed has more charges than it's last position and has a potential 0.0064 v more than the position of the fixed probe.
23
Using the fixed probe as zero for all readings it is possible to plot the complete potential profile of an area in the test tray and in field work.
24
The voltages can be plotted in a grid formation and then produce a 3D graphic that helps to identify the electrical pressures that cause current to flow.from the high potentials to the lower potentials in the ground.
25
This is the principle on which I originated DCVG in Nigeria in the mid 1970's,
Anyone can make the test tray shown in these pictures and carry out these tests to make their own observations.
26
Tests of this sort demonstrate that we must believe in our meters and forget opinions until we form a picture from the data we gather.
27
28
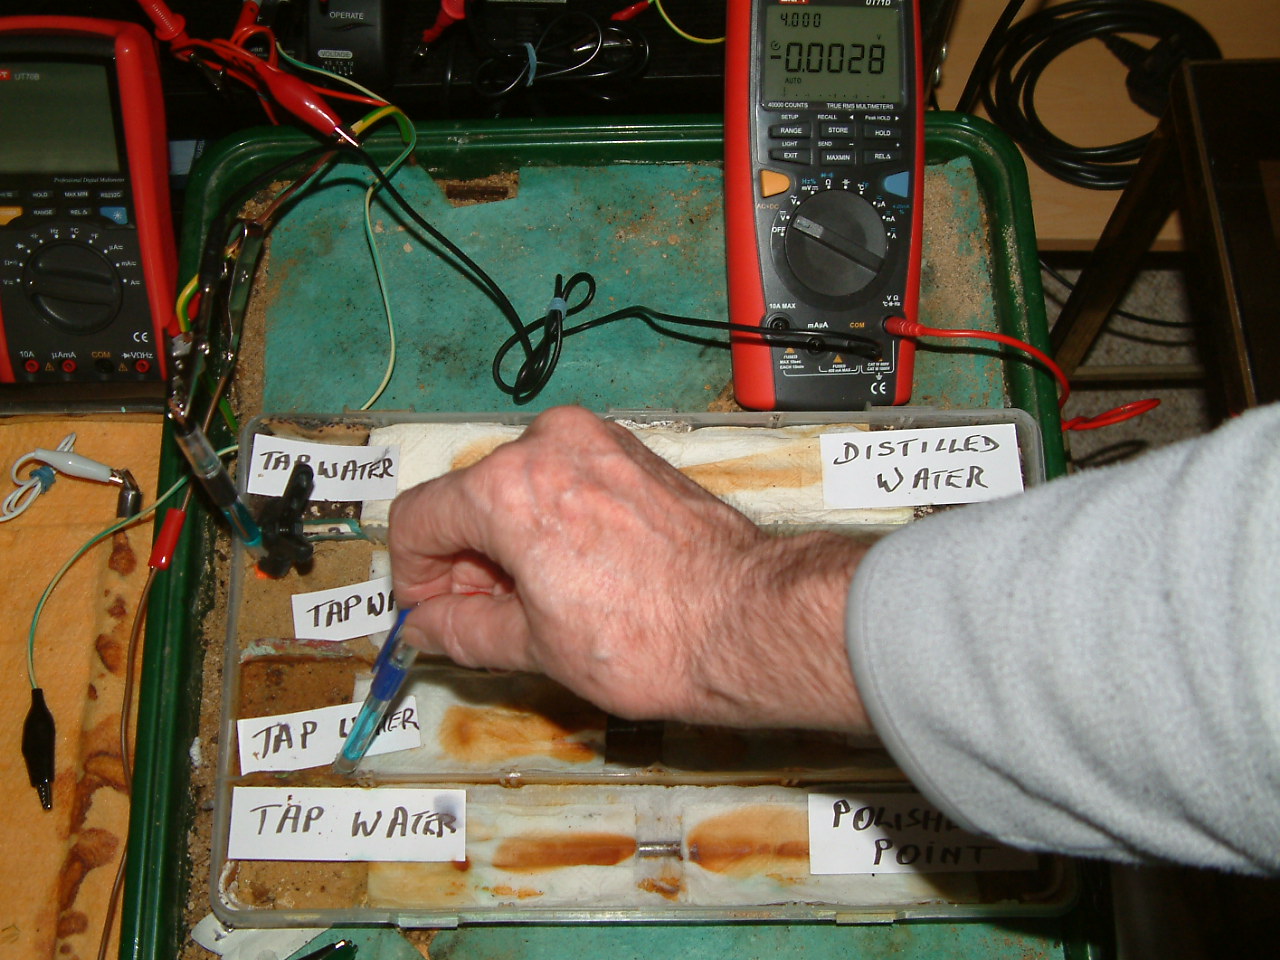
In the picture above we see there is no voltage and this is because the roving probe did not make good enough contact with the electrolyte for the charges to drive the meter.
29
This happens in DCVG and CIPS surveys and the remedy is to water the location where the probe contacts. The water itself does not conduct electricity but the disolved salts provide a greater surface area to the grains of sand and dust. The water is seen to improve the measurements in that enough current passes through the measuring circuit to make the internal resistance of the meter more accurate.
30
31
32
33
35
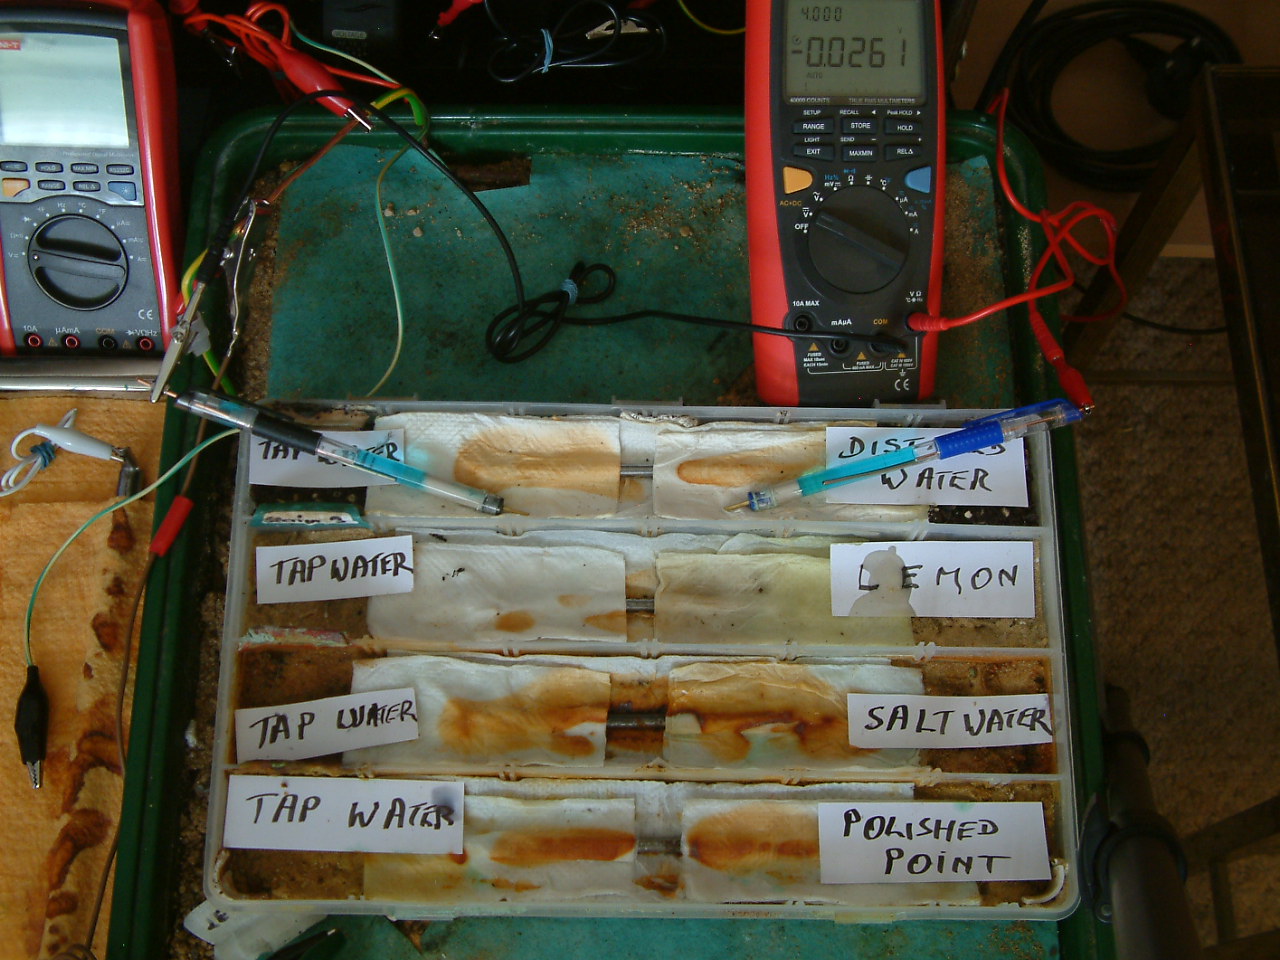
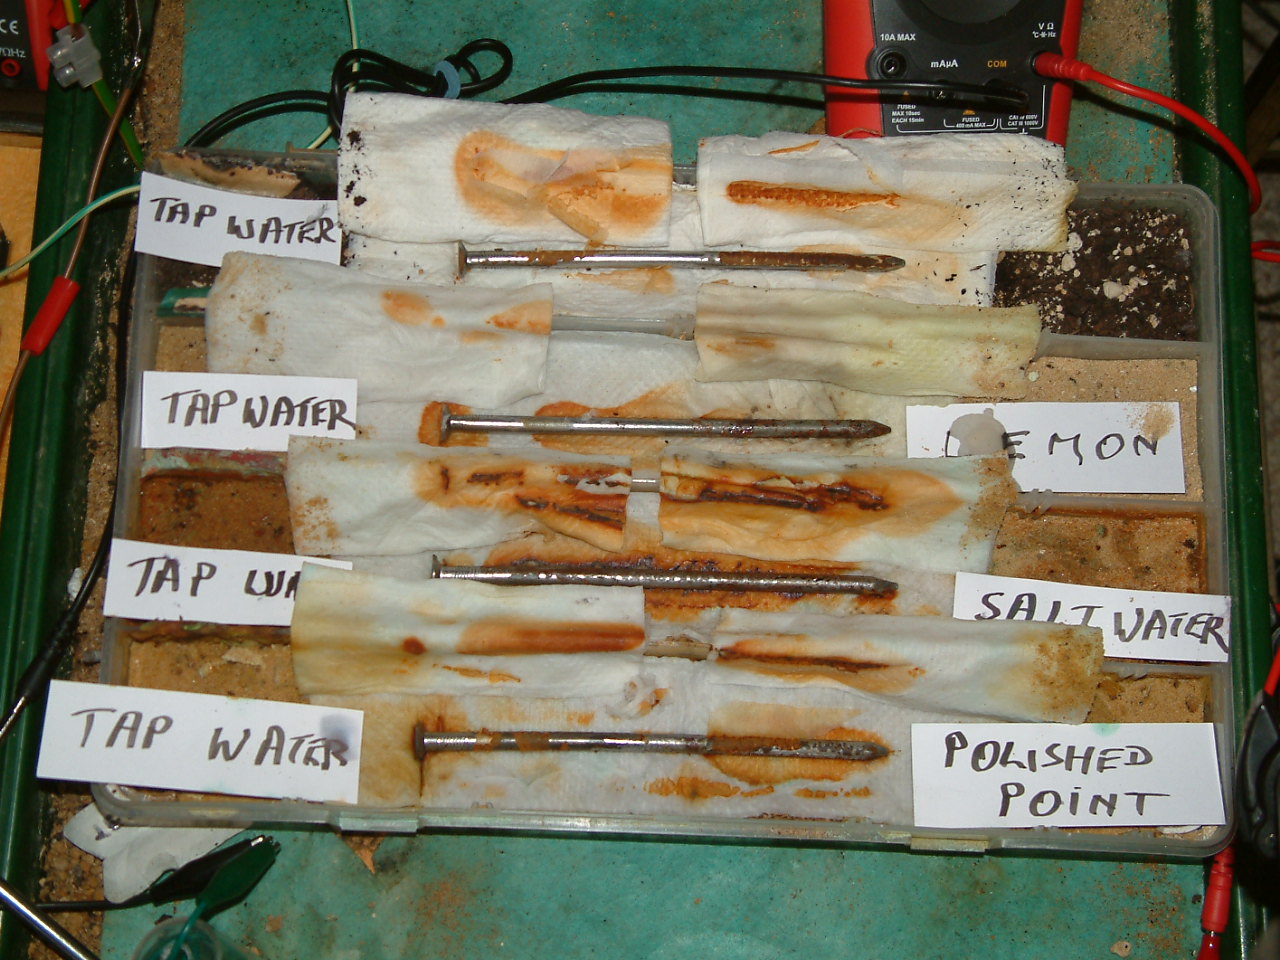
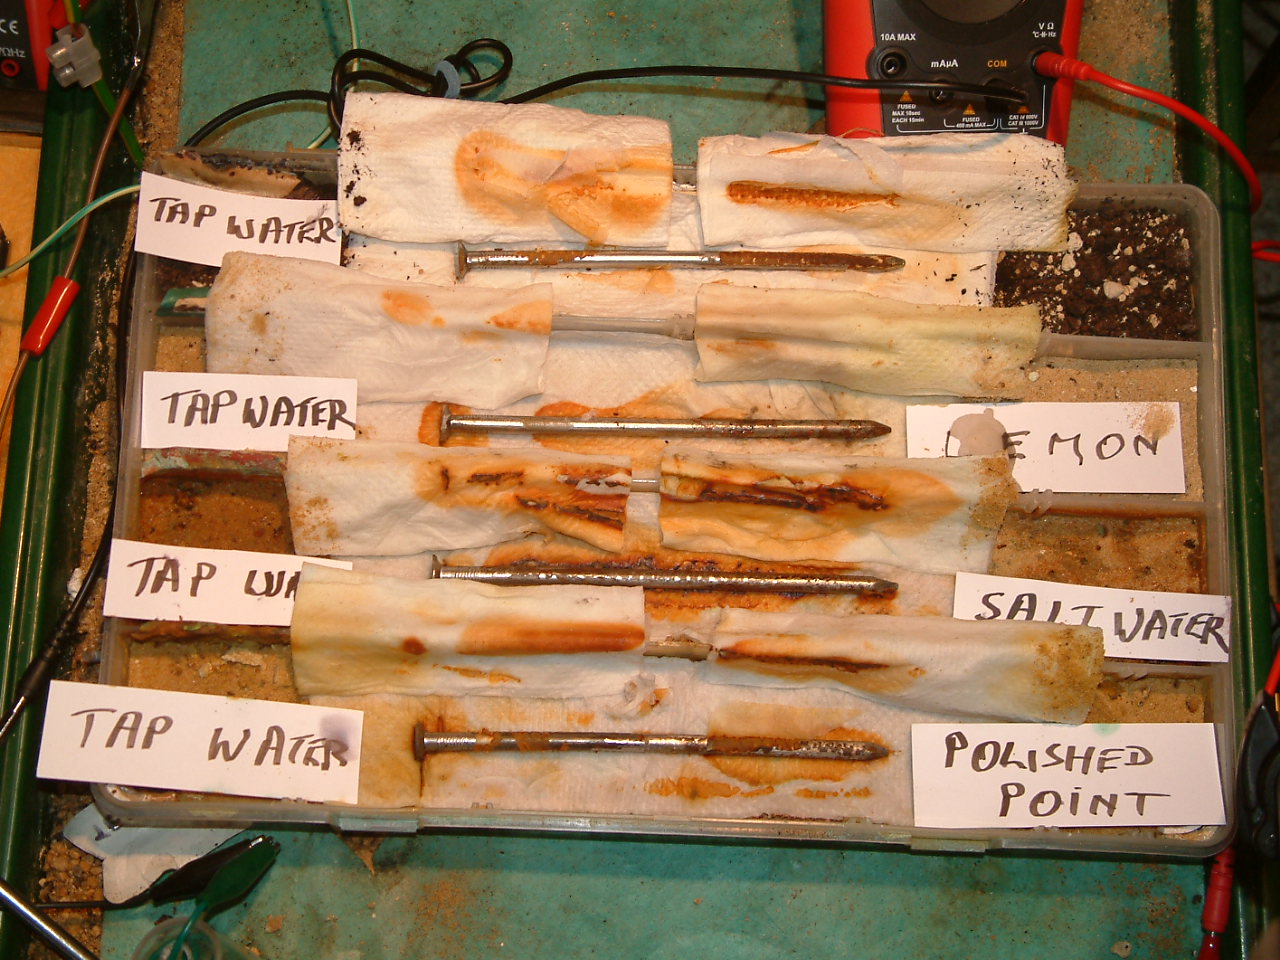
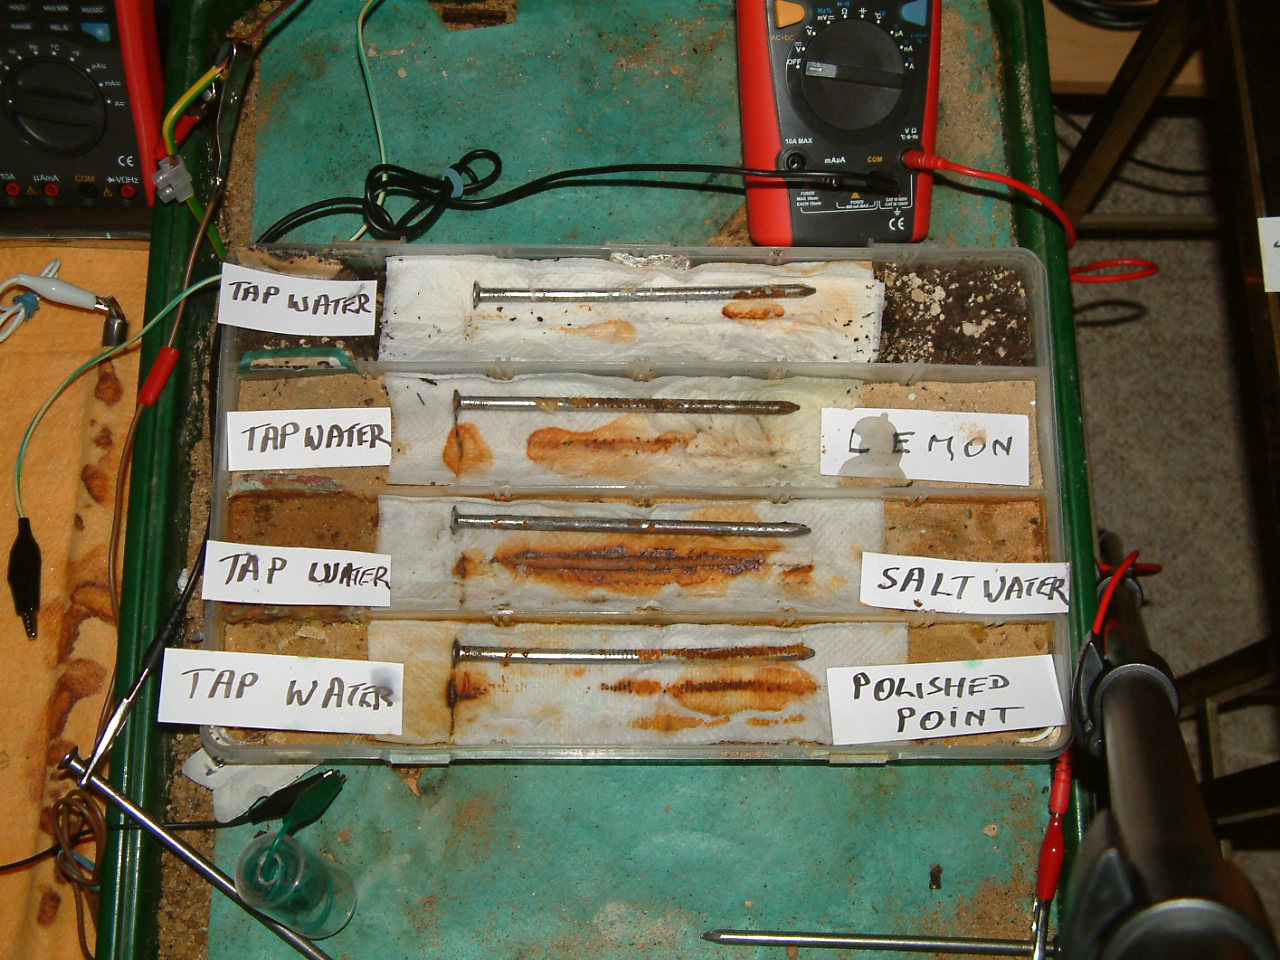
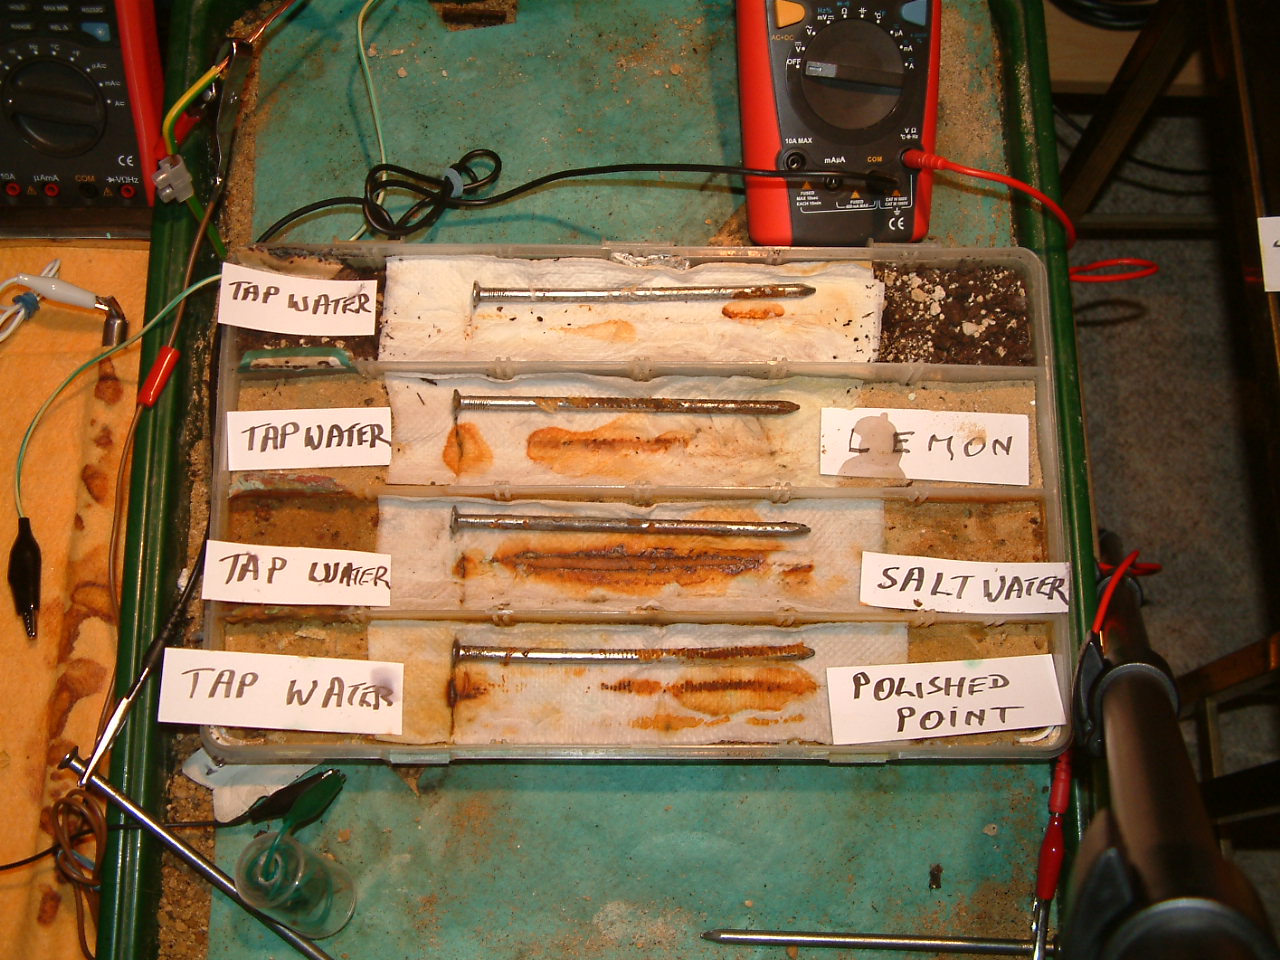
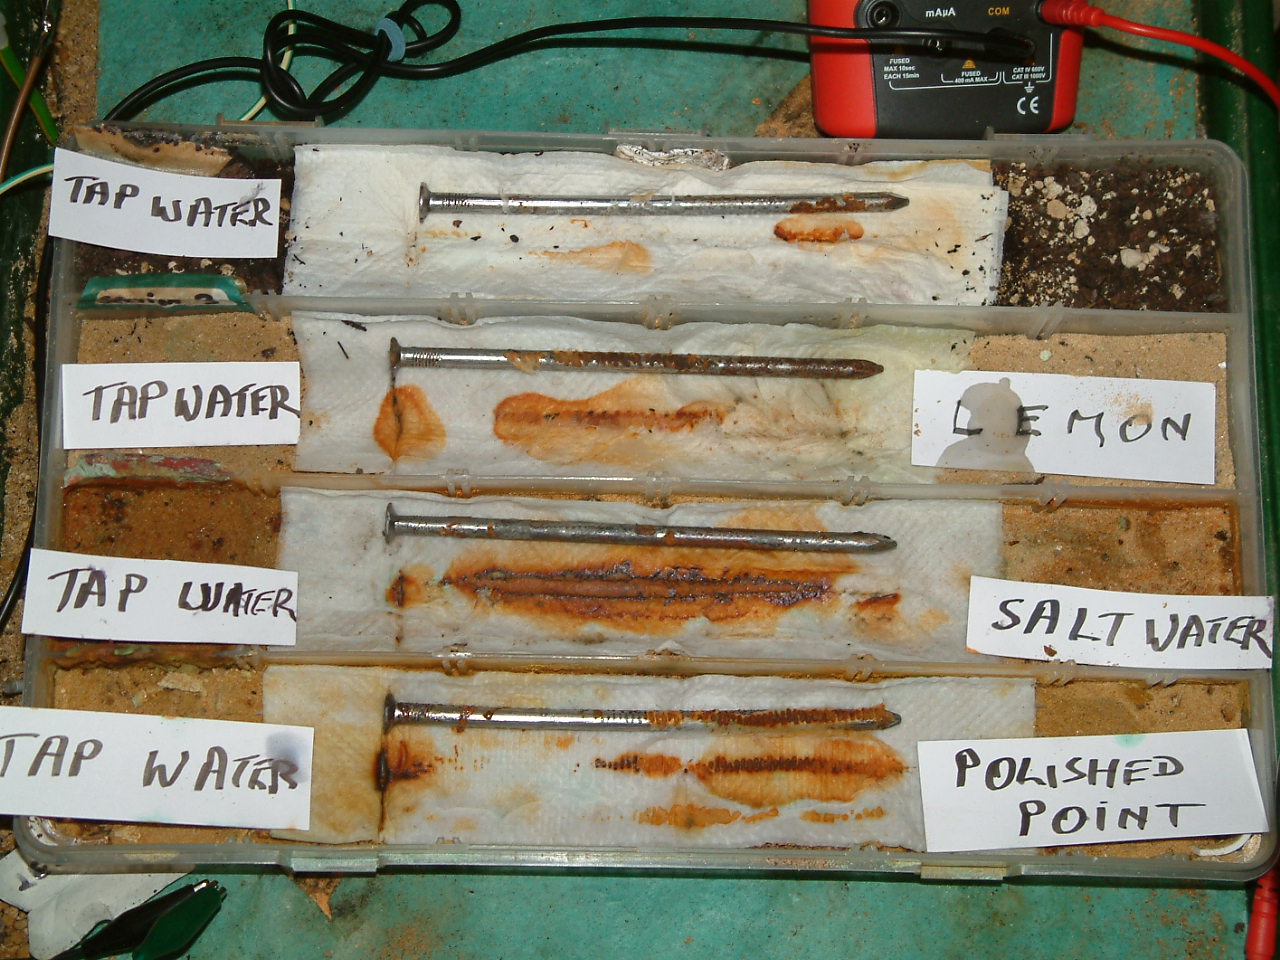
In these pictures we can see the real corrosion products that resulted from the reactions that caused the readings we have observed.
36
This validates the opinion that we are measuring the effect of electrical charges in the electrolyte and that these charges resulted from the corrosion.
37
It shows that the copper/copper-sulphate electrode can be used as a fixed referrence potential but that this is dependent on the meter to set it as zero. If we put the test leads in the other way round each measurement would have a different zero according to the display.
38
The graphs that we show as the result of DCVG and CIPS surveys are voltages between two floating potentials.
39
However this data need not be wasted as there are ways to establish a true zero for corrosion control purposes and extropolate a true criterion for each location.
40
It can be seen that corrosion is dependent on many features such as pH and resistances in the electrolyte that must be included in the measuring process.
41
Link to next page
Email Cathodic Protection Network International Limited