DCVG The two-half-cell survey
(Plotting the electrical potential of the ground using two Cu/CuSO4 electrodes)
The development of Direct Current Voltage Gradient surveys.
In 1973 I realised that the Copper/Copper-sulphate ground contact electrode is not a reference potential because a variable voltage was obtained between two of them.
The voltage between any two reference potentials must be constant otherwise one or other must be variable. If either is variable then it is impossible to know which one... we only have one reading and that is the difference between the two.
Tradition held that the pipeline potential was variable and we were to measure it's potential with reference to a constant potential that was compared to an international standard potential in a laboratory.
Taking 'pipe-to-soil potentials' at test posts was supposed to render a measurement of the voltage between the constant reaction potential of copper to a saturated solution of copper sulphate and the reaction of the pipeline metal at that location.
On my first day of field work in cathodic protection I reasonned that this could not be correct for two reasons.The resistance of the pipeline metal between two test posts is so small that it cannot be measured on most instruments.
Moving the ground contact electrode caused a variation of the displayed voltage.
I obtained a second copper/copper-sulphate electrode and took a voltage between the two when the porous plugs were touching and they we almost of equal potential.
However, when I contacted the ground and moved each, there is a variation in the voltage.
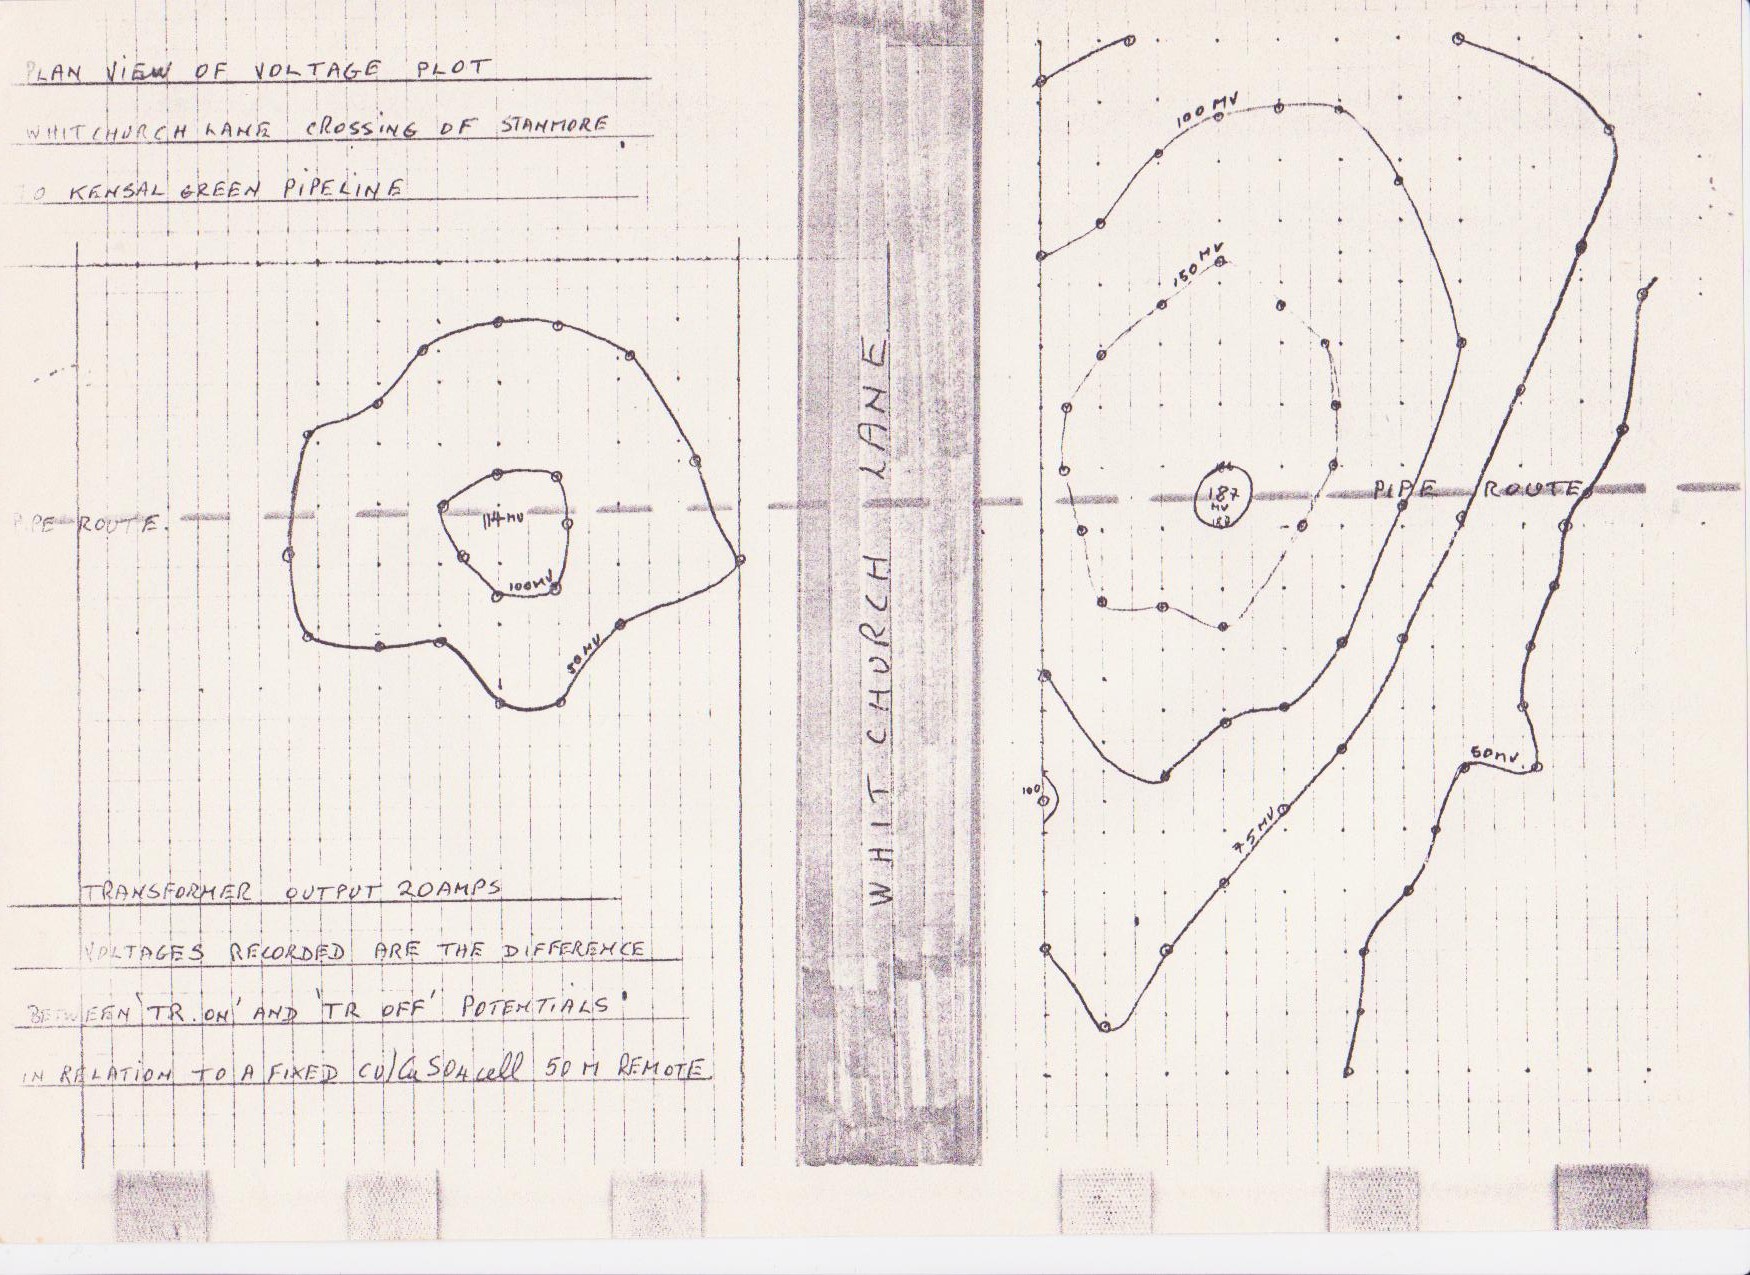
This observation led to my fascination with ground potentials and a series of experiments in the UK and Iran resulted in the first ground potential survey that I have ever seen written into a contract with records of the data and results. I devised this type of survey in 1975, when working for The Shell-BP Development Corporation of Nigeria.
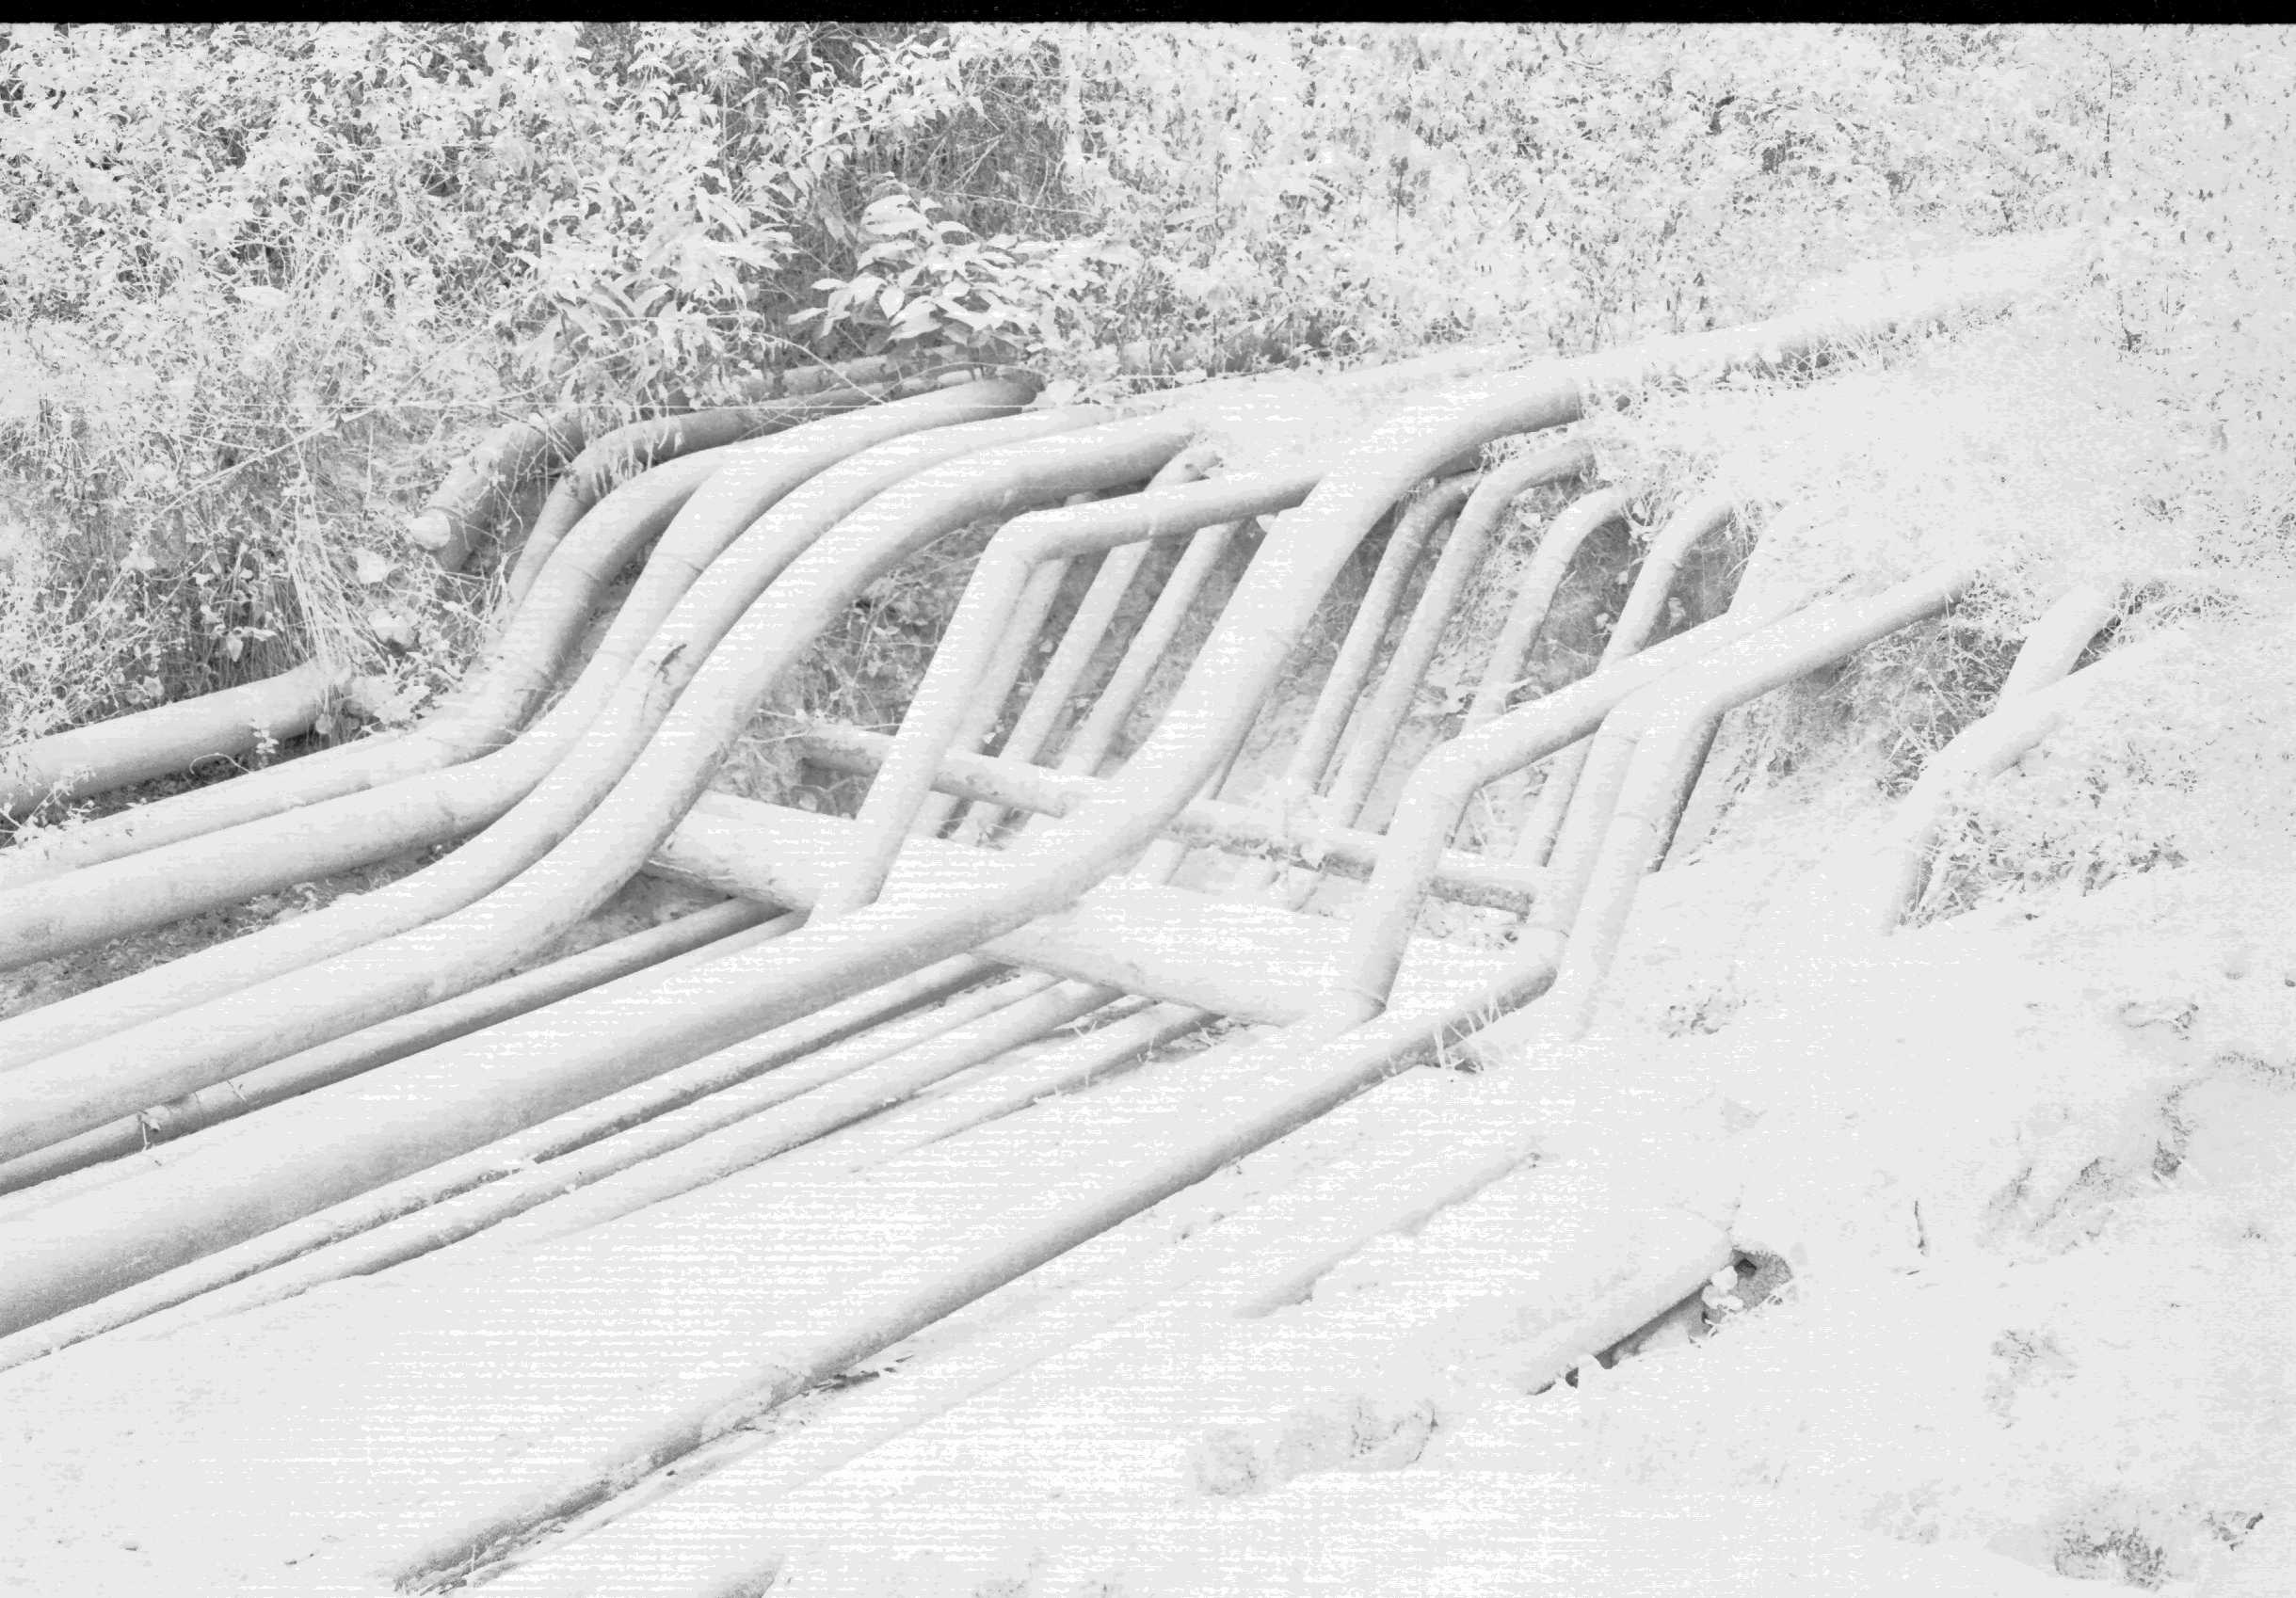
I was faced with a situation of several thousand miles of buried pipelines, manifolds and associated buried pipes of which the drawings had been lost in the conflict that had taken place in Nigeria during the years before I arrived.
There were approximately 40 oil fields, producing through a network of pipelines to an export facility with an offshore SBM system to which the supertankers moored.
I was given responsibility for all corrosion matters in the Eastern Division where re-habilitation of the Biafran War damage was taking place and where there were constant leaks due to corrosion.
The main problem was that manifold drawings had been destroyed and piping had been constructed to re-establish oil and gas production. The new piping was connected to the old manifolds but there were no drawings to show the complete buried layout of configuration.
Digital instruments were not available and the analogue meters were more sensitive to current flow than to potential differences.
I had experimented with the detection of ground flowing direct electrical currents in the UK and in Iran, and devised a method of detecting the presence of high electrical potential zones based on the simple assumption the current would flow at a greater rate between areas of greater potential difference.
The impressed current cathodic protection systems in Nigeria had been connected to every available coated pipeline but the underground layout had not been known at the time. Consequently the circuit drawings were not a true schematic of the actuality.
The coating on much of the underground pipework had been damaged or was not effective due to degradation with age and damage by spilled products during the bombing.
Using the impressed current systems I was able to plot the underground piping and correct many of the drawings prior to excavation where necessary to repair the coating.
I issued several contracts in which I defined the work to be carried out in plotting the direct current flow over several areas with a view to plotting the potential gradients in the ground. (One of these contractors was Mark Derefaka who is now a senior consultant to the Nigerian Petroleum industry, and who I met again at the first African Corrosion Conference in Lagos in 1993.)
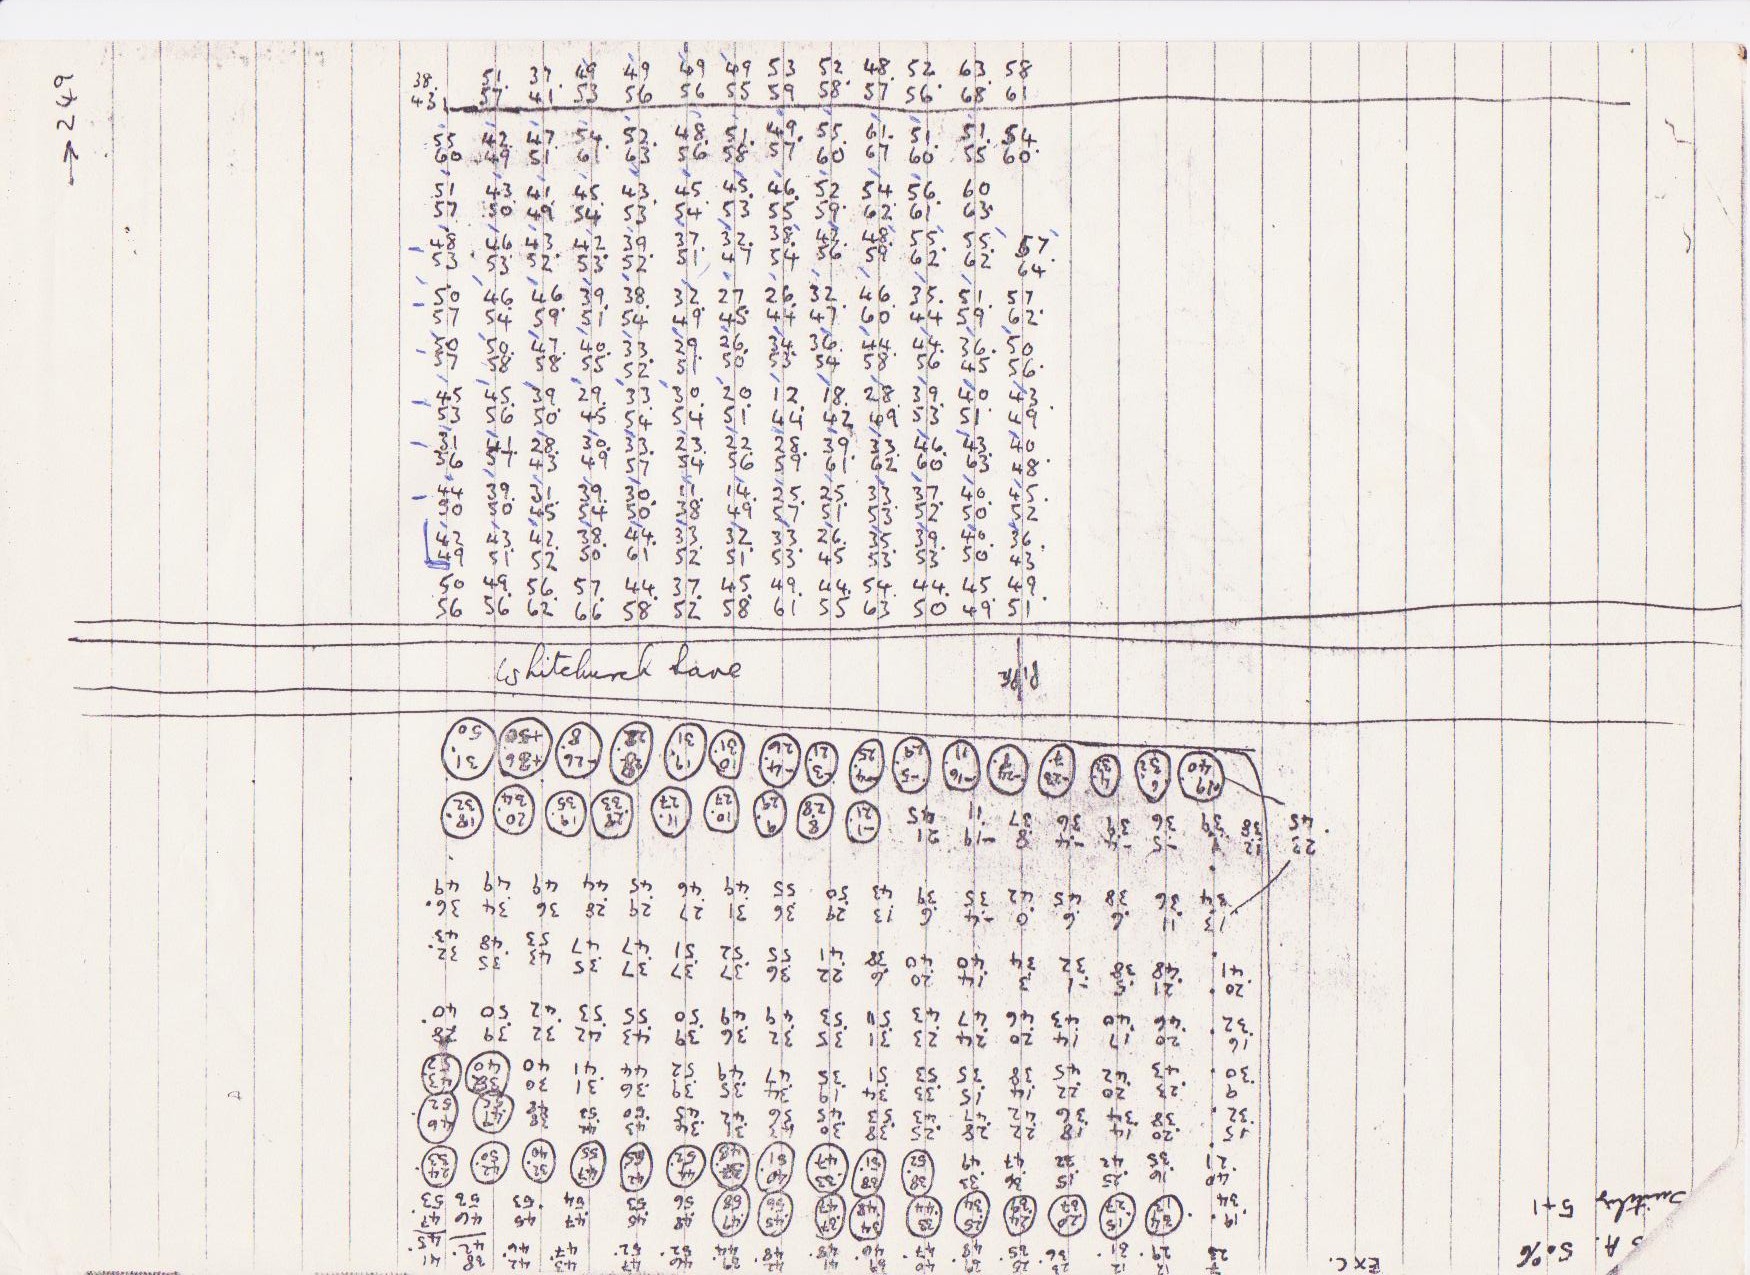
A grid was marked in the ground with pegs at 1 meter intervals over the area to be investigated.
The current directions were plotted by noting the polarity and strength of current through a sensitive ammeter, between two standard copper/copper-suplhate elecrodes placed in the ground at the positions marked by the pegs.
The resulting drawing showed the path and strength of ground currents and showed features underground which were then excavated for examination.
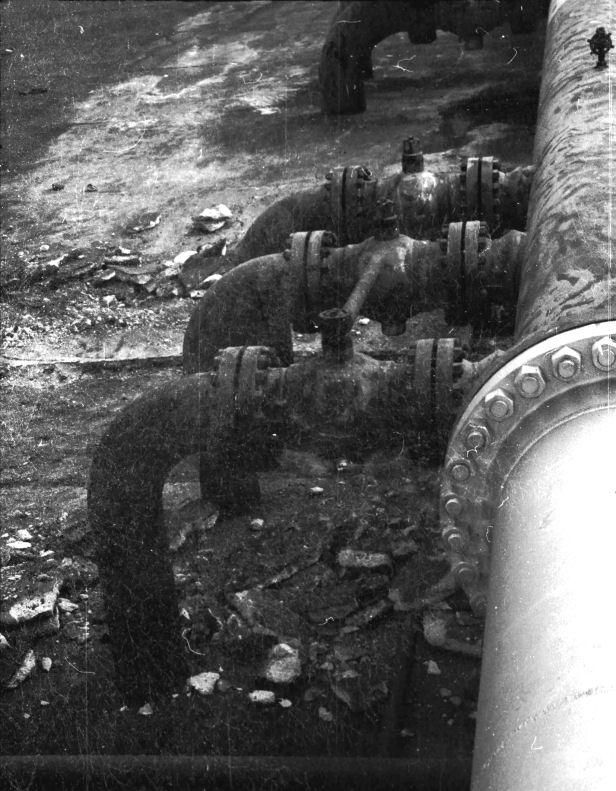
At Bomu Manifold we were able to locate valves and pipework which was not known to exist, but that was still connected to the working manifold. This was draining protective current from the cathodic protection system, but once re-coated and added to the drawings was of no further problem.
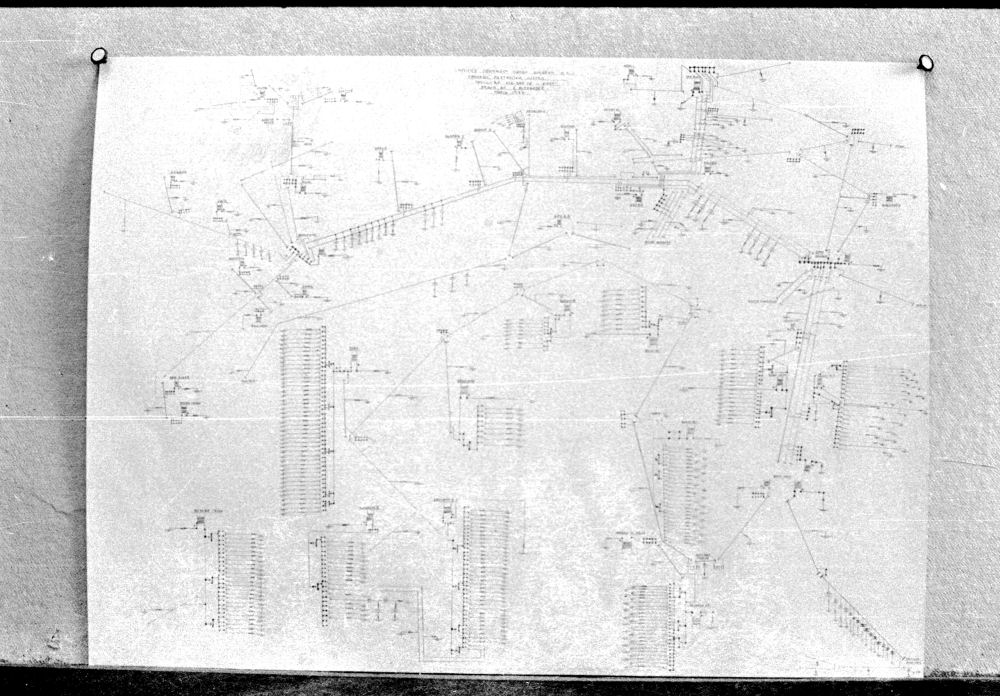
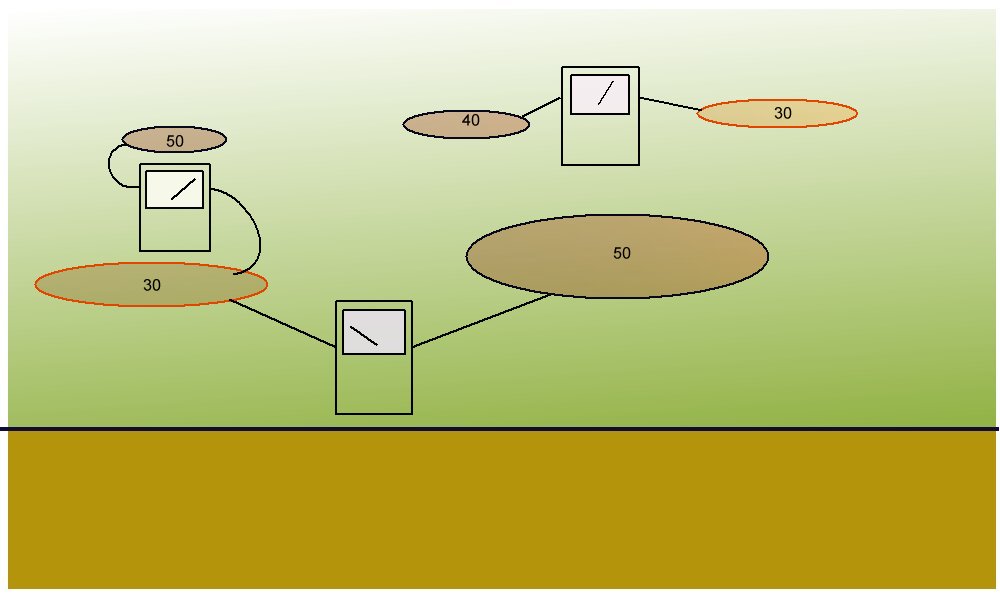
There were approximately 40 oil fields, producing oil through a network of pipelines to an export facility with an offshore manifold and Single Buoy Mooring system. This is a photgraph of the drawing I did that is an 'equivalent ciruit' that the staff of my section ENGE18 used to co-ordinate their visualisation of the 'big picture' that we had to resolve and bring into electrical equilibrium.
I was given responsibility for all corrosion matters in the Eastern Division where re-habilitation of the Biafran War damage was taking place and where there were constant leaks due to corrosion.
The main problem was that 'as built' drawings had been destroyed and emergency piping had been constructed to re-establish oil and gas production. The new piping was connected to the old land based manifolds but there were no drawings to show the complete buried layout.
Cathodic protection had been installed by guess-work and the staff of the corrosion control section were trying their best to understand and implement the guidance and advice from any source of information that they could obtain.
Digital instruments were not available and these analogue meters were more sensitive to current flow than to voltages.
My experiments about the detection of direct electrical currents flowing in the ground (that I had carried out in the UK and in Iran) had resulted in a method of detecting the presence of high electrical potential zones based on the simple assumption the current would flow from areas of high potential towards areas of low potential.
When I put a low resistance path between the two, then the charges would use this path and I could see the needle deflect in the direction of the current.
The ground potentials varied considerably and sent the needle too far in one direction or the other so I put a variable resistor in circuit to reduce the swing.
In order to get the needle to the centre I put a dry cell battery and a variable resistor to 'push the needle from it's manufactured zero to the centre of the dial.
I could then measure the relative potentials of the surface of the ground enabling me to visualise the flow of charges from all sources.
By switching each of the impressed current systems on and off a recognisable 'signal' was passed into each element of the matrix in turn. The same is done with all sources of charge that can be turned on and off such as sacrificial anodes and the earthing systems of local power supplies.
During the period that I was in Nigeria I developed the two-half-cell procedure of coating fault detection and issued several contracts specifying the procedures to be used.and which are now available on this website. More details, and practical excercises, are available within the on-line cathodic protection course.
In the early 1980's I was engaged in field work on contract to North Thames Gas, which was then part of the British Gas Corporation, under the Gas Council. I joined a team of surveyors working out of Slough and conducting a type of survey which has become known as the CIPS. There is a separate paper describing the development of this technique elswhere on this site, and the procedures developed are incorporated in my list of standard procedures for cathodic protection.
I worked with the co-operation of Mike Foskett, the North Thames Gas Corrosion Engineer and practiced and reported on the results of two-half-cell (DCVG) surveys which I conducted personnally throughout the region whenever accurate location was necessary for excavation.
I used extensive two-half-cell techniques during successful analysis of the problems at Hedgerly Manifold, Taplow Rail crossing and Ammersham Road Manifold as well as over 100 excavations which were carried out to verify the credibility of the survey techniques that were being developed.
My paper on Cathodic Protection Monitoring was published by John Tirratsoo in his two international magazines and mentioned the two-half-cell technique mentioning potential gradients in the soil as an indication of the electrical equilibrium of the pipeline. This paper is reproduced in full on this site together with a paper which supports all the principles and defines potential gradients in the ground.
In the mid 1980's I held a Cathodic Protection Course for Graduate Corrosion Engineers from the University of Manchester Institute of Science and Technology (UMIST) during which the students were required to carry out two-half-cell techniques and later these same students were given the opportunity to carry out field work on pipelines owned by the Severn and Trent Water Authority.
We now have to understand how this all makes a big picture that we can use to stop corrosion and in order to do that we have to describe what cathodic protection actually does on a grand scale.
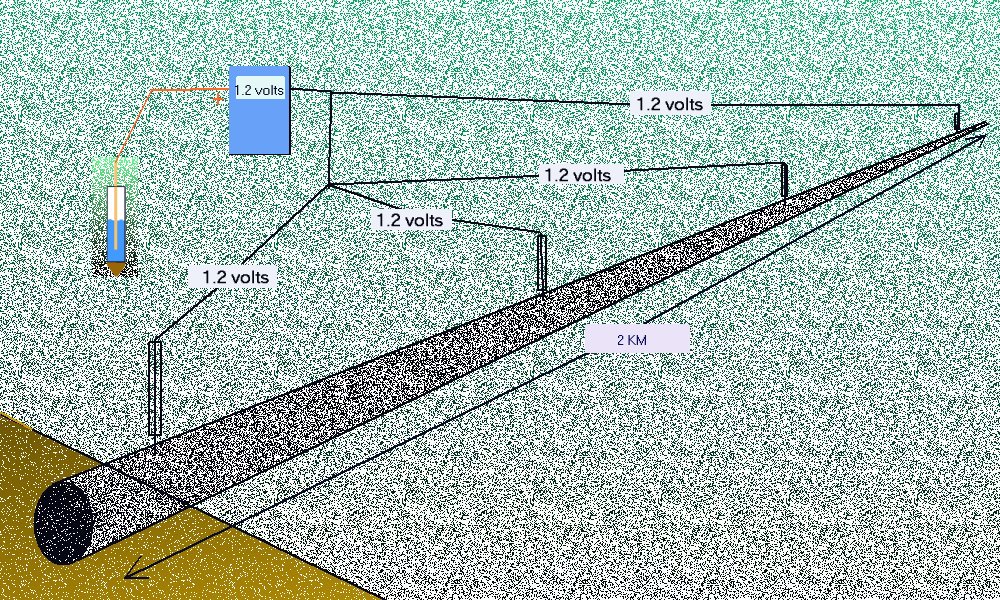
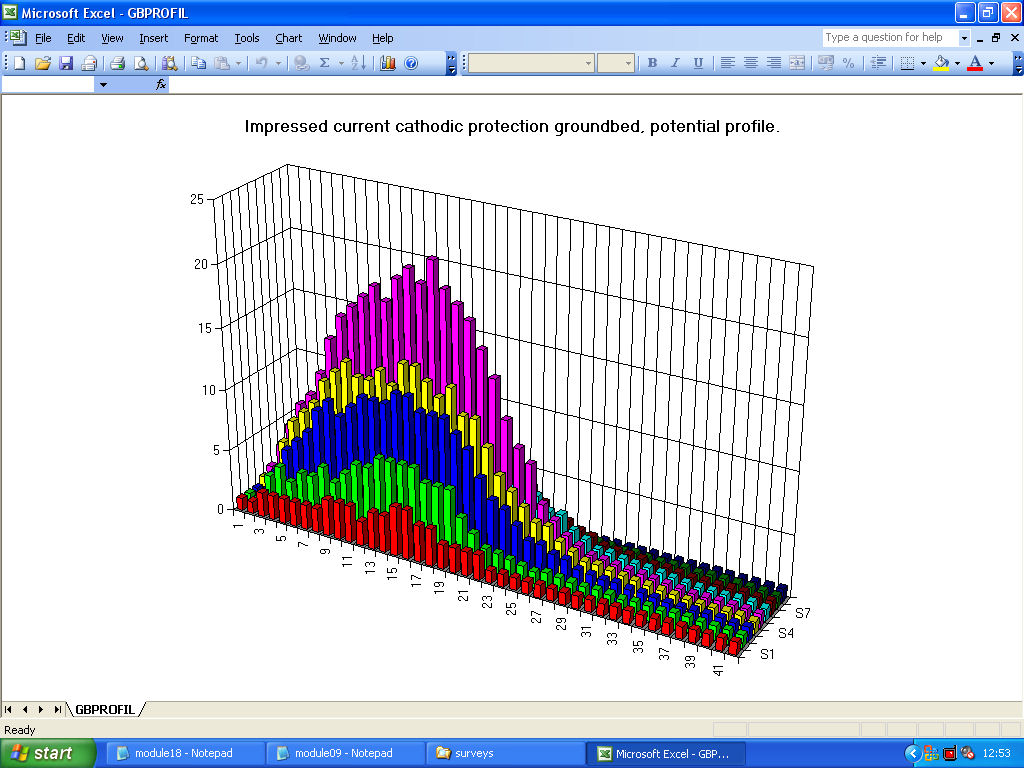
We pump charges into the ground at the impressed current groundbed and these charges toke the least line or resistance to remote earth. If the groundbed is a line of anodes close to the surface (up to about 3 meters deep) then we will form a 'pile of electricity' that we can detect and measure by contacting the ground at the surface above them.
The negative pole of the transformer rectifier sucks charges from the pipeline and that is why the connection is known as the 'drain point'. We can conveniently say that this is at zero potential for the purposes calculations.... we have to start somewhere.
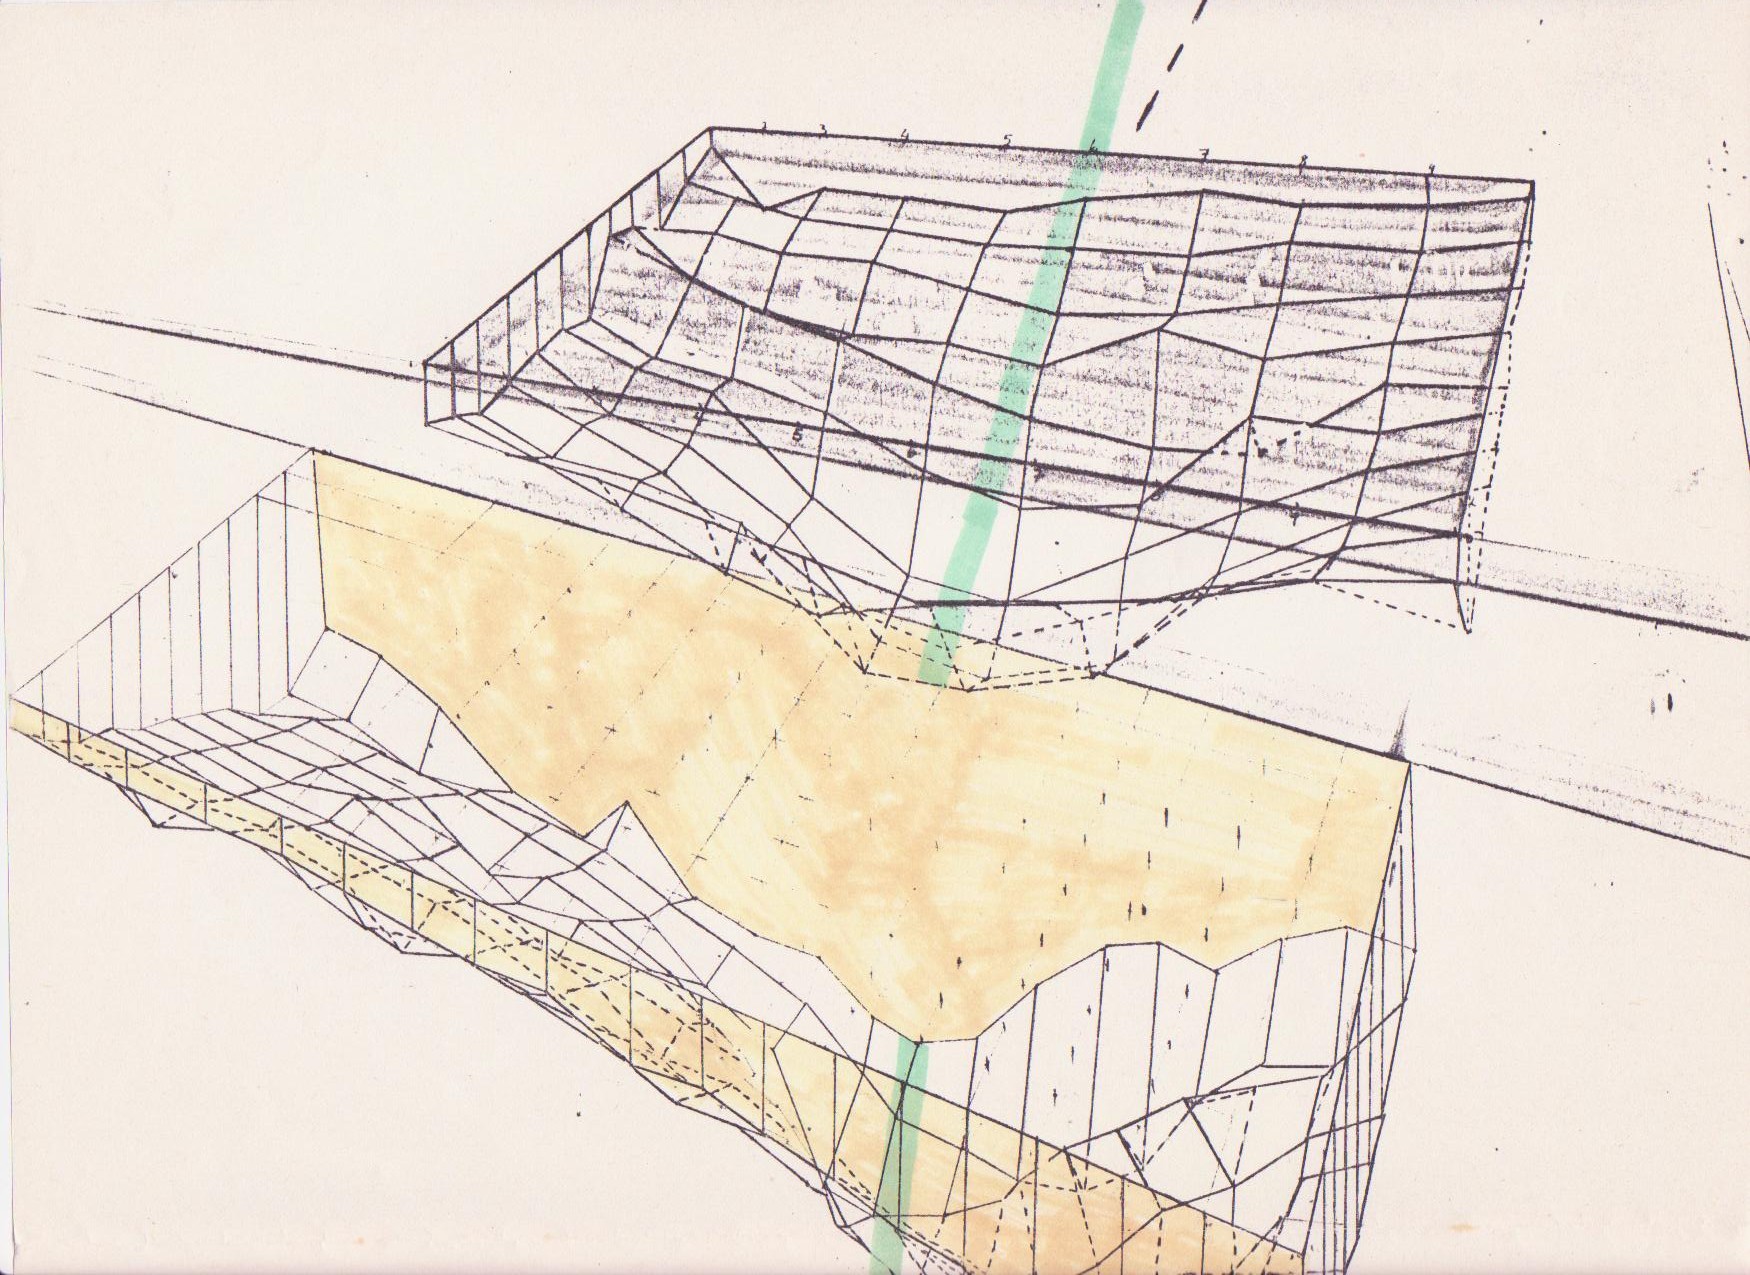
The next few pictures show the steps in logic that helped in visualisation of the electrical equilibrium in the ground when charges are impressed.
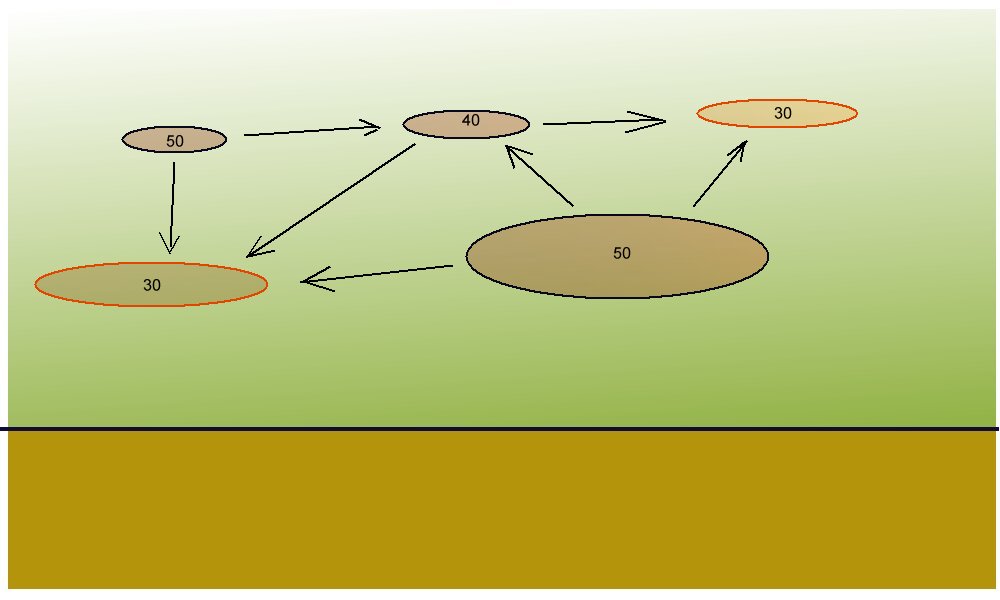
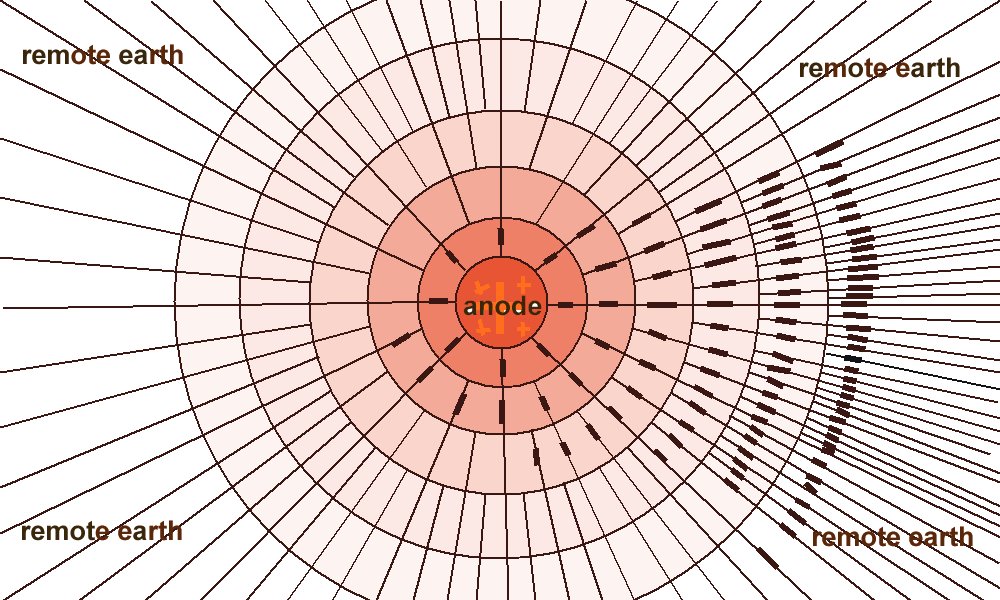
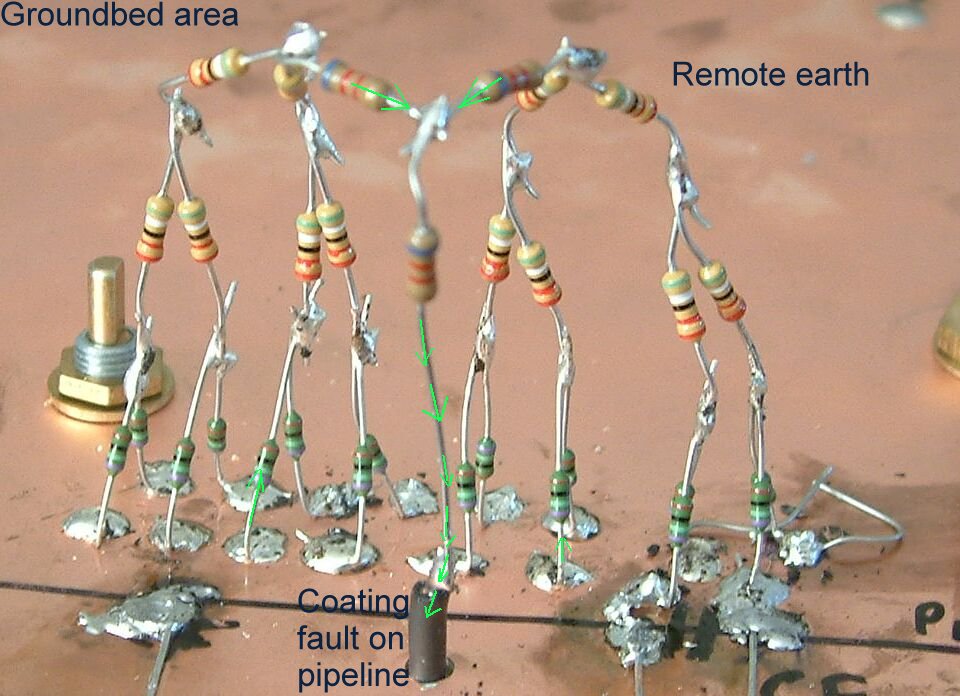
Kirchoff wrote that charges would distribute themselves through a circuit in proportion to the resistances that they encounter. Therefore their distribution might be visualised like these drawings. Resistances are shown as they are in circuit diagrams to help you visualise what I mean.
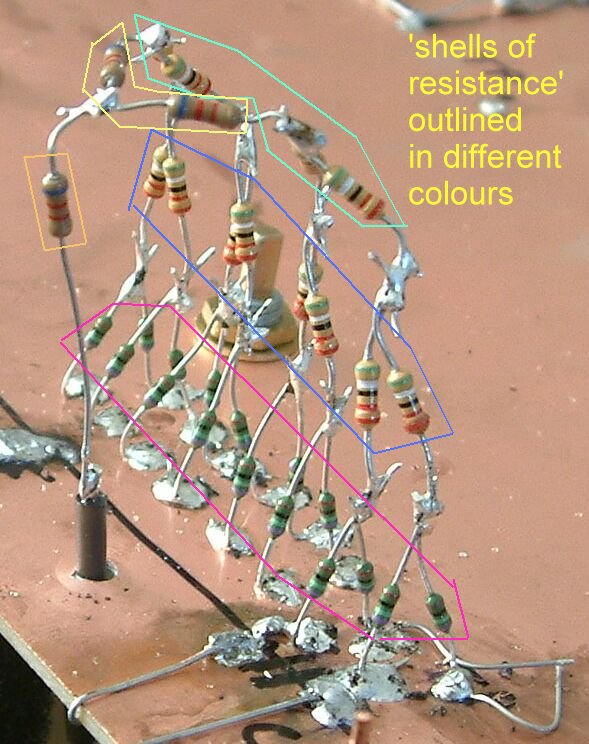
Some scientists have refered to this structure as 'shells of resistances' and others mention cones of resistances or potentials. In this drawing I have shaded the resulting potentials and this can be observed experimentally in field work.
The problem is that if you visualise cones then you might mistakenly think that current in the earth path is directional, but this is not true.
In fact what we are measuring is the potential difference between the zones of the ground in which we place the ground contact electrodes.
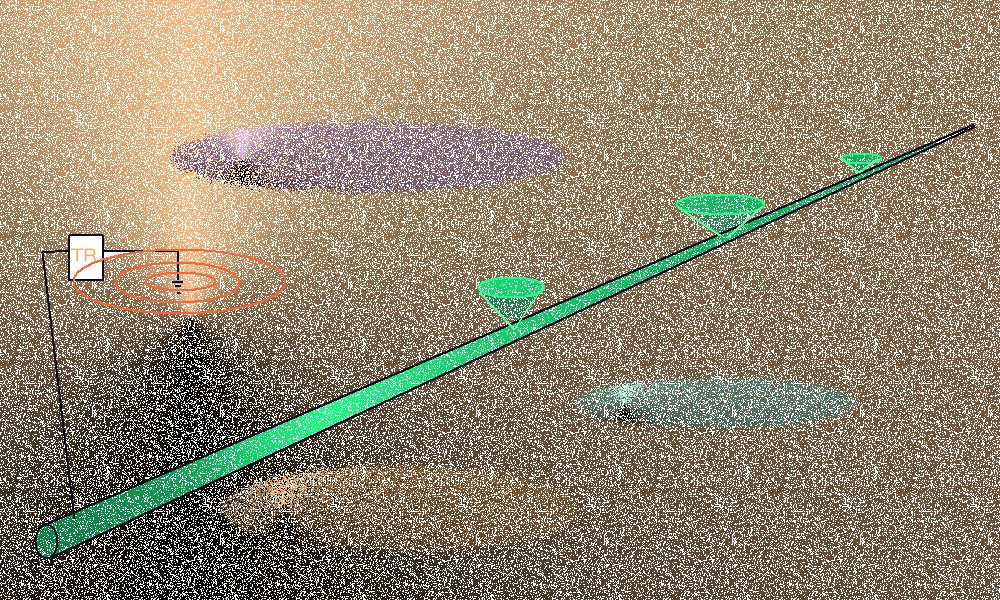
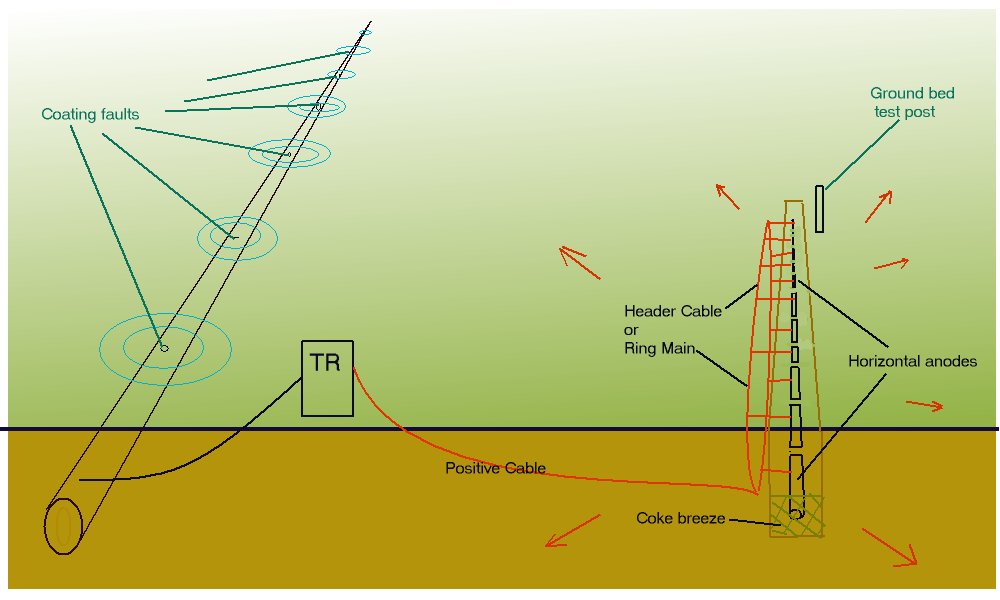
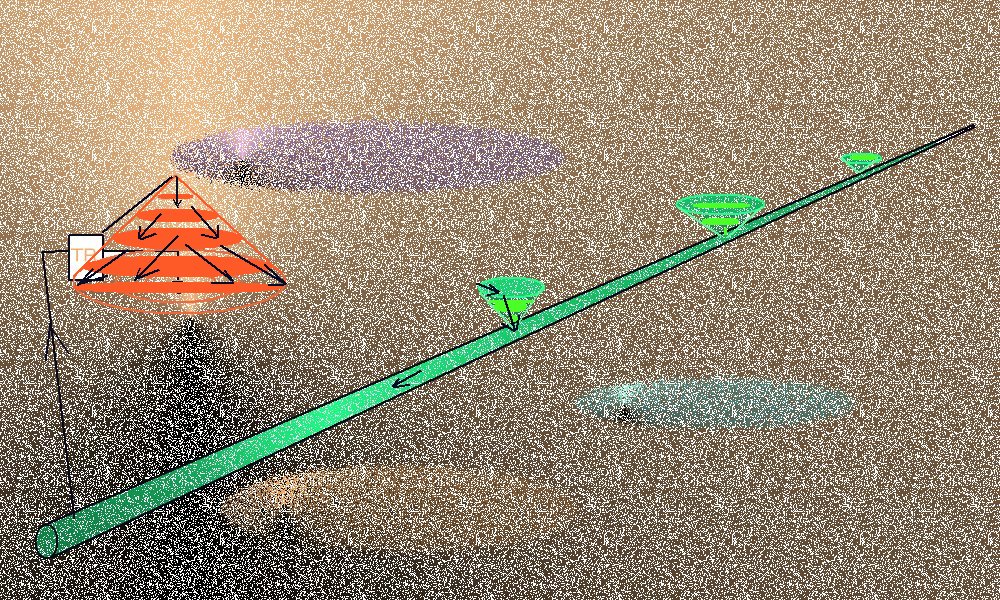
This can be dramatically demonstrated in the field where the impressed current system uses horizontal anodes in trenches about 2 meters deep.
in this drawing we see the charge distribution to remote eath from a single such anode and this is easily plotted in the field and on demonstration models.
This was plotted using a hand held data logger and two Cu/CuSO4 electrodes. One of the electrodes was in a fixed position and the other 'roving' with a trainign wire of armature winding cable that is insulated with shellac.
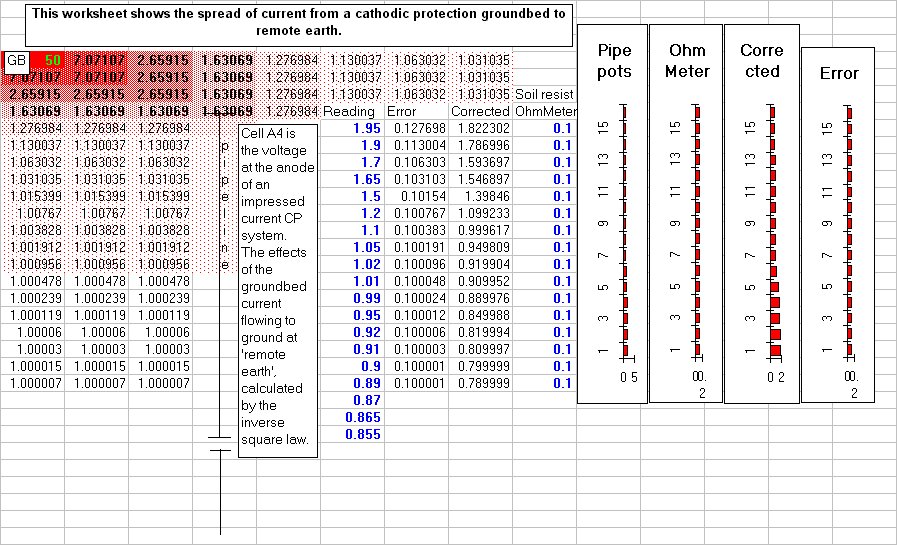
It is also possible to create this effect using electronic components and it follows that we can make a mathmatical computer model.
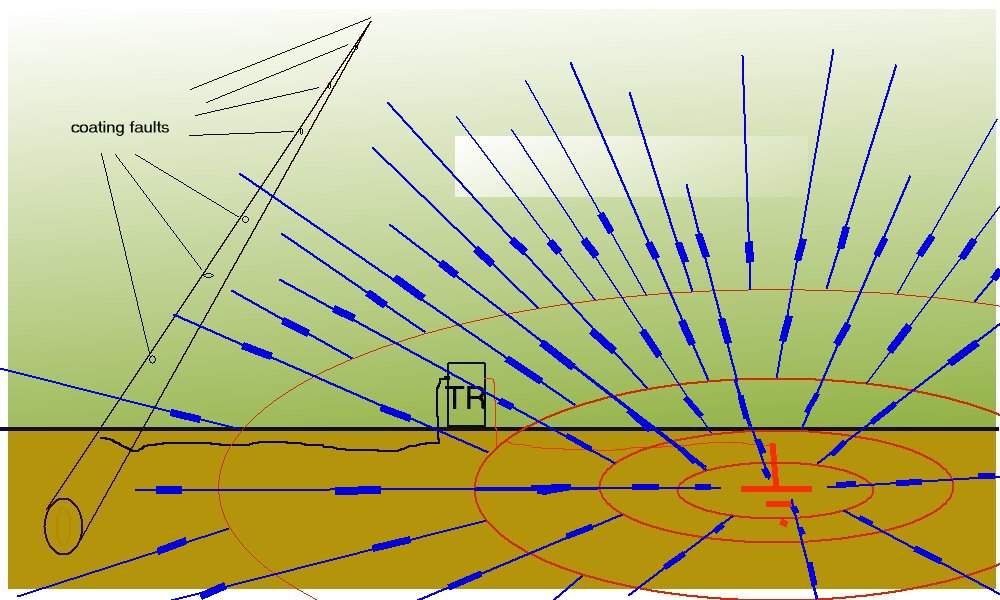
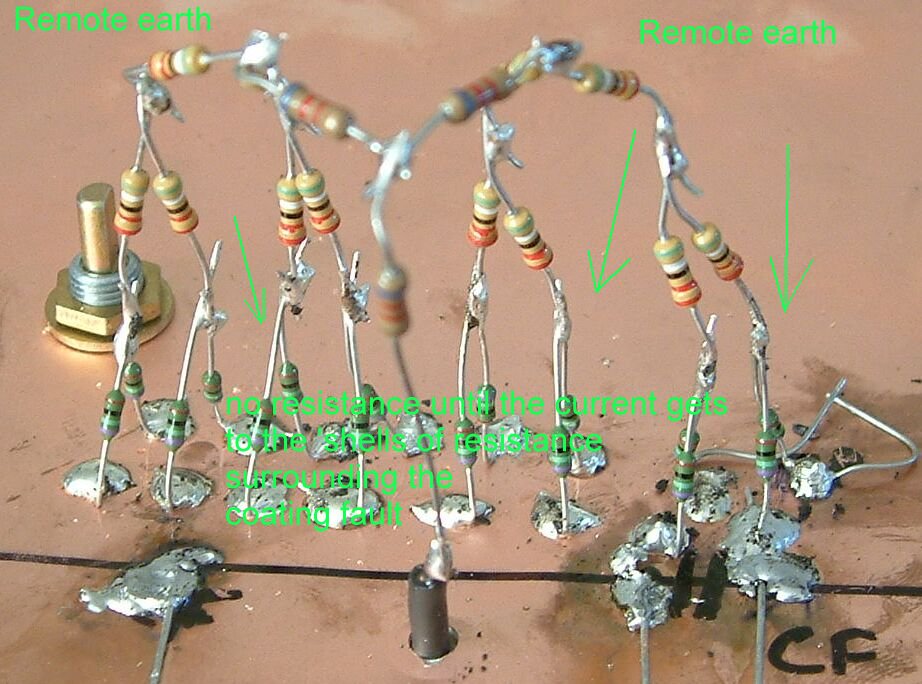
From remote earth to each coating fault we have to visualise an ocean of charges and the paths taken to complete their circuits are governed by the laws of electricity .... these charges take the line of least resistance.
The charges have to pass through shells of resistance from remote earth to the point of entry into the metal.
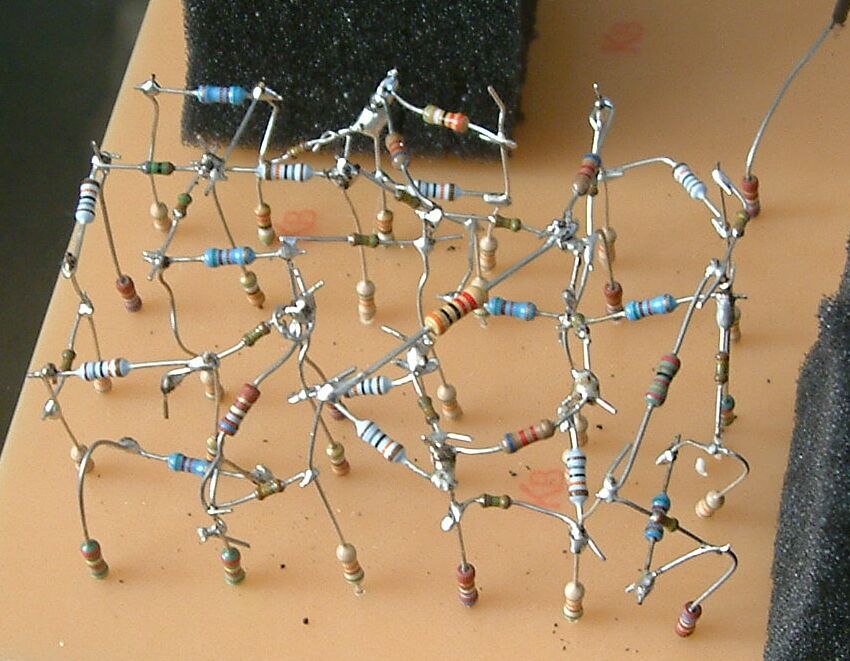
In these pictures the shells of resistance have been modelled using physical resistors so that actual measurements can be taken experimentally to test the theory.
The solid copper plate is remote earth with no measurable resistance to which the first layer of resistances have been soldered.
These pictures show that this model replicates the shells of resistance mentioned by by the late Dr's Prinz, Baekmann Baltz etc etc.
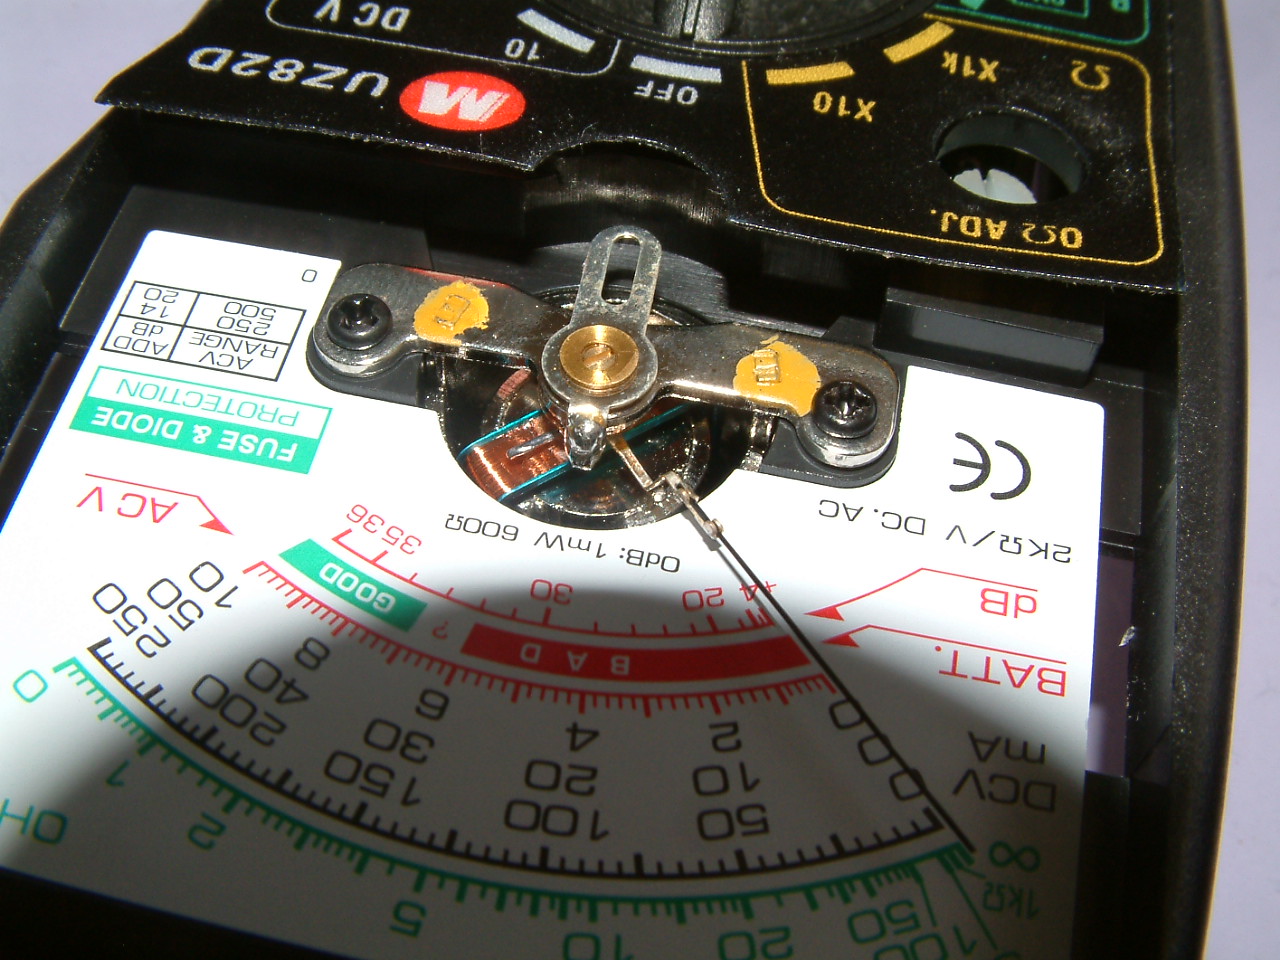
When I was developing my techniques, the resistance in the meter was much less than the resistance in a digital meter as the current was used to drive the magnet against the calibrated elastic memory of the hair spring.
If you were measuring voltages, this made it less accurate as the potentials at each pole tended to equalise due to the work done by the current. However the measuring circuit provided a less resistant path for charges than the earth itself so by using a centre null meter I was able to see which earth contact probe was in the highest potential ground.
It was easy to adjust a normal meter to make it centre null as this only requires physically changing the relative position of one end of the hair spring.
By setting the meter to measure current you could avoid the in-built resistances and by putting a variable resister in one side of the circuit you could control the span of the measurement. By putting a battery and centre balance variable resistor in the other side you could bias the measurement to calibrate it to the centre. This allowed us to re-calibrate the measuring circuit on site.
The reason why I used switching was to identify each source of energy and thus get further information to add to the plan of the area.
Some companies today are claiming that switching is somehow able to identify anodic and cathodic indications but I have never seen any proof of this and it does not stand scientific or technical scrutiny.
In the early 1980's I was engaged in field work on contract to North Thames Gas, which was then part of the British Gas Corporation, under the Gas Council.
I joined a team of surveyors working out of Slough (UK) and conducting a type of survey which has become known as the CIPS. There is a separate paper describing the development of this technique elswhere on this site, and the procedures developed are incorporated in the Cathodic Protection Network list of standard procedures.
I worked with the co-operation of Mike Foskett, the North Thames Gas Corrosion Engineer executing and reporting on on the results of two-half-cell (DCVG) surveys which I conducted personnally throughout the region whenever accurate location was necessary for excavation.
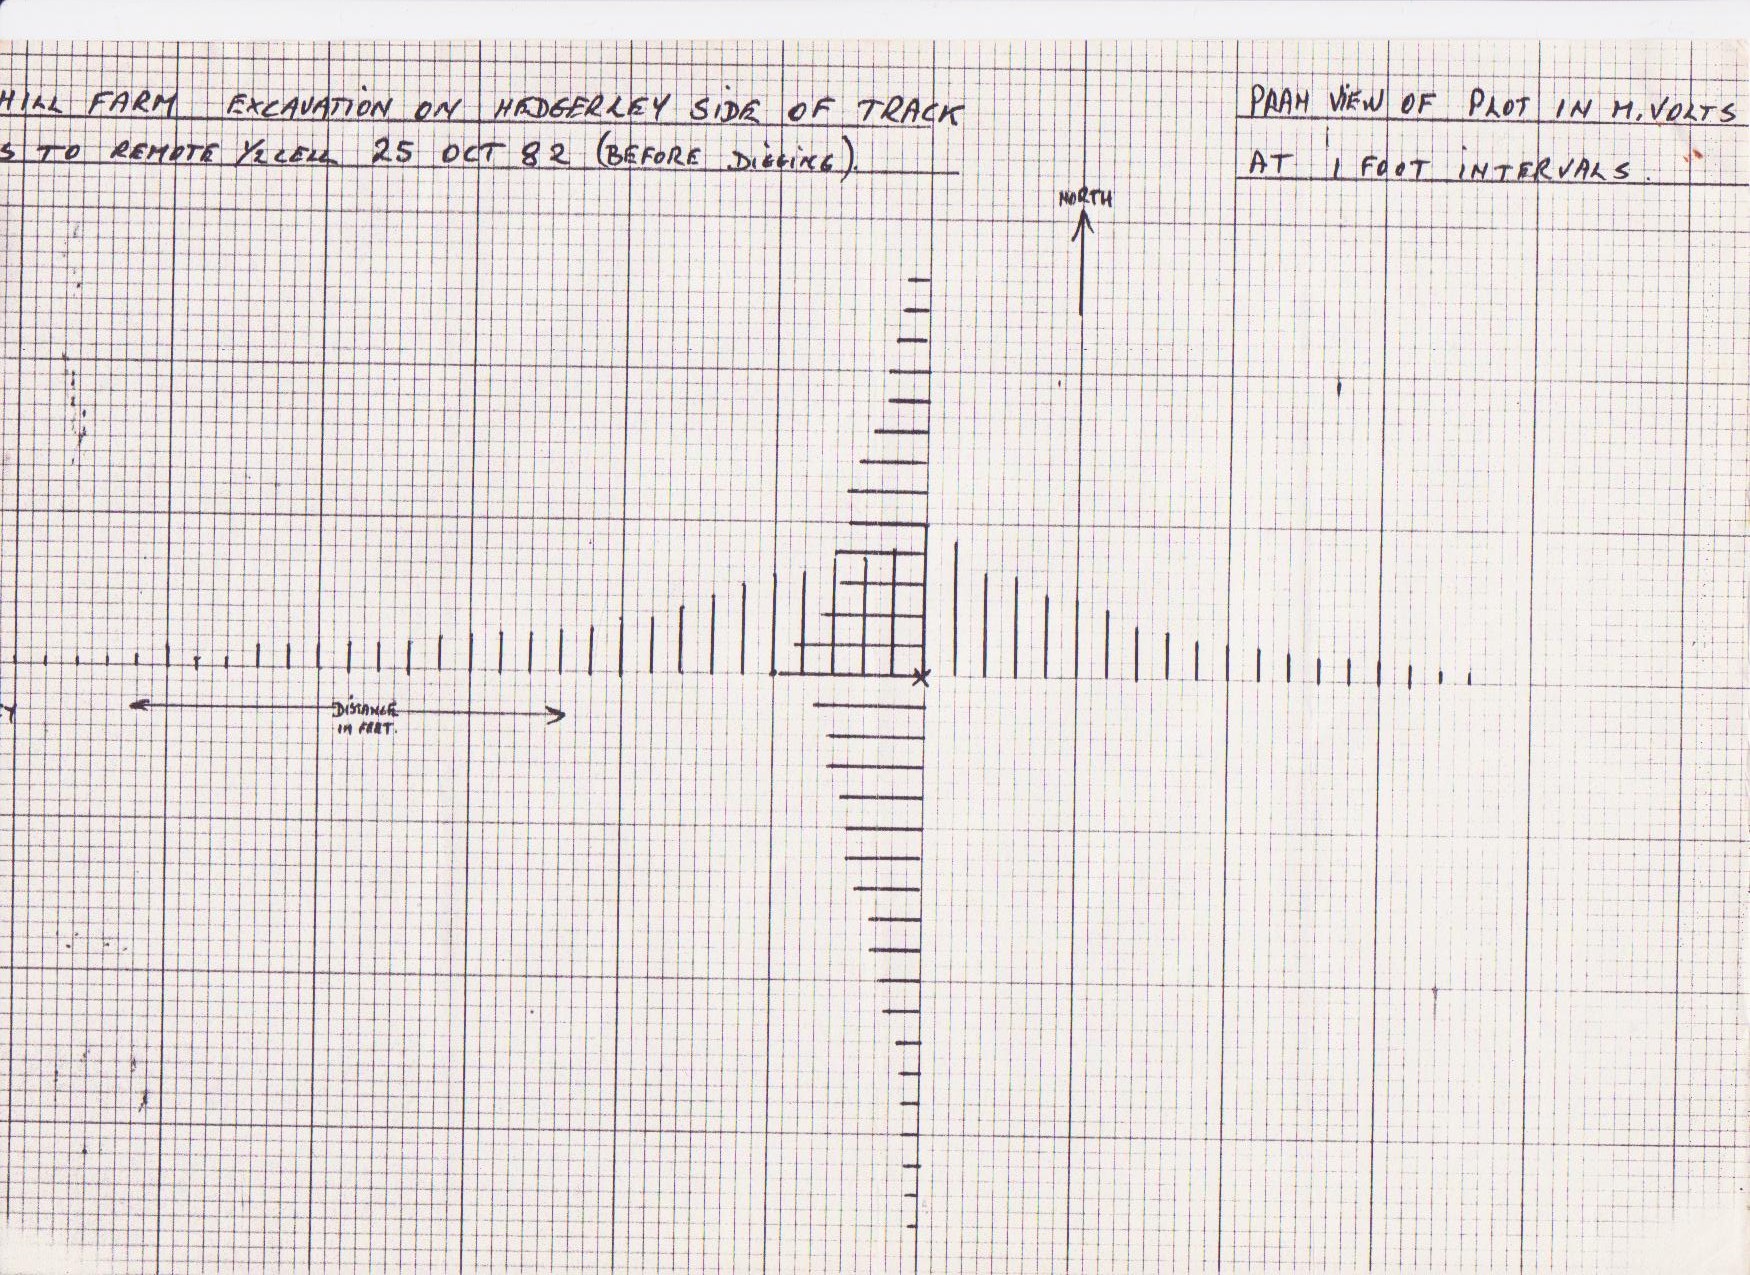
By this time digital voltmeters were readily available and I adopted the practice of plotting the potentials of the ground in grid patterns and manually drawing three dimensional graphs to explain matters in my reports.
I used extensive two-half-cell techniques during successful analysis of the problems at Hedgerly Manifold, Taplow Rail crossing and Amersham Road Manifold as well as over 100 excavations which were carried out to verify the credibility of the survey techniques that were being developed.
My paper on Cathodic Protection Monitoring was published by John Tiratsoo in his two international magazines and mentioned the two-half-cell technique of plotting potential gradients in the soil as an indication of the electrical equilibrium of the pipeline.
This paper is reproduced in full on this site together with a paper which supports all the principles and defines potential gradients in the ground.
Procedure 7 is part of the suite of two half-cell surveys published on the internet by Cathodic Protection Network and is being marketed as by some companies DCVG. Ground potentials were described in the paper 'New Developments in Measuring the Effectiveness of Cathodic Protection'.
Fig 4 clearly shows a voltage being measured between to half-cells (electrodes) and throughout the paper there is a discussion about the effects of ground potentials.
The above paper was written to draw attention to facts which make it necessary to find a new method of establishing the corrosion status of the pipeline metal.
It shows that 'potential gradients in the ground' have sound scientific credibility and that the two-half-cell survey is a valid tool for field engineers.
This type of survey is merely a method to locate coating faults with great degree of accuracy. There seems to be no evidence that DCVG can indicate the state of the metal at the location of a coating fault or whether the cathodic protection current is effective. However, it does indicate that cathodic protection current is entering the pipeline but it must not be assumed that this is necessarilly entering at the anodic interfaces. It is likely that cathodic protection current is entering at the cathodic interface of the corrosion cells and a question of doubt whether the electrolyte potential at the anodic interface has been raised to balance the corrosion reaction EMF.
The 'two-half-cell' survey is a powerful tool which can be used by any field worker using instruments and equipment which is available in every Cathodic Protection organisation and department.
Connecting a 'half-cell' on each pole of a meter clearly demonstrates neither of the two half-cells can be regarded as a 'reference electrode'. Any reference potential must be fixed in relation to other reference potentials and this type of survey shows that the voltage between the two is variable. The reaction within each electrode being identical, it must therefore be other potentials within the measuring circuit which differ between one point of contact and another.
This is the procedure that I published many years ago.
INSTRUMENTS
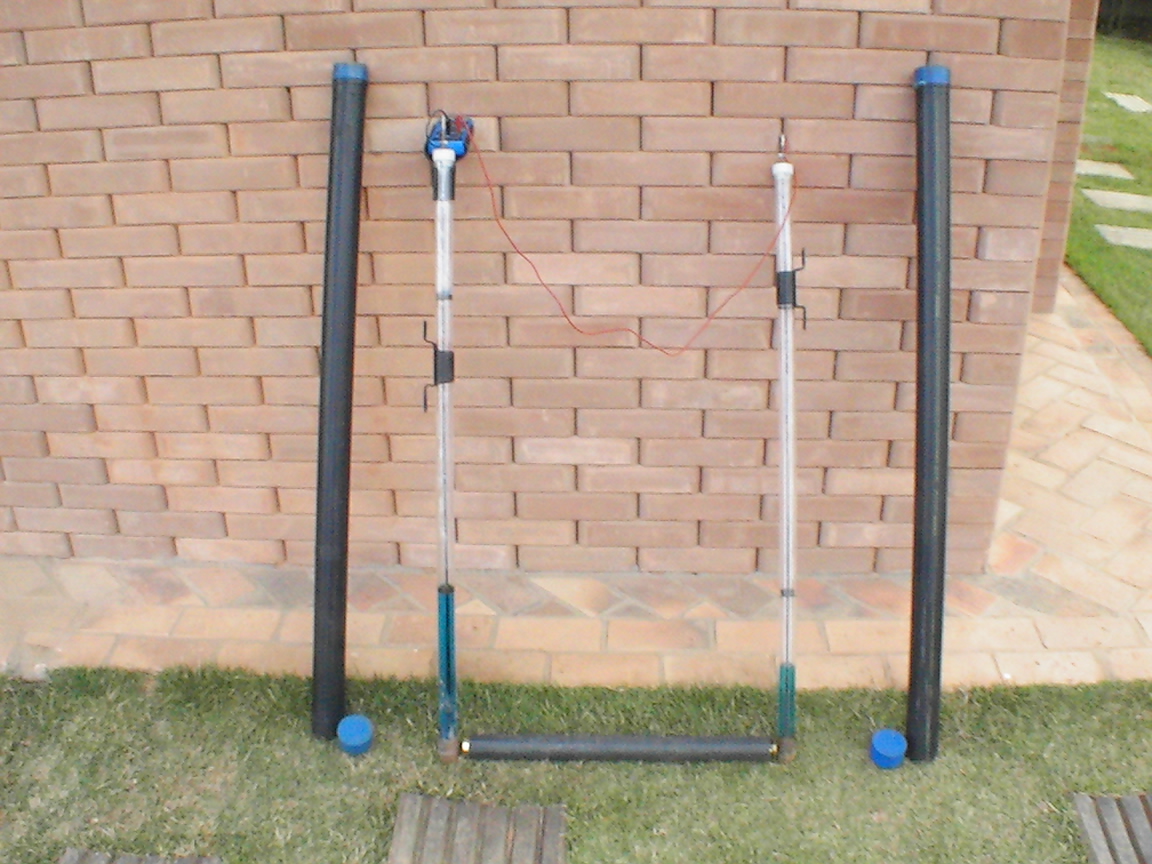
High resistance voltmeter. 2 Cu/CuSO4 electrodes. Trailing conductor reel and mounting.
METHOD
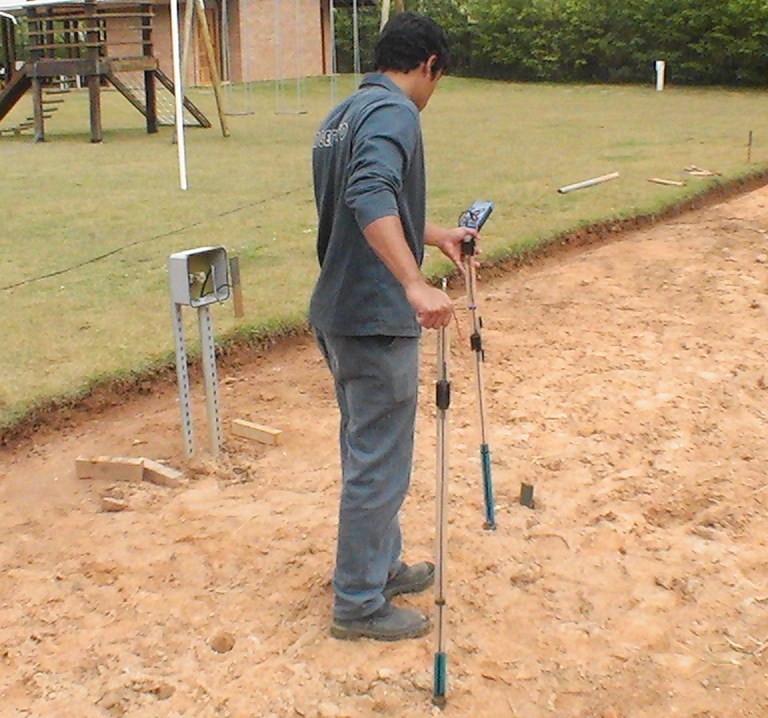
7a.1.1. Each electrode should be fixed into a holder which enables the operative to place it in firm contact with the ground without stooping. Alternatively the half cell can be made into walking sticks using a variety of configurations and materials.
7a.1.2. The electrode conductor wires should be connected to the positive and negative poles of a volmeter.
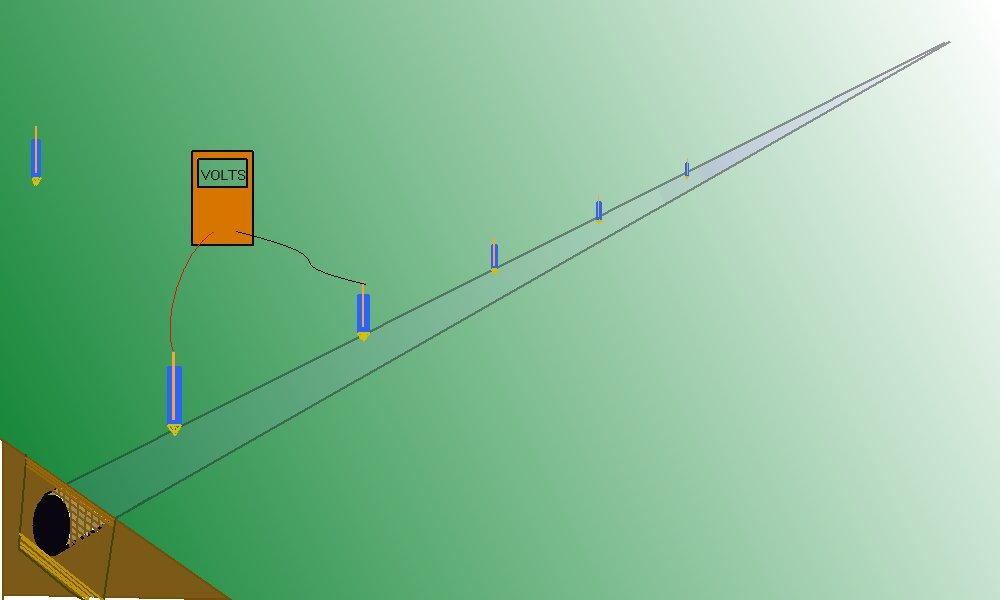
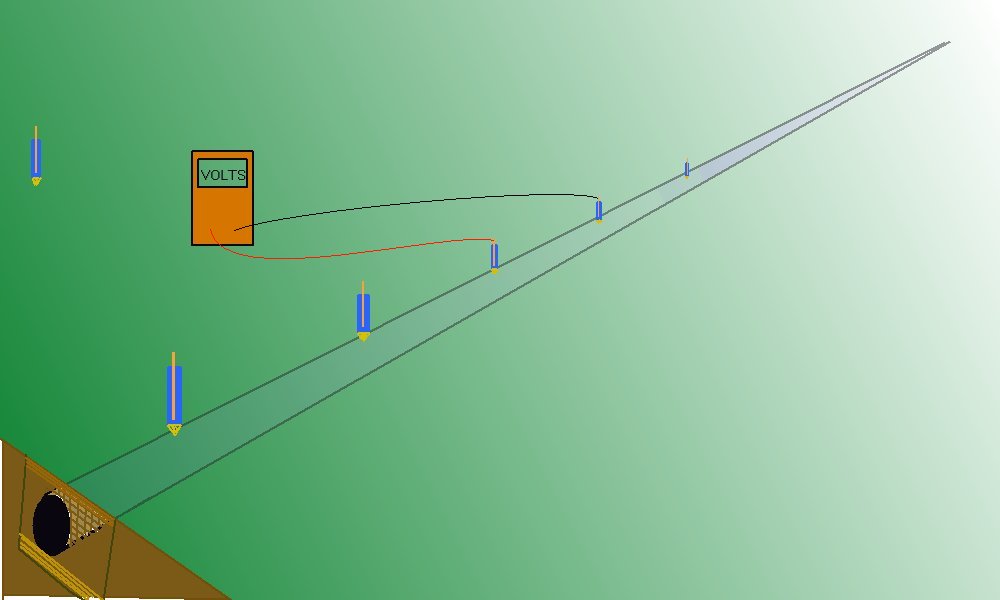
7a.2.1. Using the two electrodes in a 'stepping action' they should be placed in contact with the ground at 1 m intervals as close as possible to the centre of the pipeline route.
7a.2.2. The meter reading should be noted as each electrode changes position.
7a.2.3. The operator will see that the polarity sometimes changes and this indicates that the ground potential is higher with the electrodes in one direction than the oposite.
7a.3.1. It is useful, but not essential, to record the polarity, as the operator can then visualise that the electrodes are reacting to an increase or decrease in the ground potential.
7a.3.2. The locations of highest voltage should be marked. These are normally before and after a very small voltage due to the electrodes being in positions on either side of a 'potential peak'.
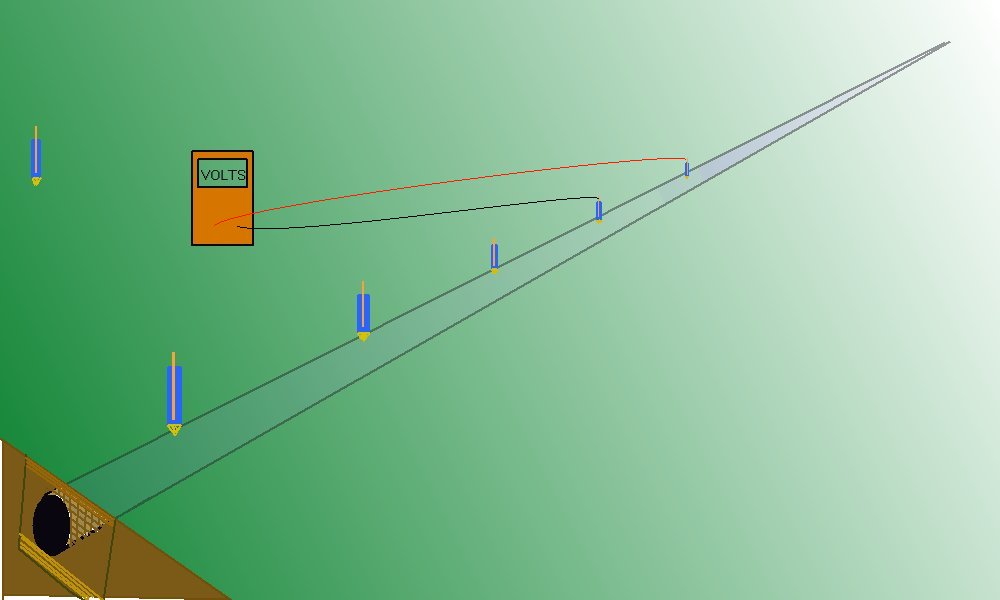
A more accurate way of using two half-cells is by placing one 'remote' from the influence of the switching and use this as a refernce potential against which you can measure a voltage
7a.3.2. The locations of highest voltage should be marked. These are normally before and after a very small voltage due to the electrodes being in positions on either side of a 'potential depression'.
7a.4.1 At such positions the operator can 'feel' around and identify the exact location of the peak potential. This should be pegged or sprayed for later examination.7a.4.2. The 'half-cells' should be stepped across the the pipeline route to confirm the exact position of the highest ground potential. These 'transverse' readings should extend as far as possible, or from "remote" to "remote".
INTERPRETATION
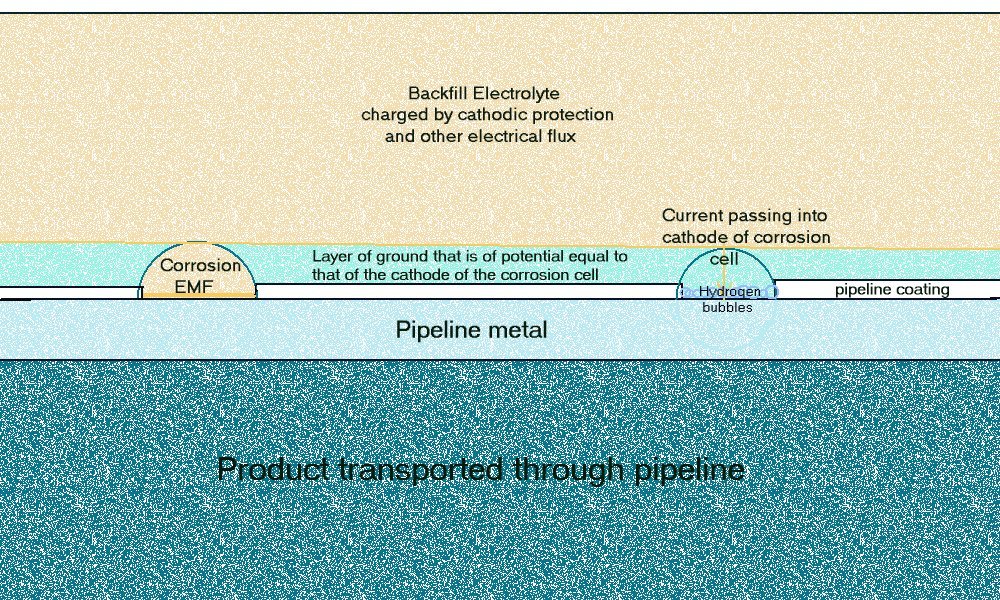
The largest voltages are obtained where the potential gradient is caused by the CP current returning to the pipeline. It follows that the marked locations are over coating faults which allow contact between the backfill and the pipe metal.
It has been found that transverse readings can indicate the severity of the coating fault and help to eliminate errors caused by other electrical flux.
In the mid 1980's I held a Cathodic Protection Course for Graduate Corrosion Engineers during which the students were required to carry out two-half-cell techniques and later these same students were given the opportunity to carry out field work on pipelines owned by the Severn and Trent Water Authority.
By the 1990's DCVG had been established as a way to locate coating faults on buried pipelines and a form of DCVG had been adopted for offshore inspection of submerged pipelines.
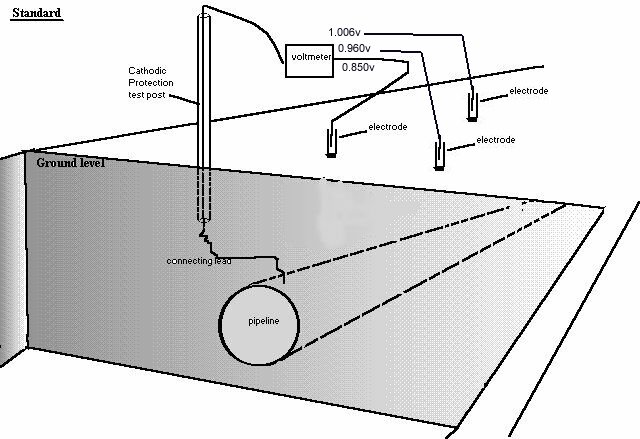
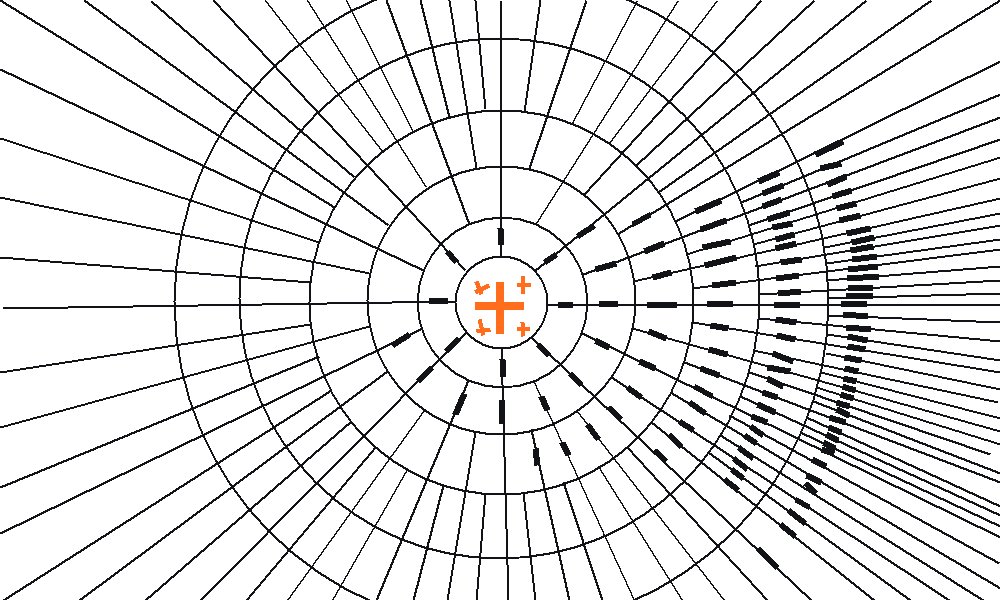
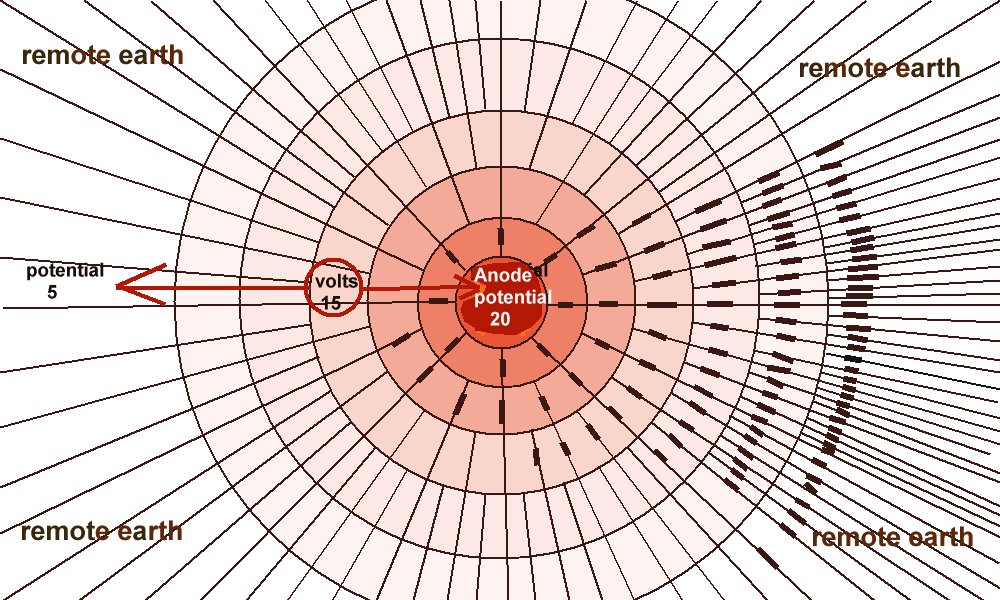
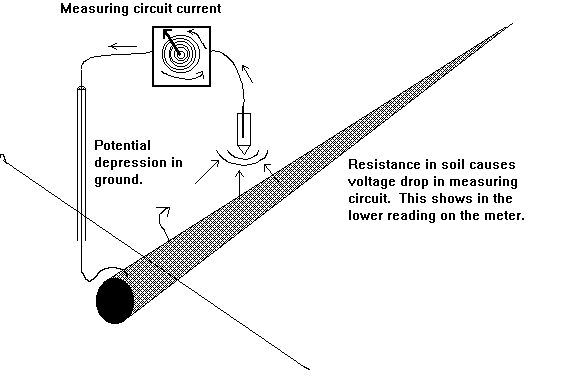
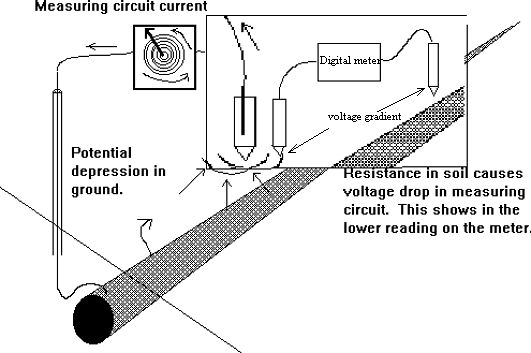
This is a typical representation of the process known as transverse readings that are recommended to identify the epicentre of the effects of a coating fault.
Unfortunately the value of these surveys were grossly exagerated and those providing such services were making claims that could not be substantiated by fact.
It is essential that users of DCVG realise that we are only taking voltages and that we are measuring these voltages between the ground potential 'shells' caused by the impressed current passing from remote earth into the pipeline metal through a coating fault.
If the ground resistance is very low then the 'shells' might not break the surface of the ground above the pipe.
Testing that the 'signal' (difference between on and off) at the test post furthest from the anode bed is at least 100 mV, prior to locating defects, is recommended.
If there is insufficient 'signal', more than one TR may have to be interrupted (satellite interrupters will be required), the CP system will have to be turned up at the transformer rectifier.
It is sometimes suggested that a temporary CP system be installed but this proposal needs to be thoroughly investigated as it often cannot supply sufficient energy for the purpose.
The 'off' potential has no significance during this type of survey as it cannot be related to the electrical equilibrium or corrosion status of the pipeline metal.
During the 'off' period of the cycle, the corrosion current at corrosion cells is too small to be detected at the ground.
During the 'on' period, if the ground resistance is very low or insufficient cathodic protection current reaches the defects from remote earth, the 'shells' might not break the surface of the ground above the pipe.
This page is under constant review and any questions will answered with more pictures.
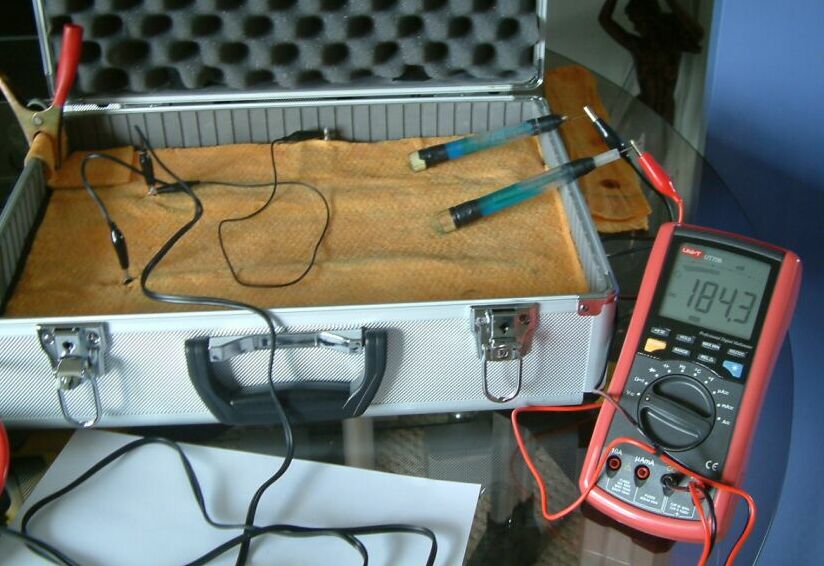
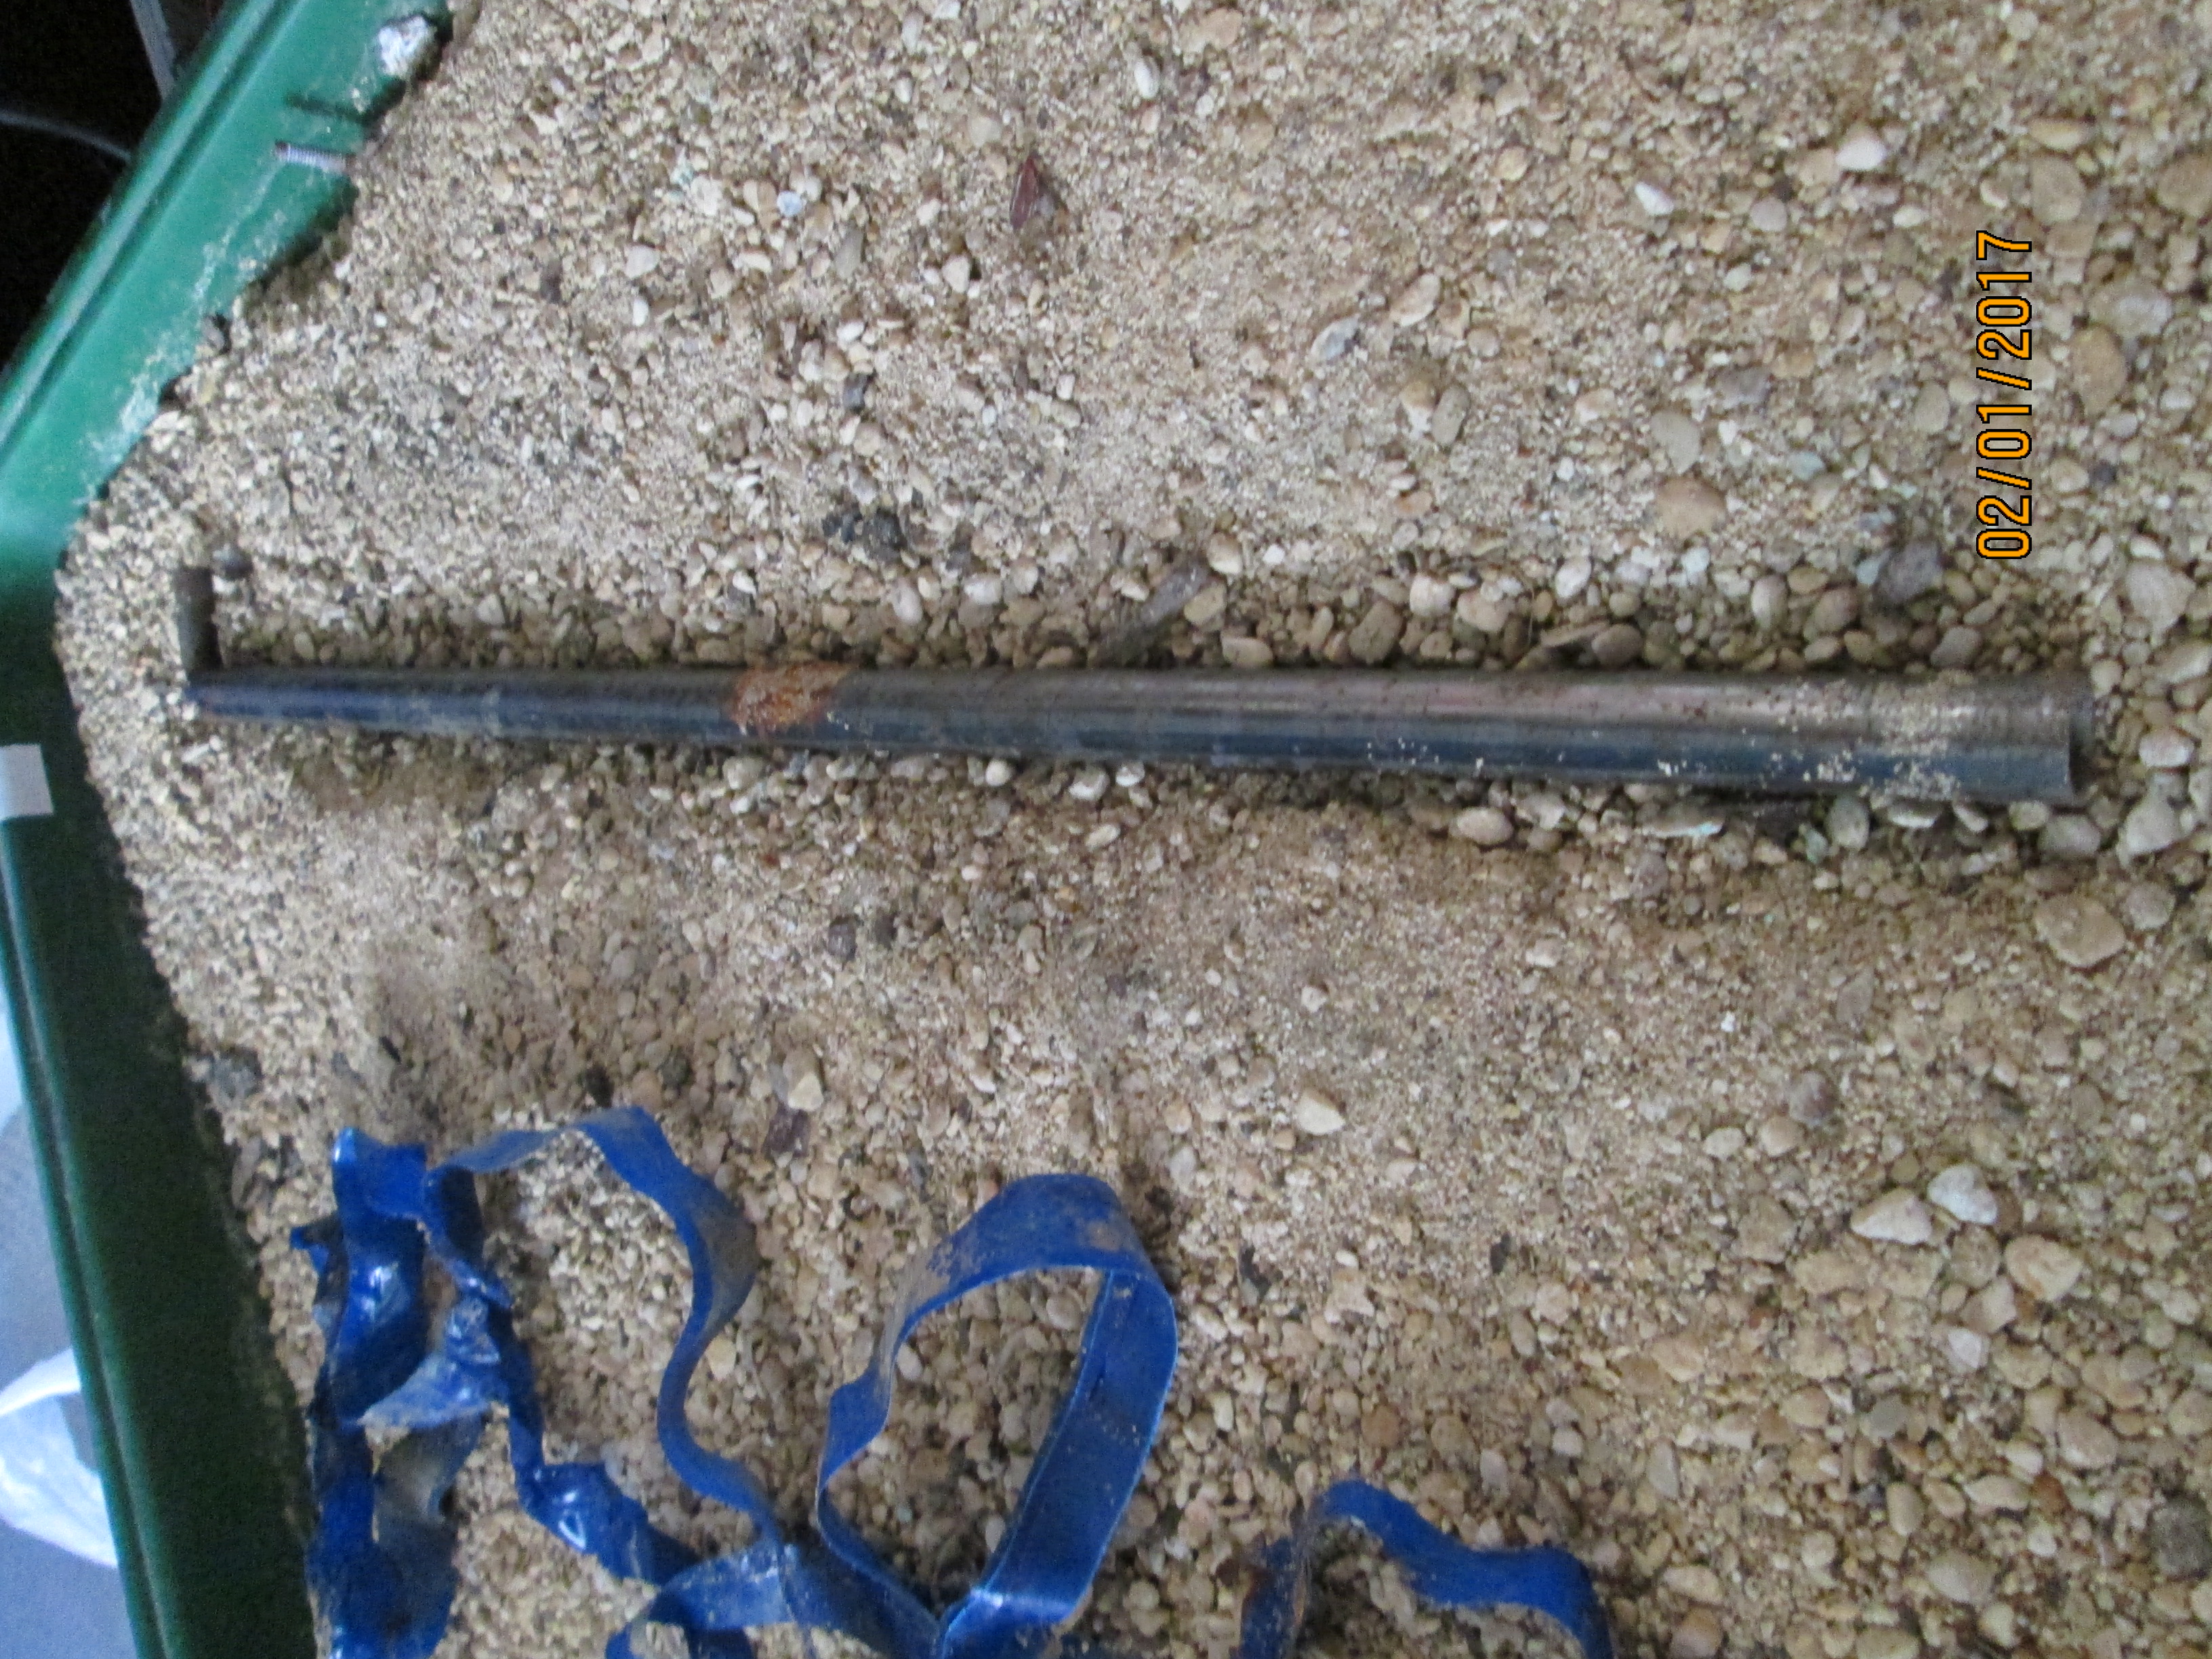
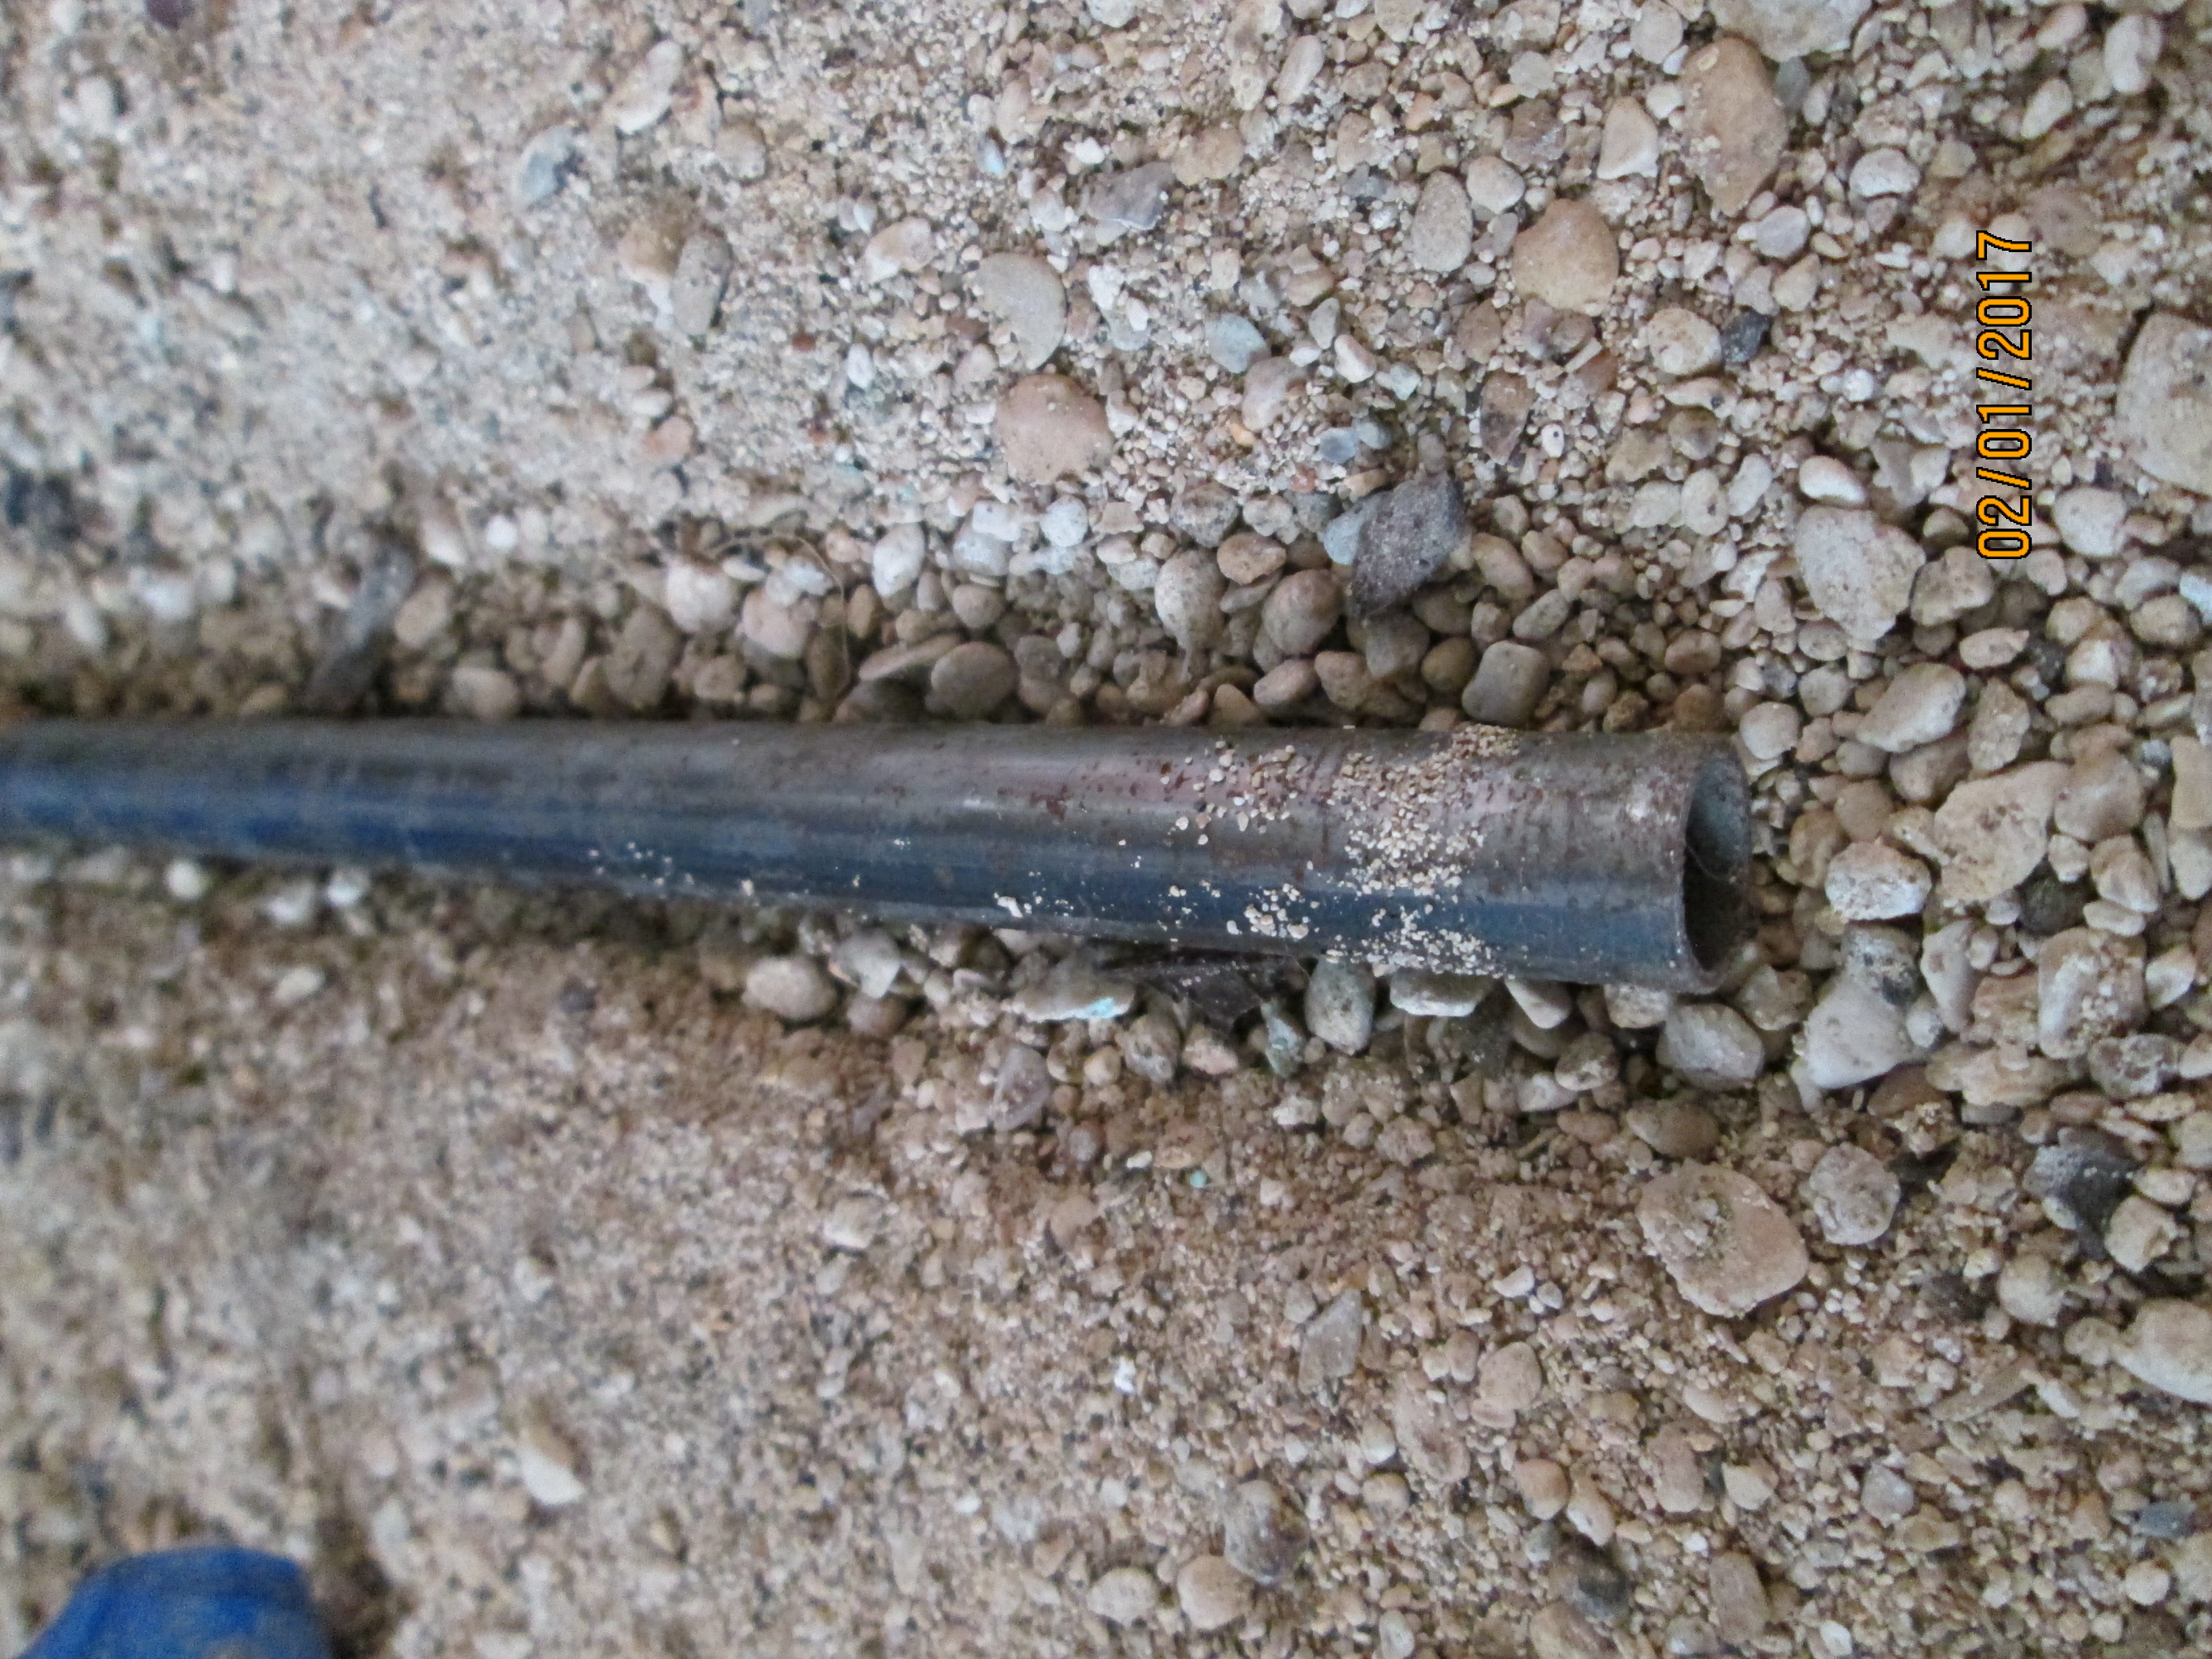
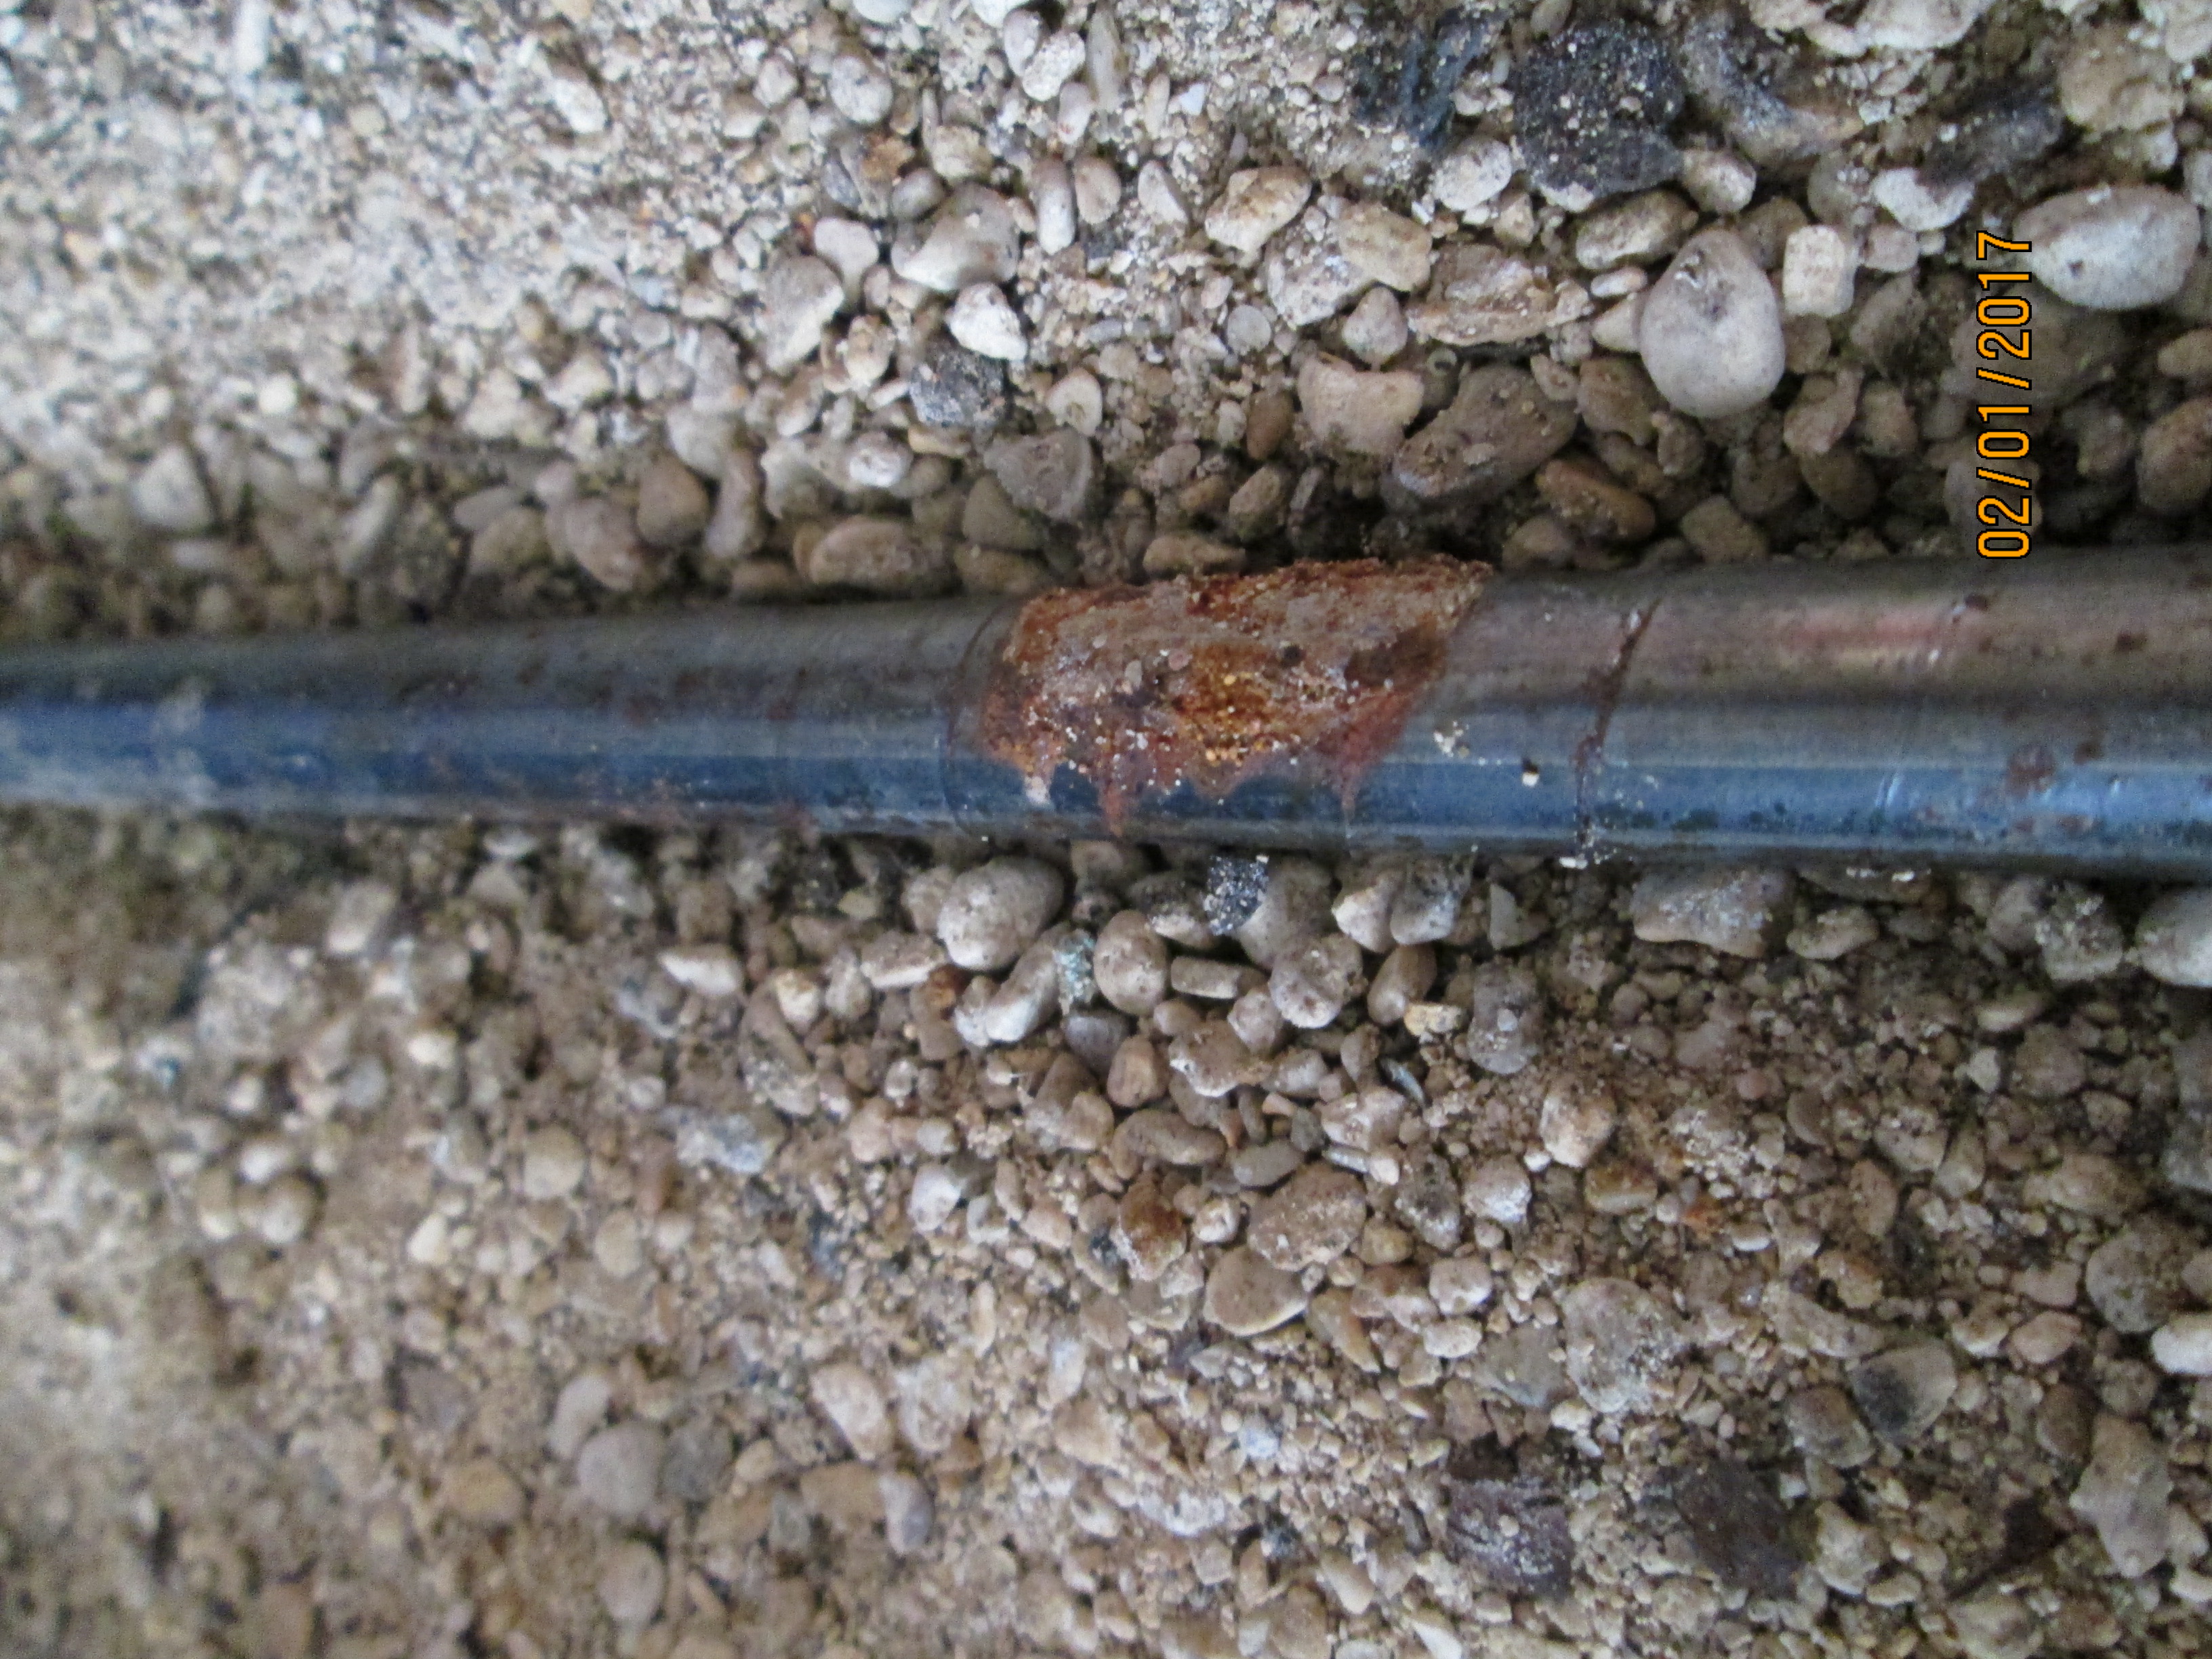
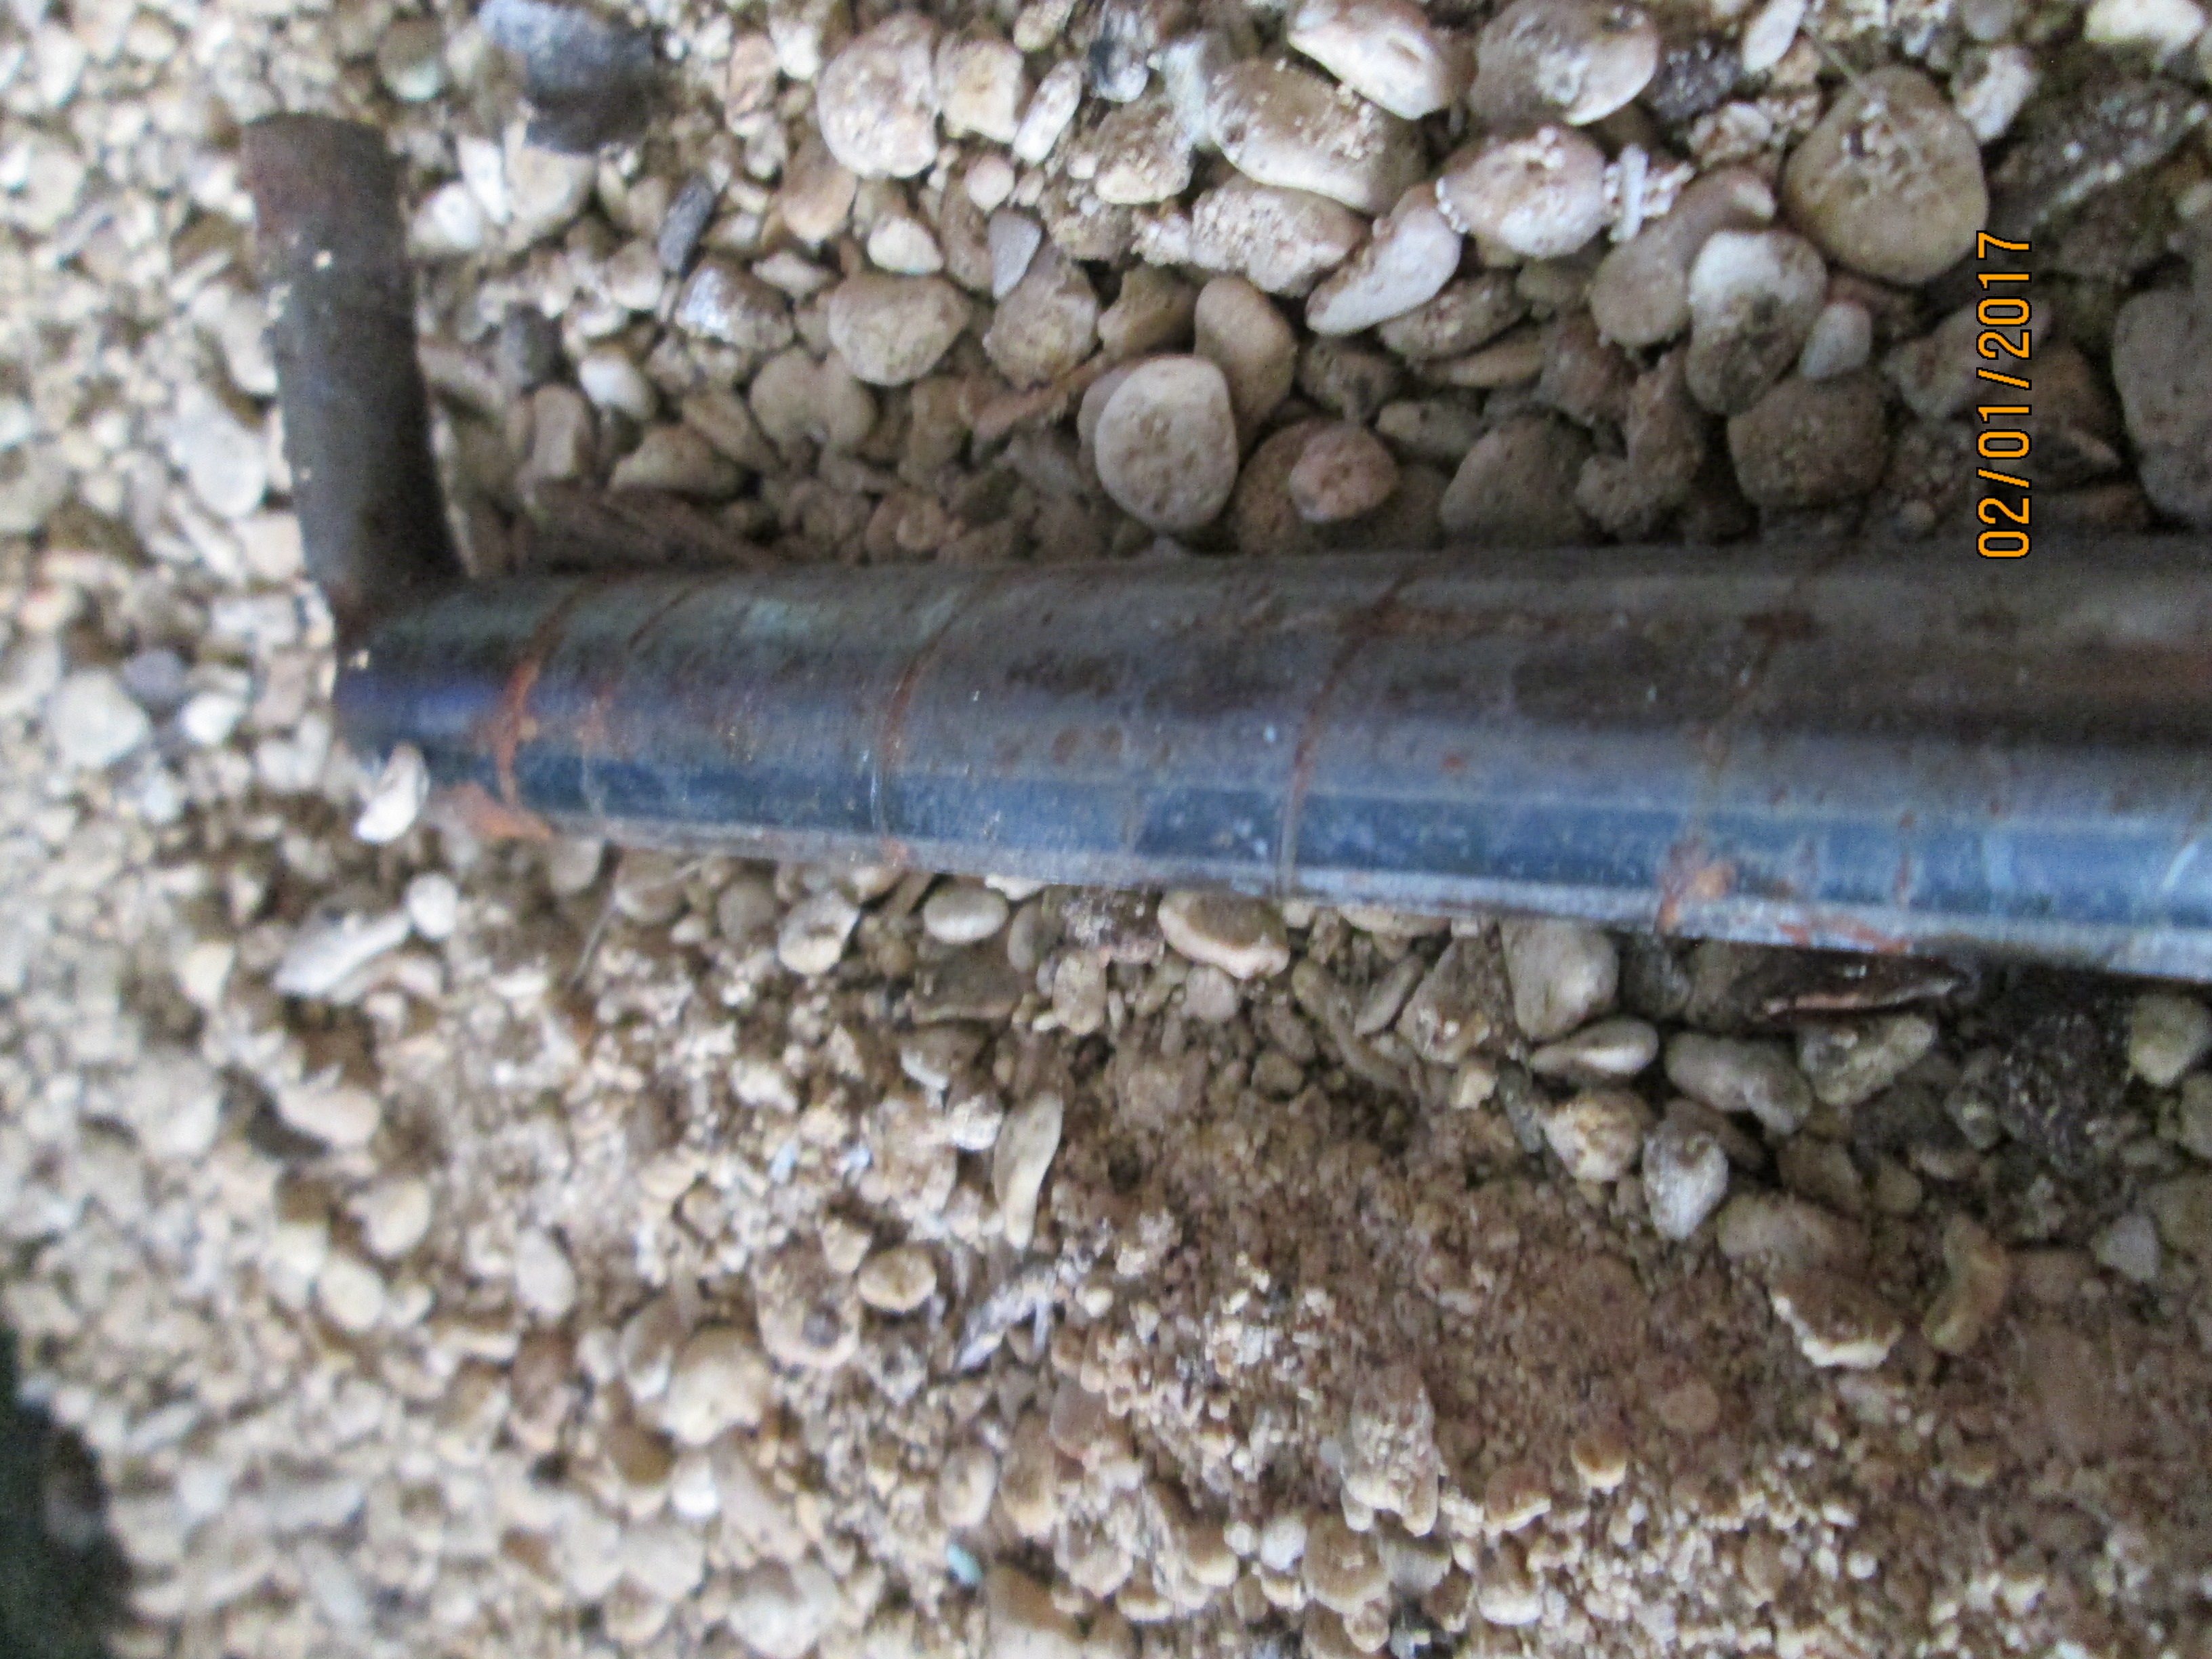
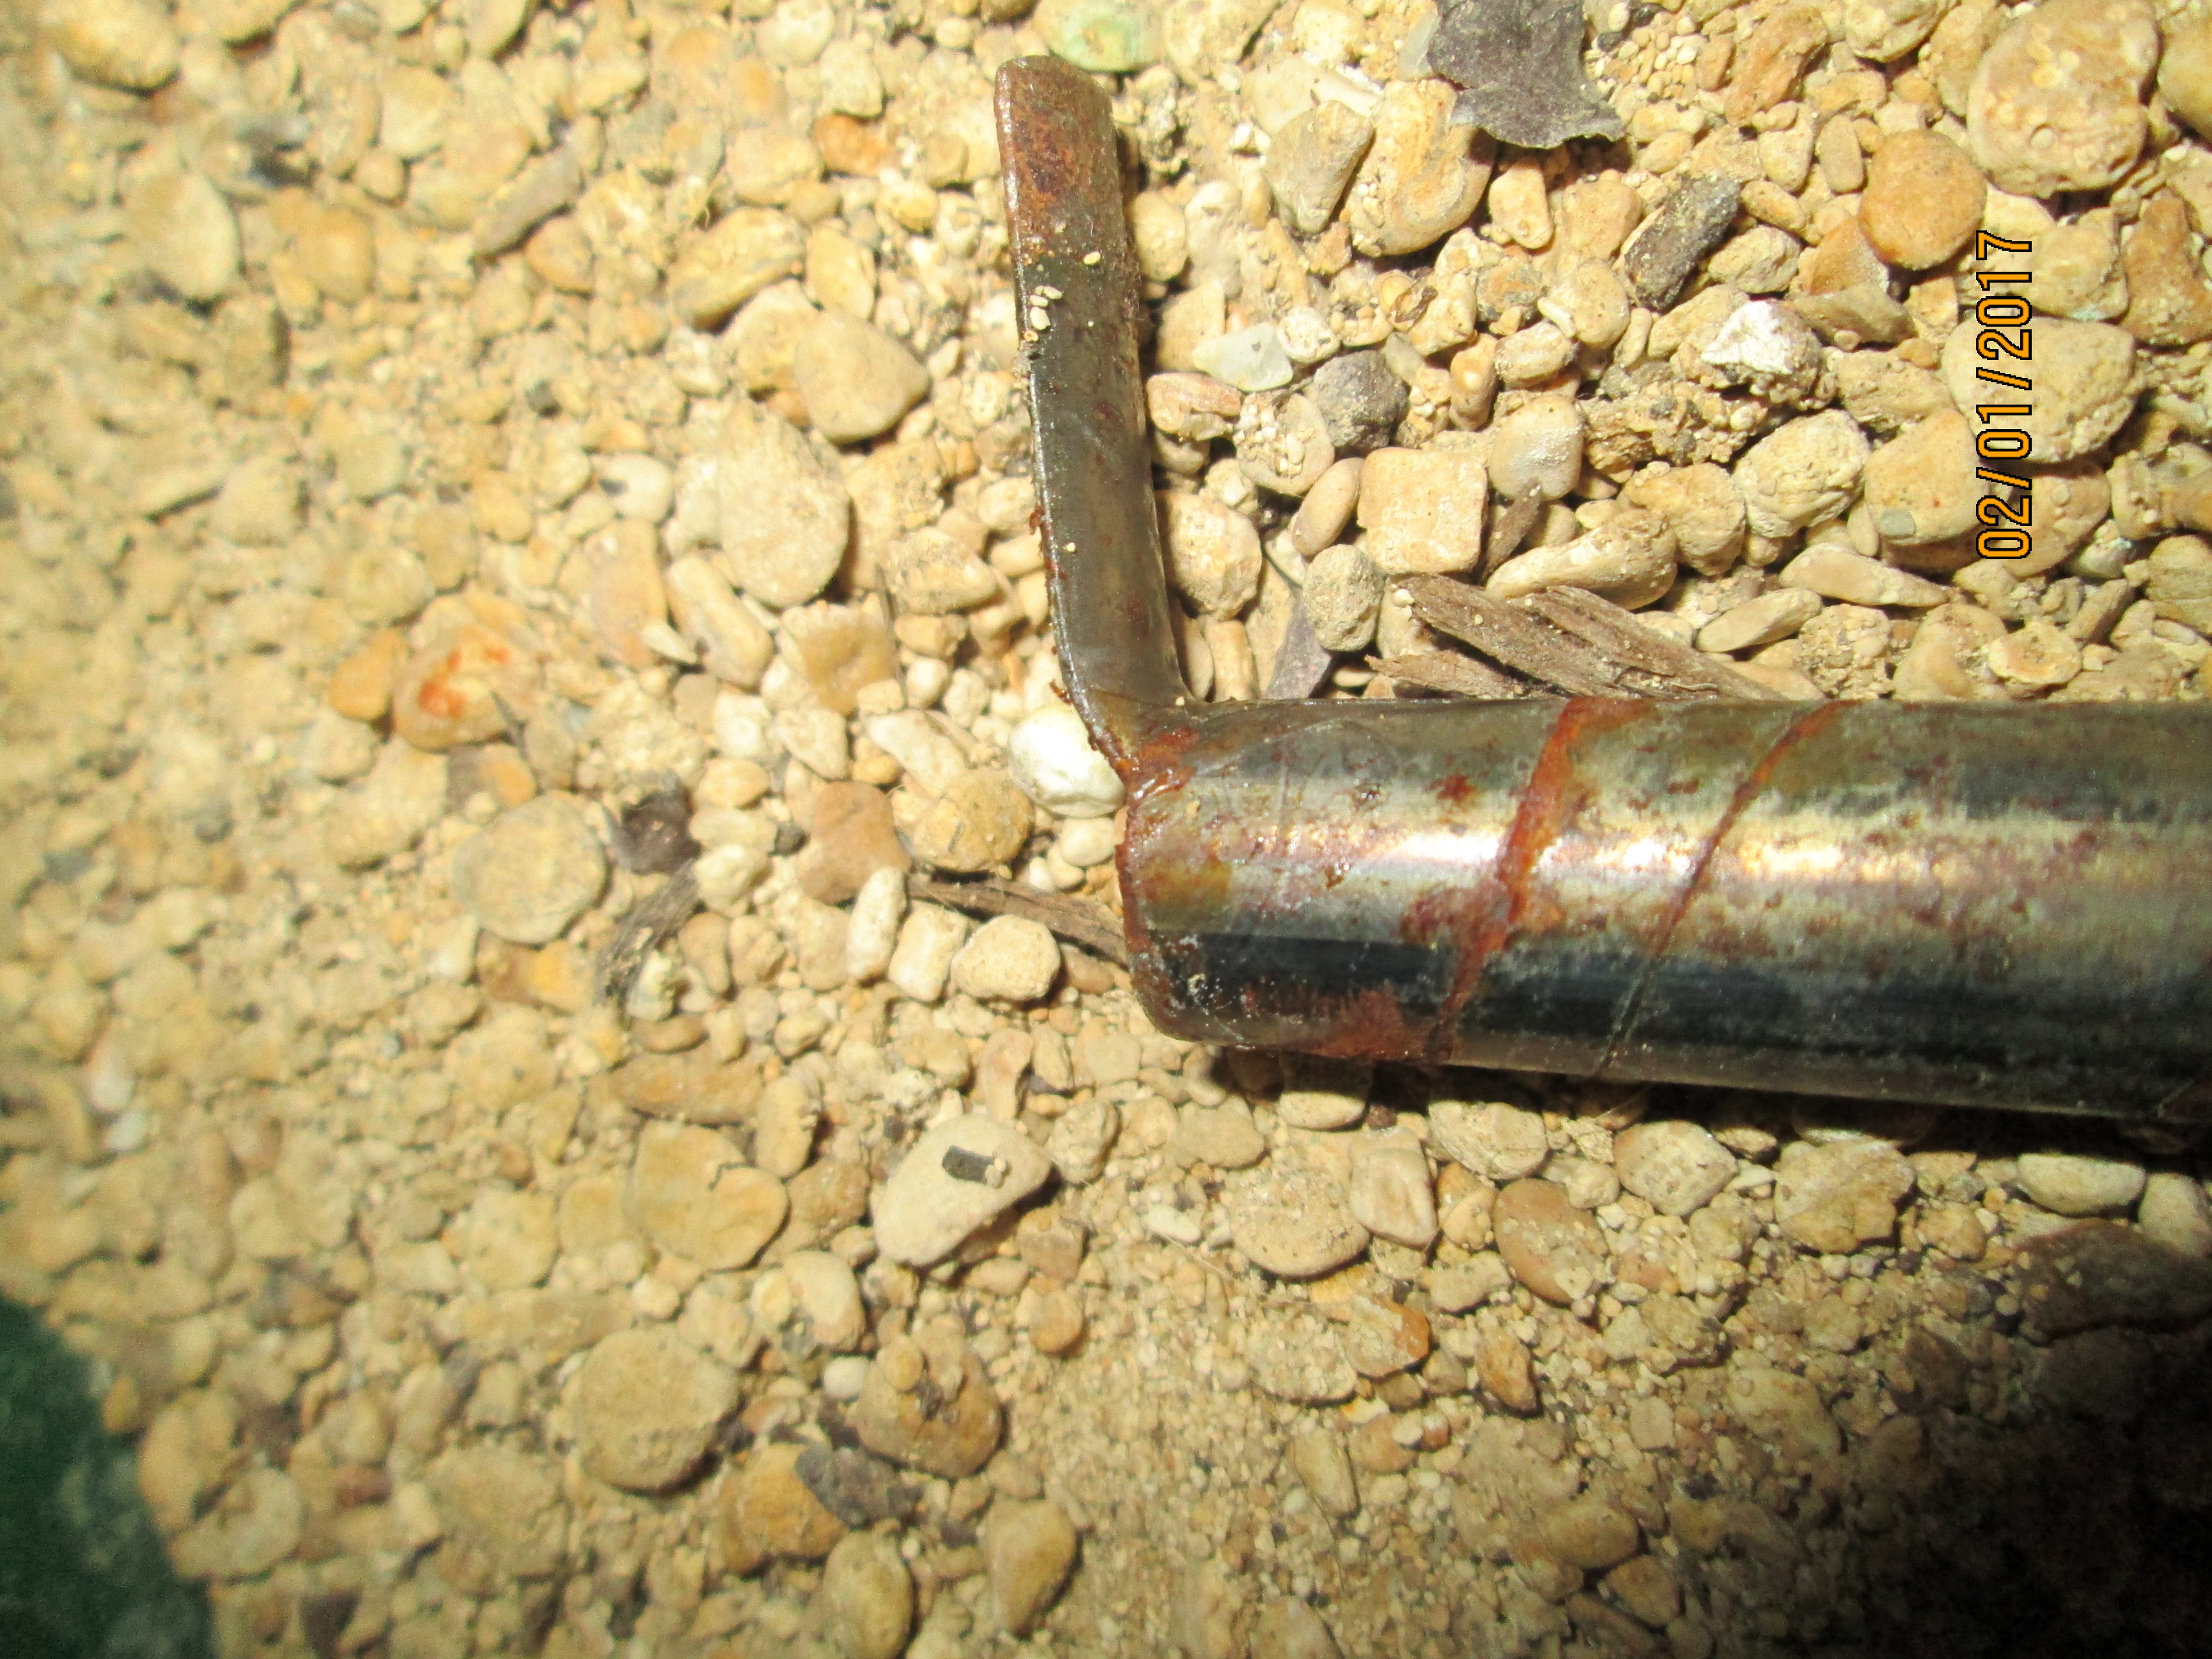
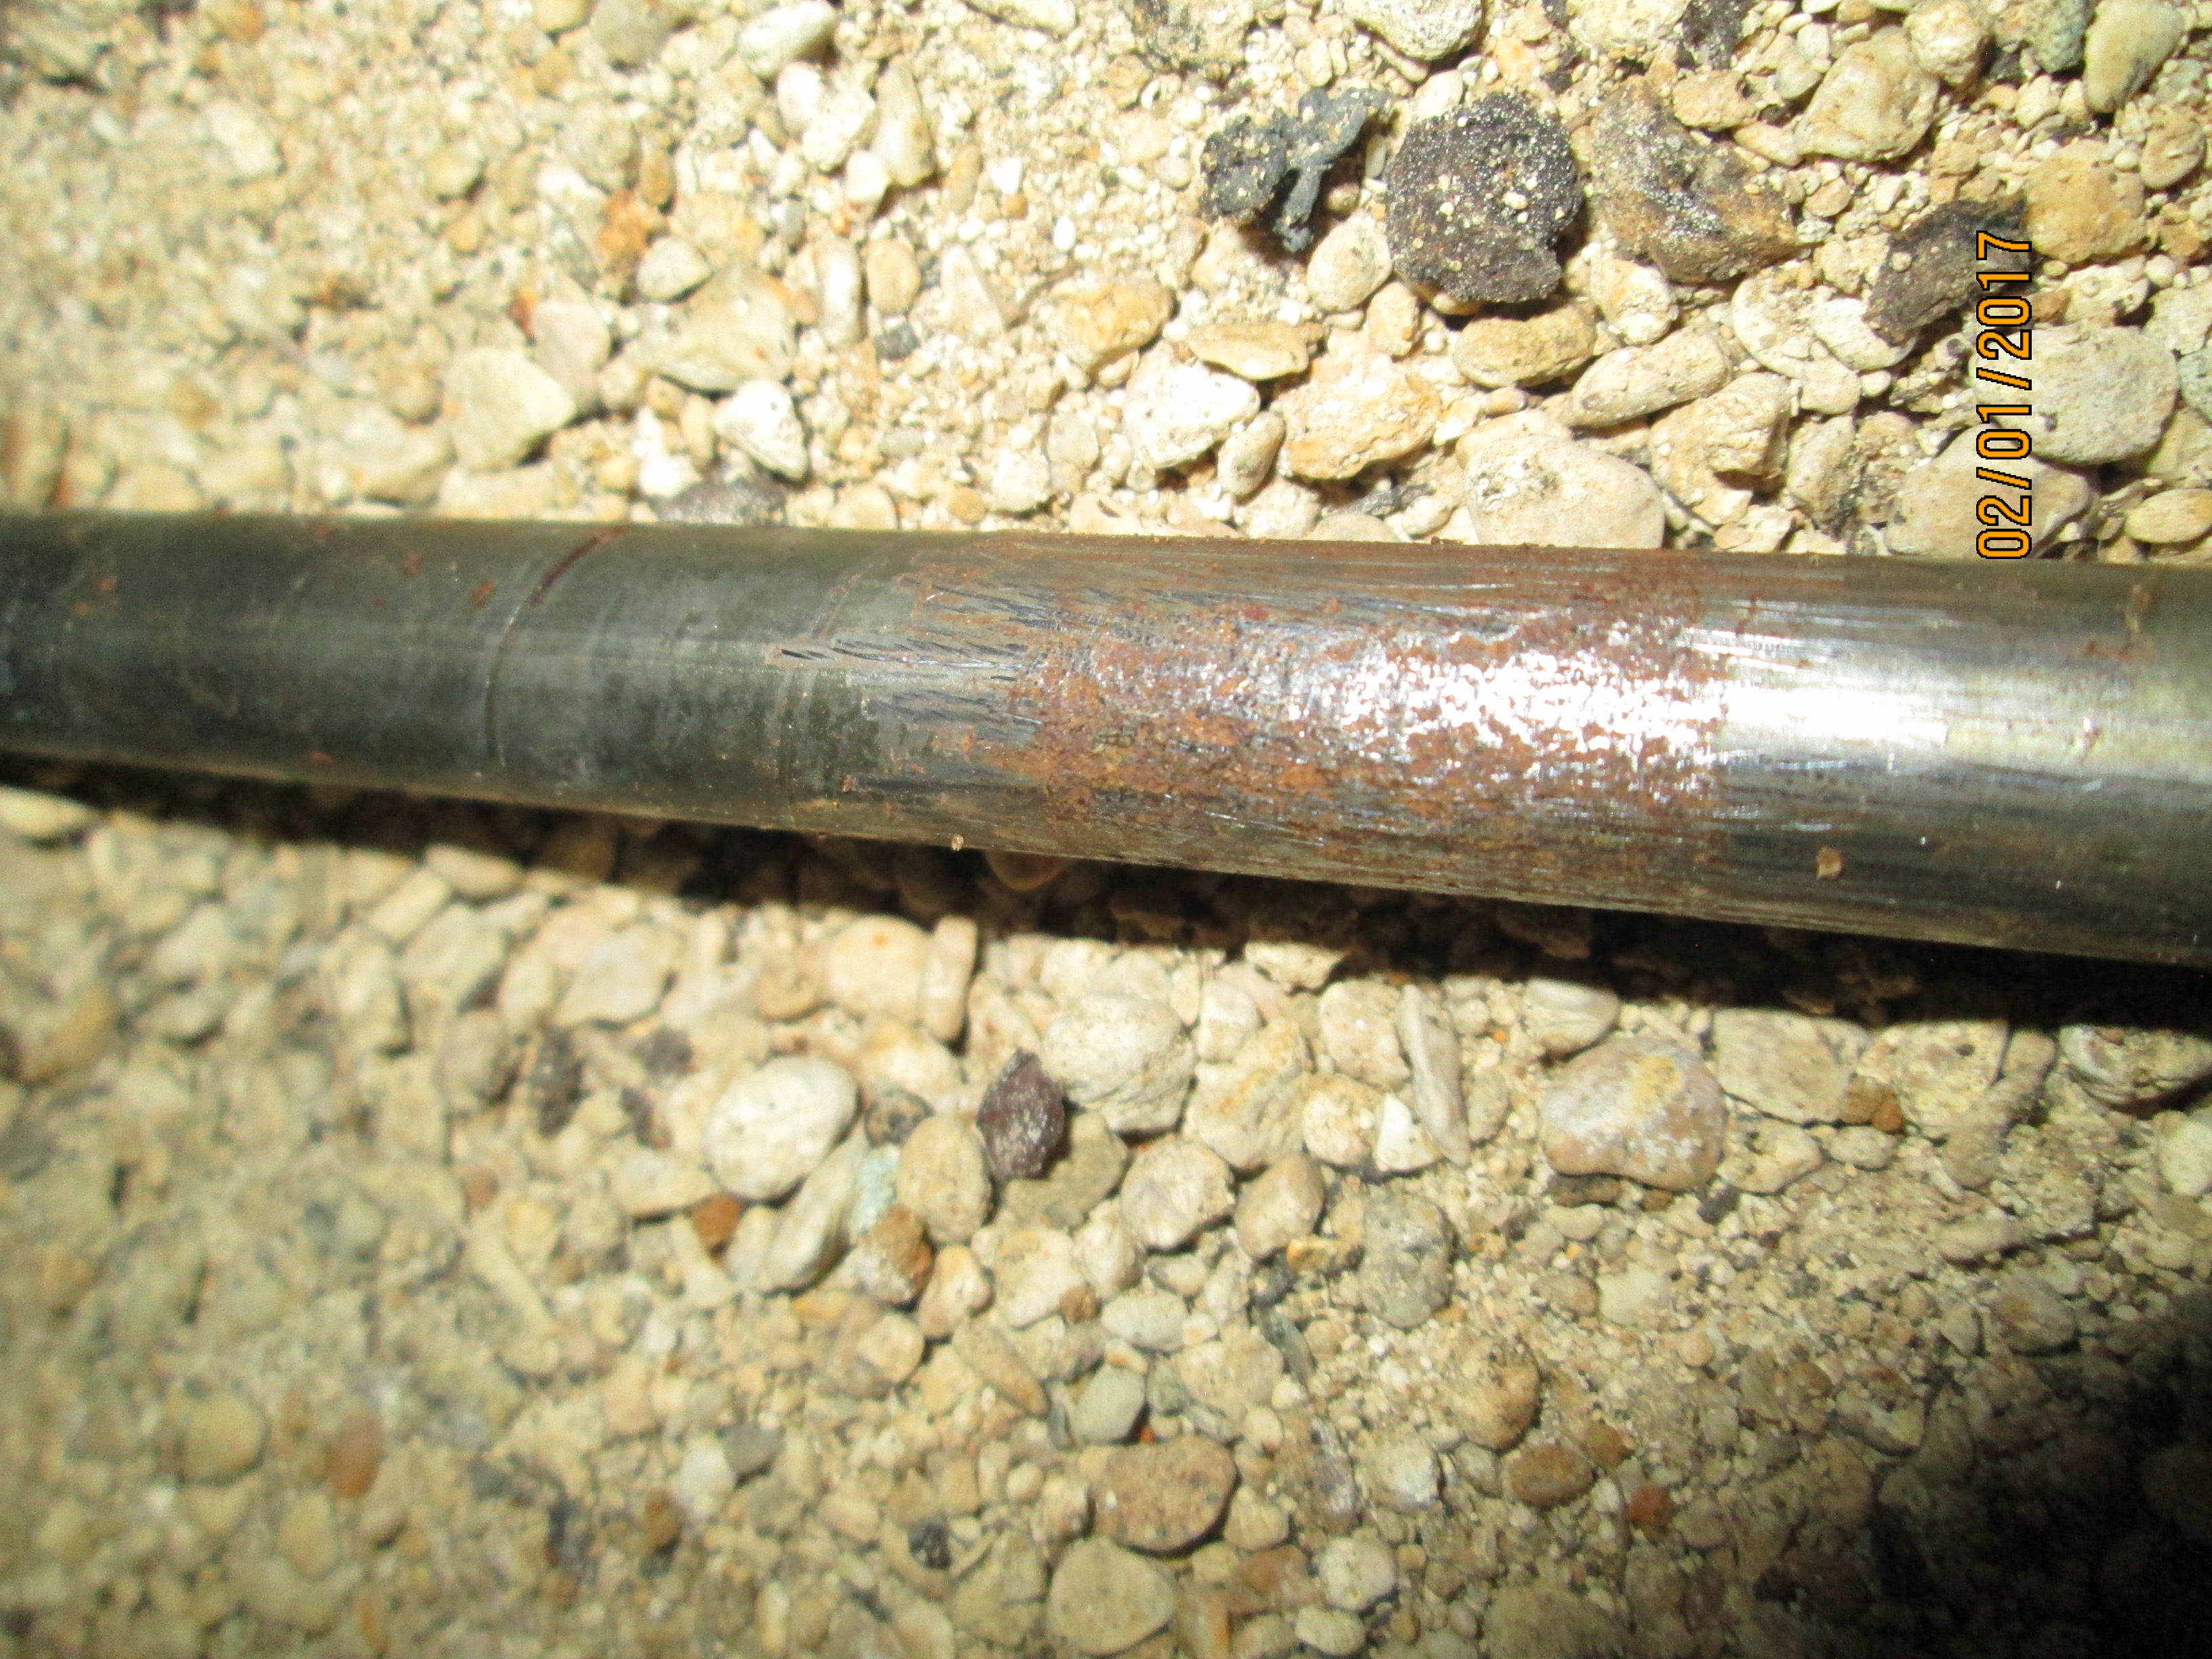
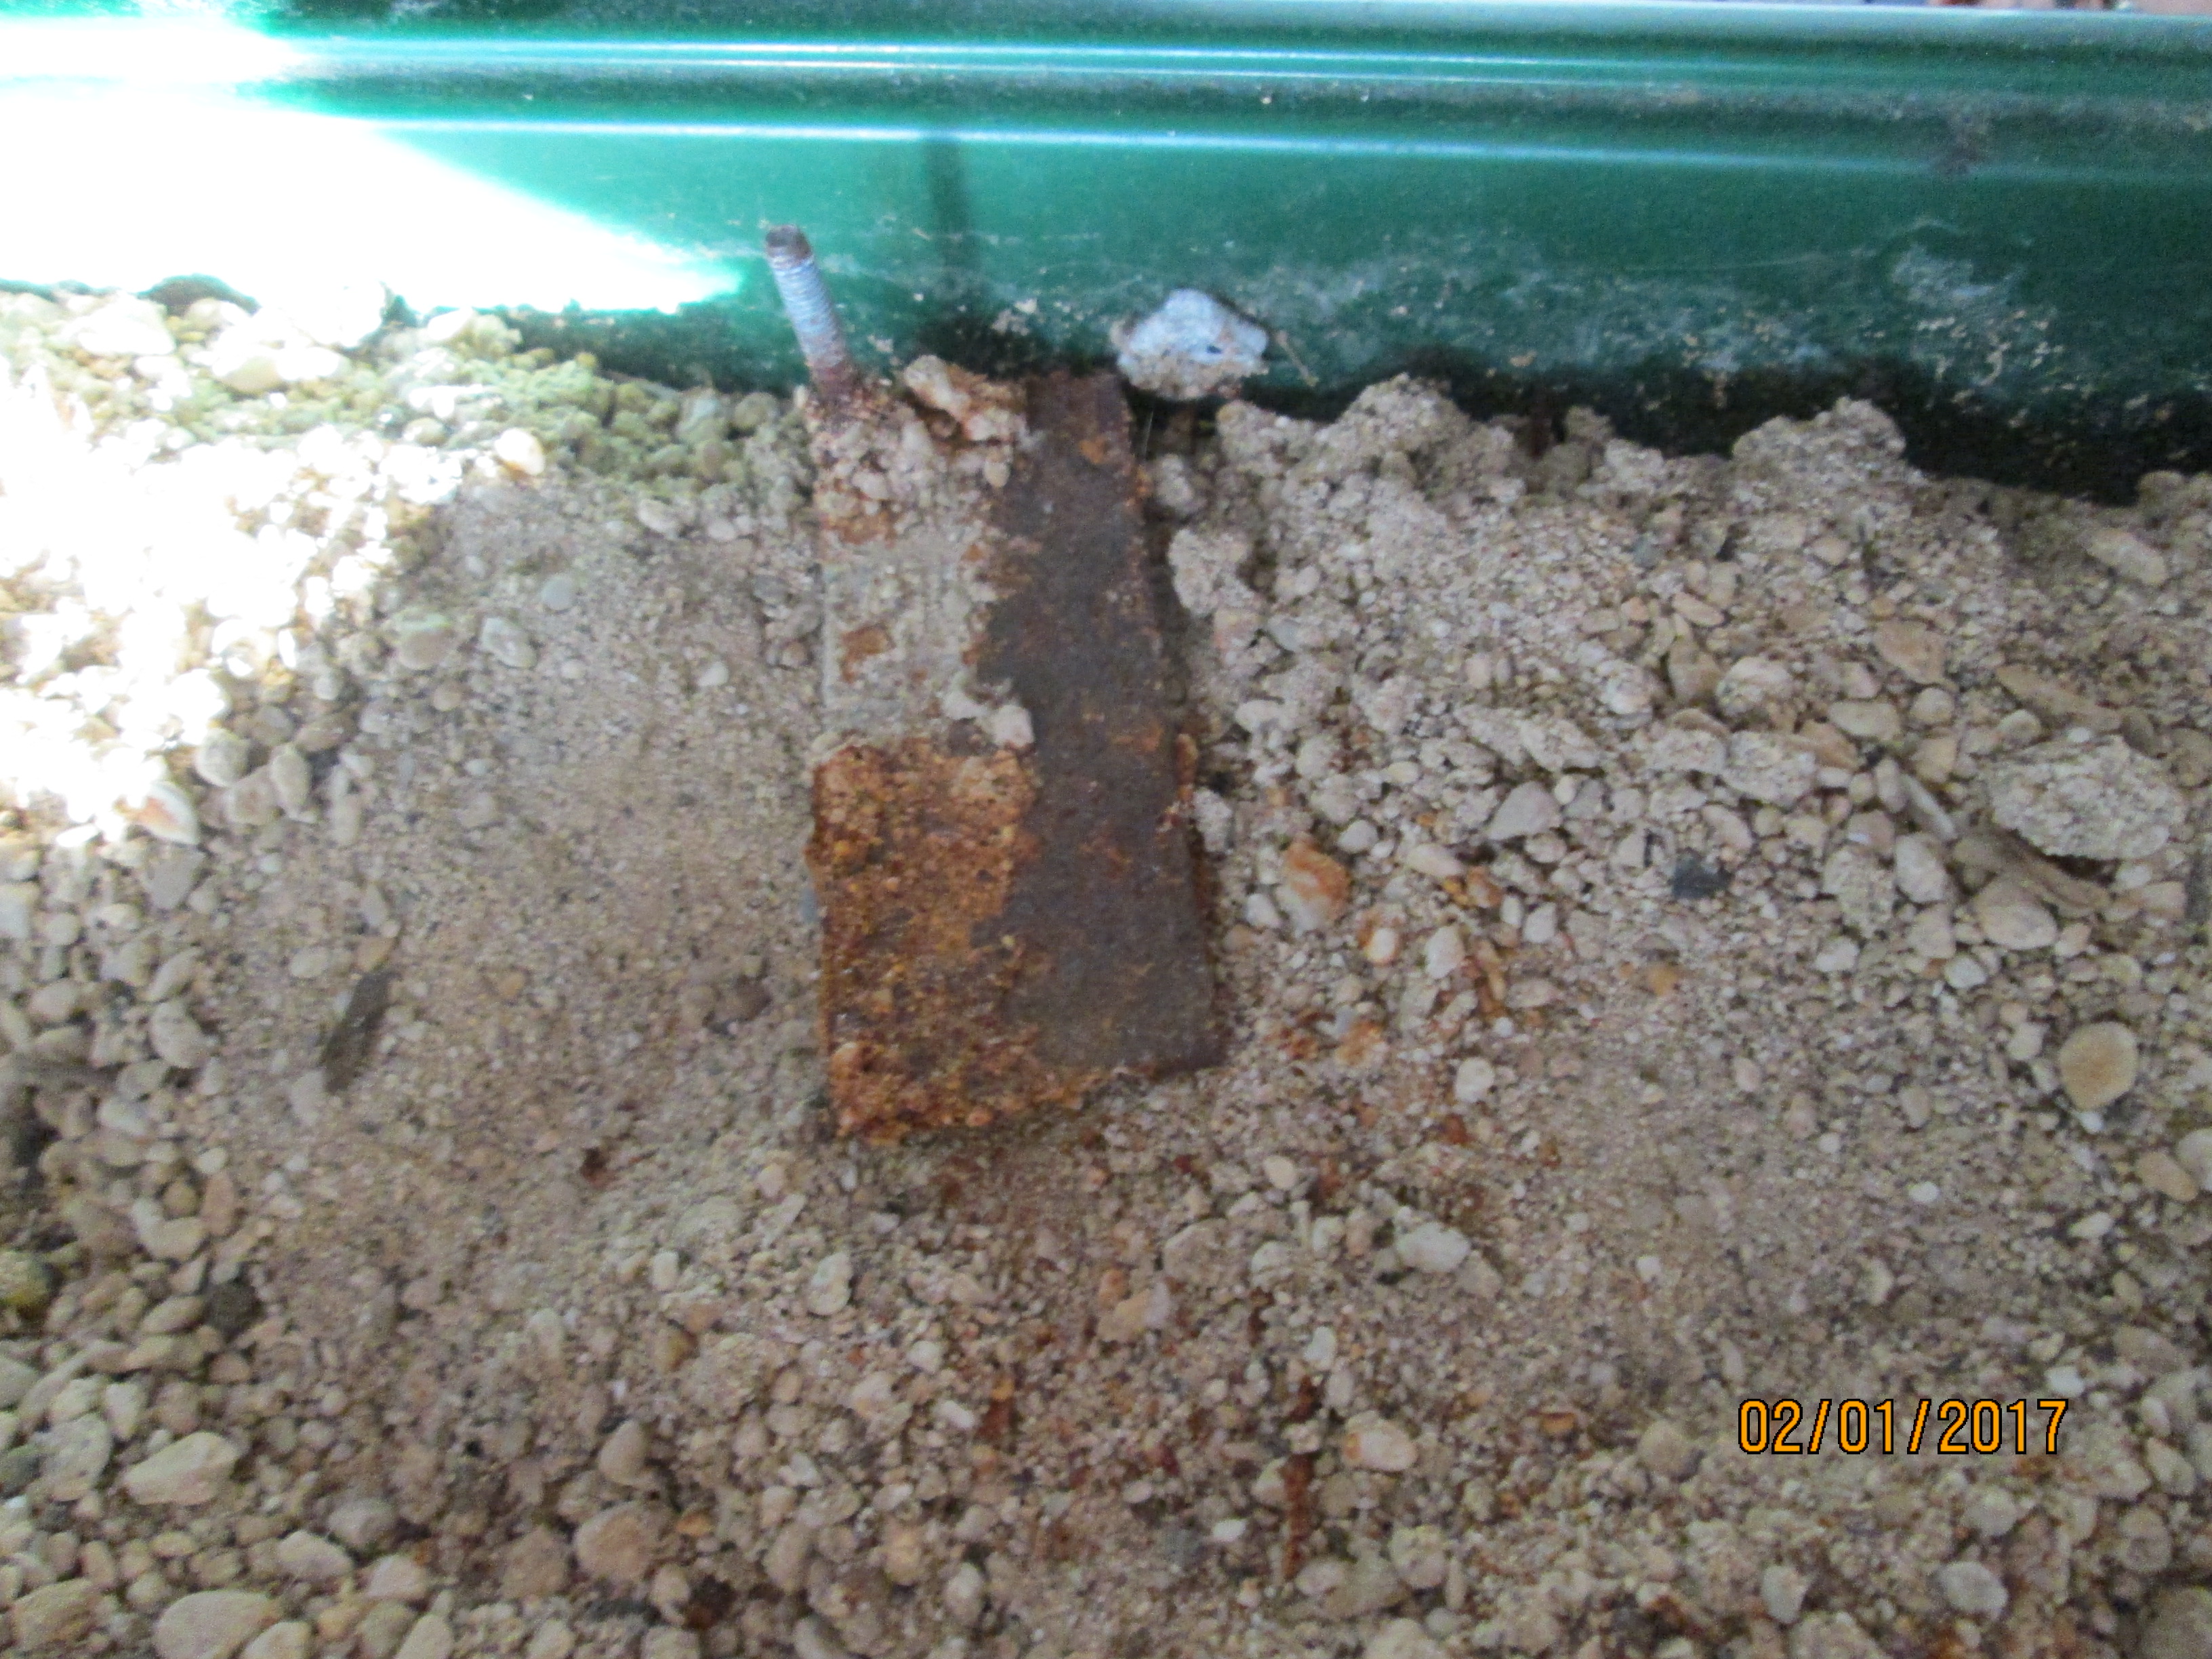
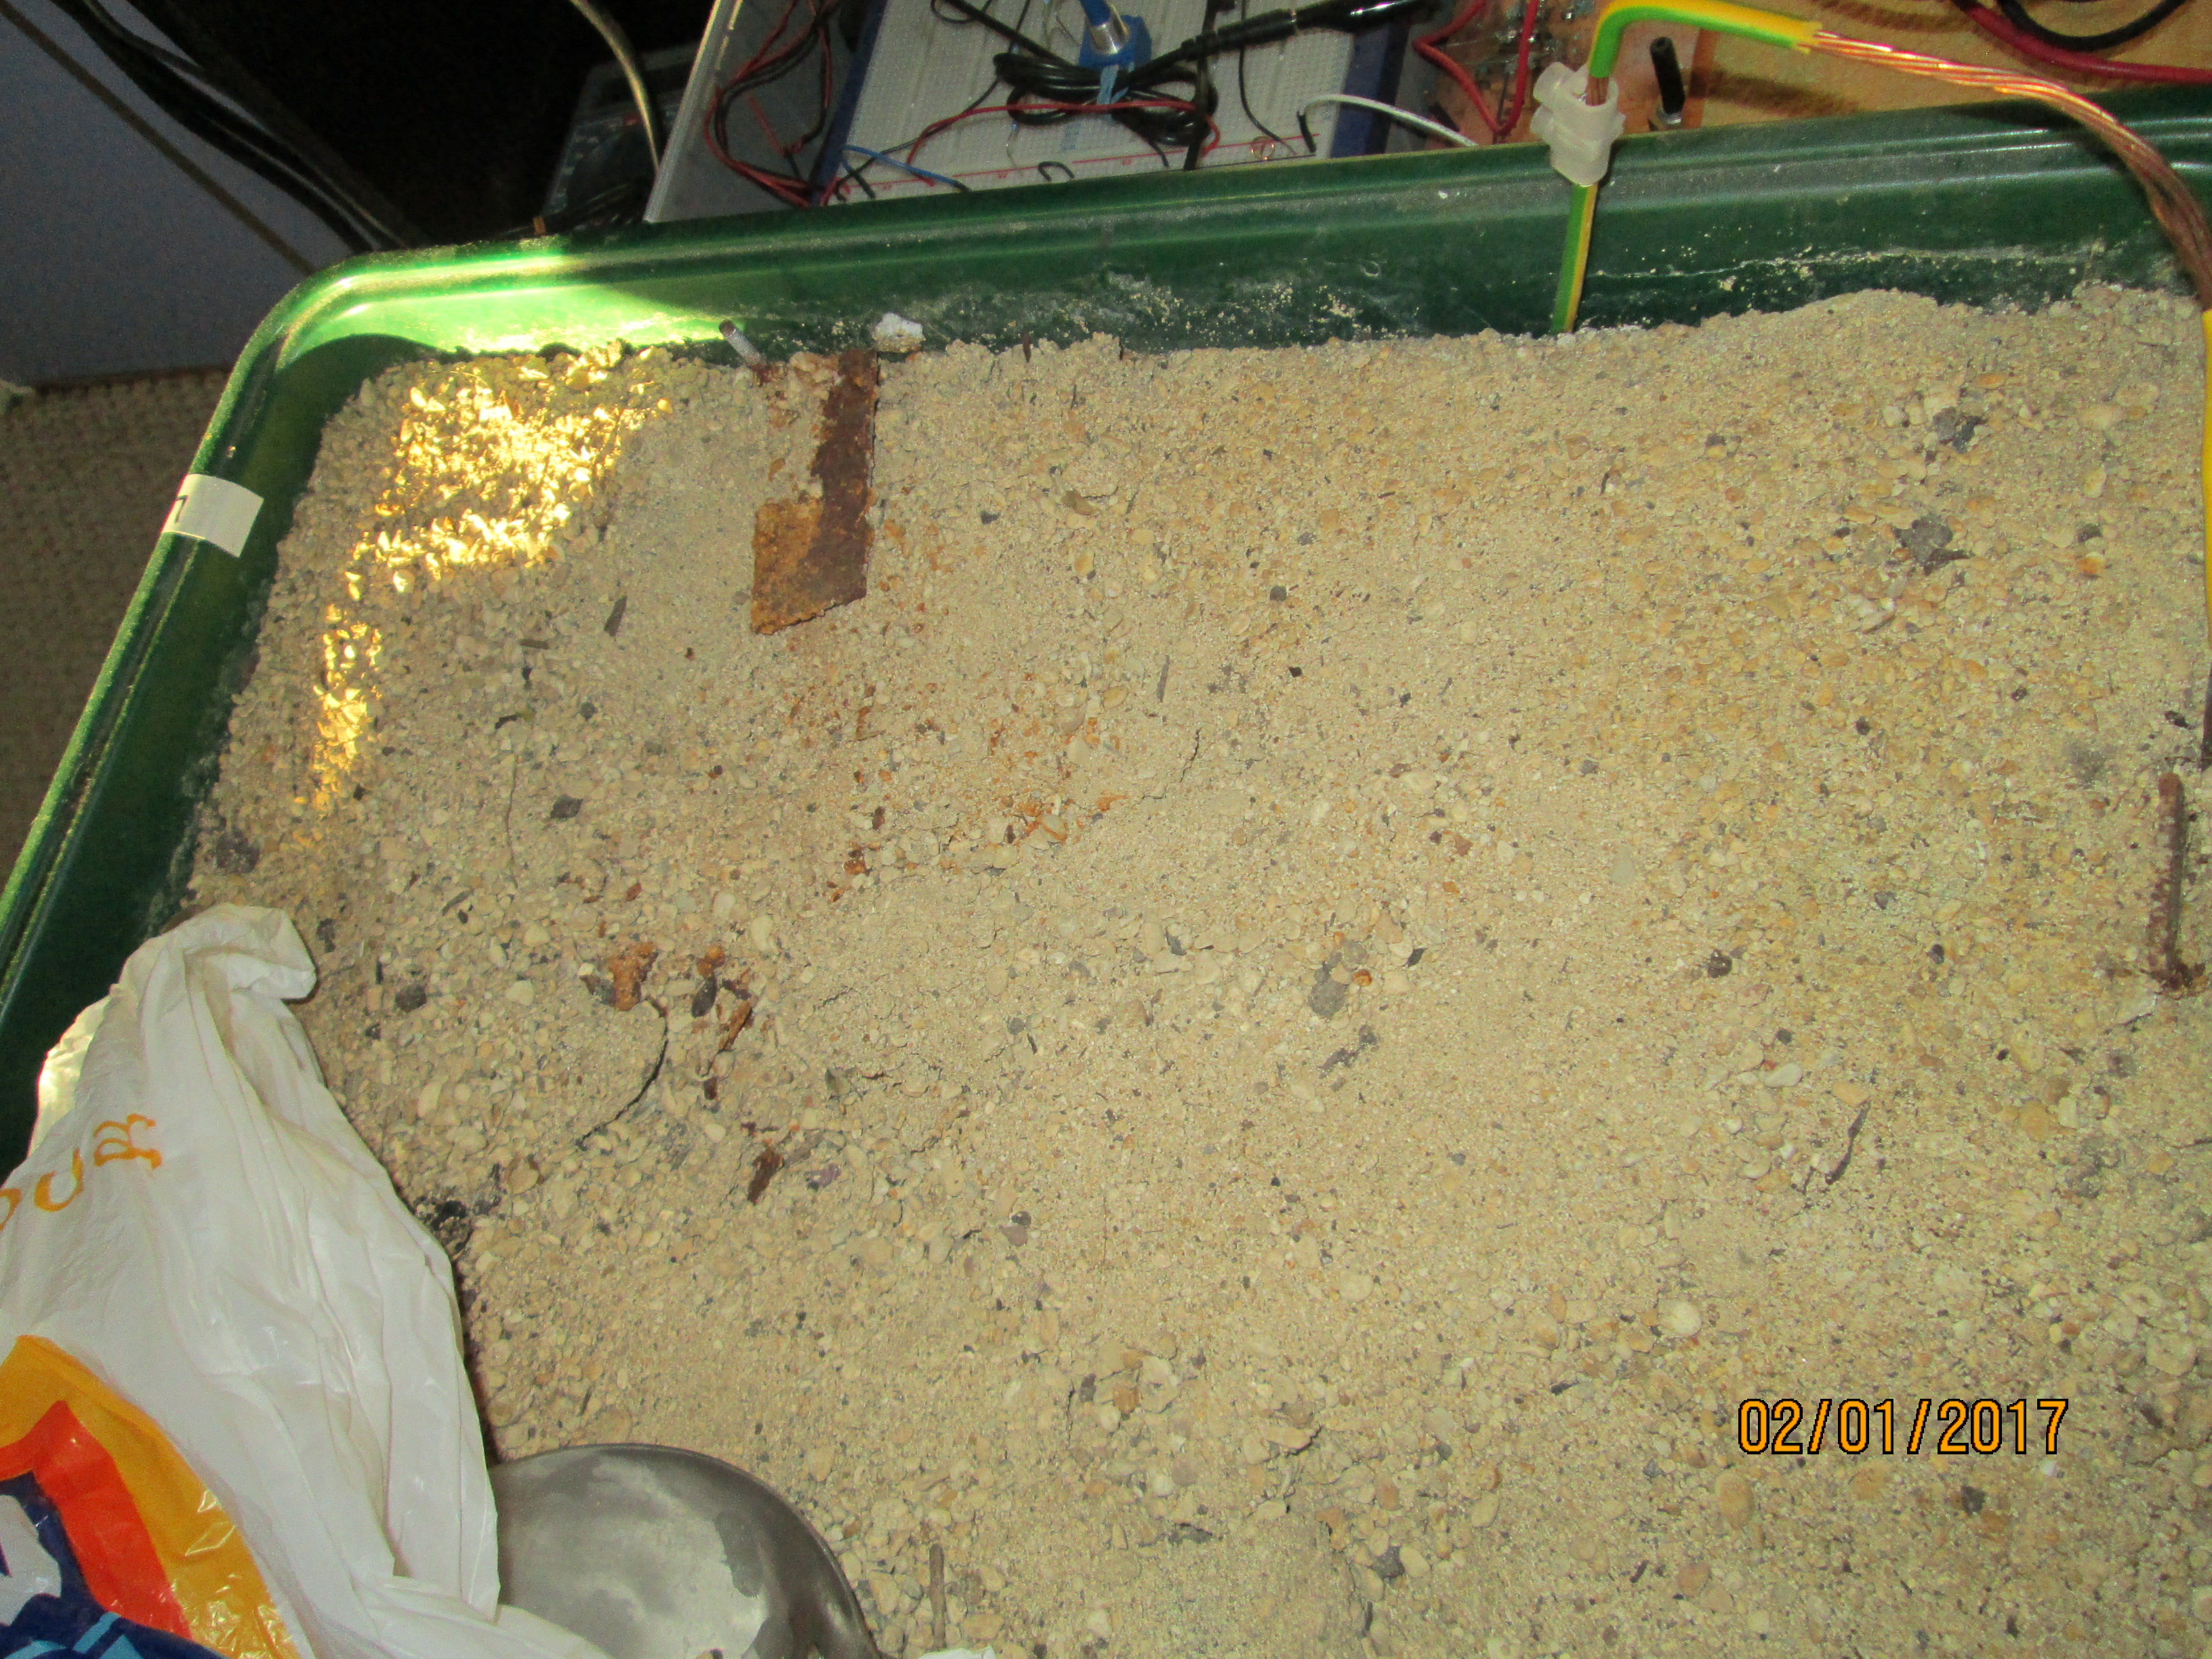
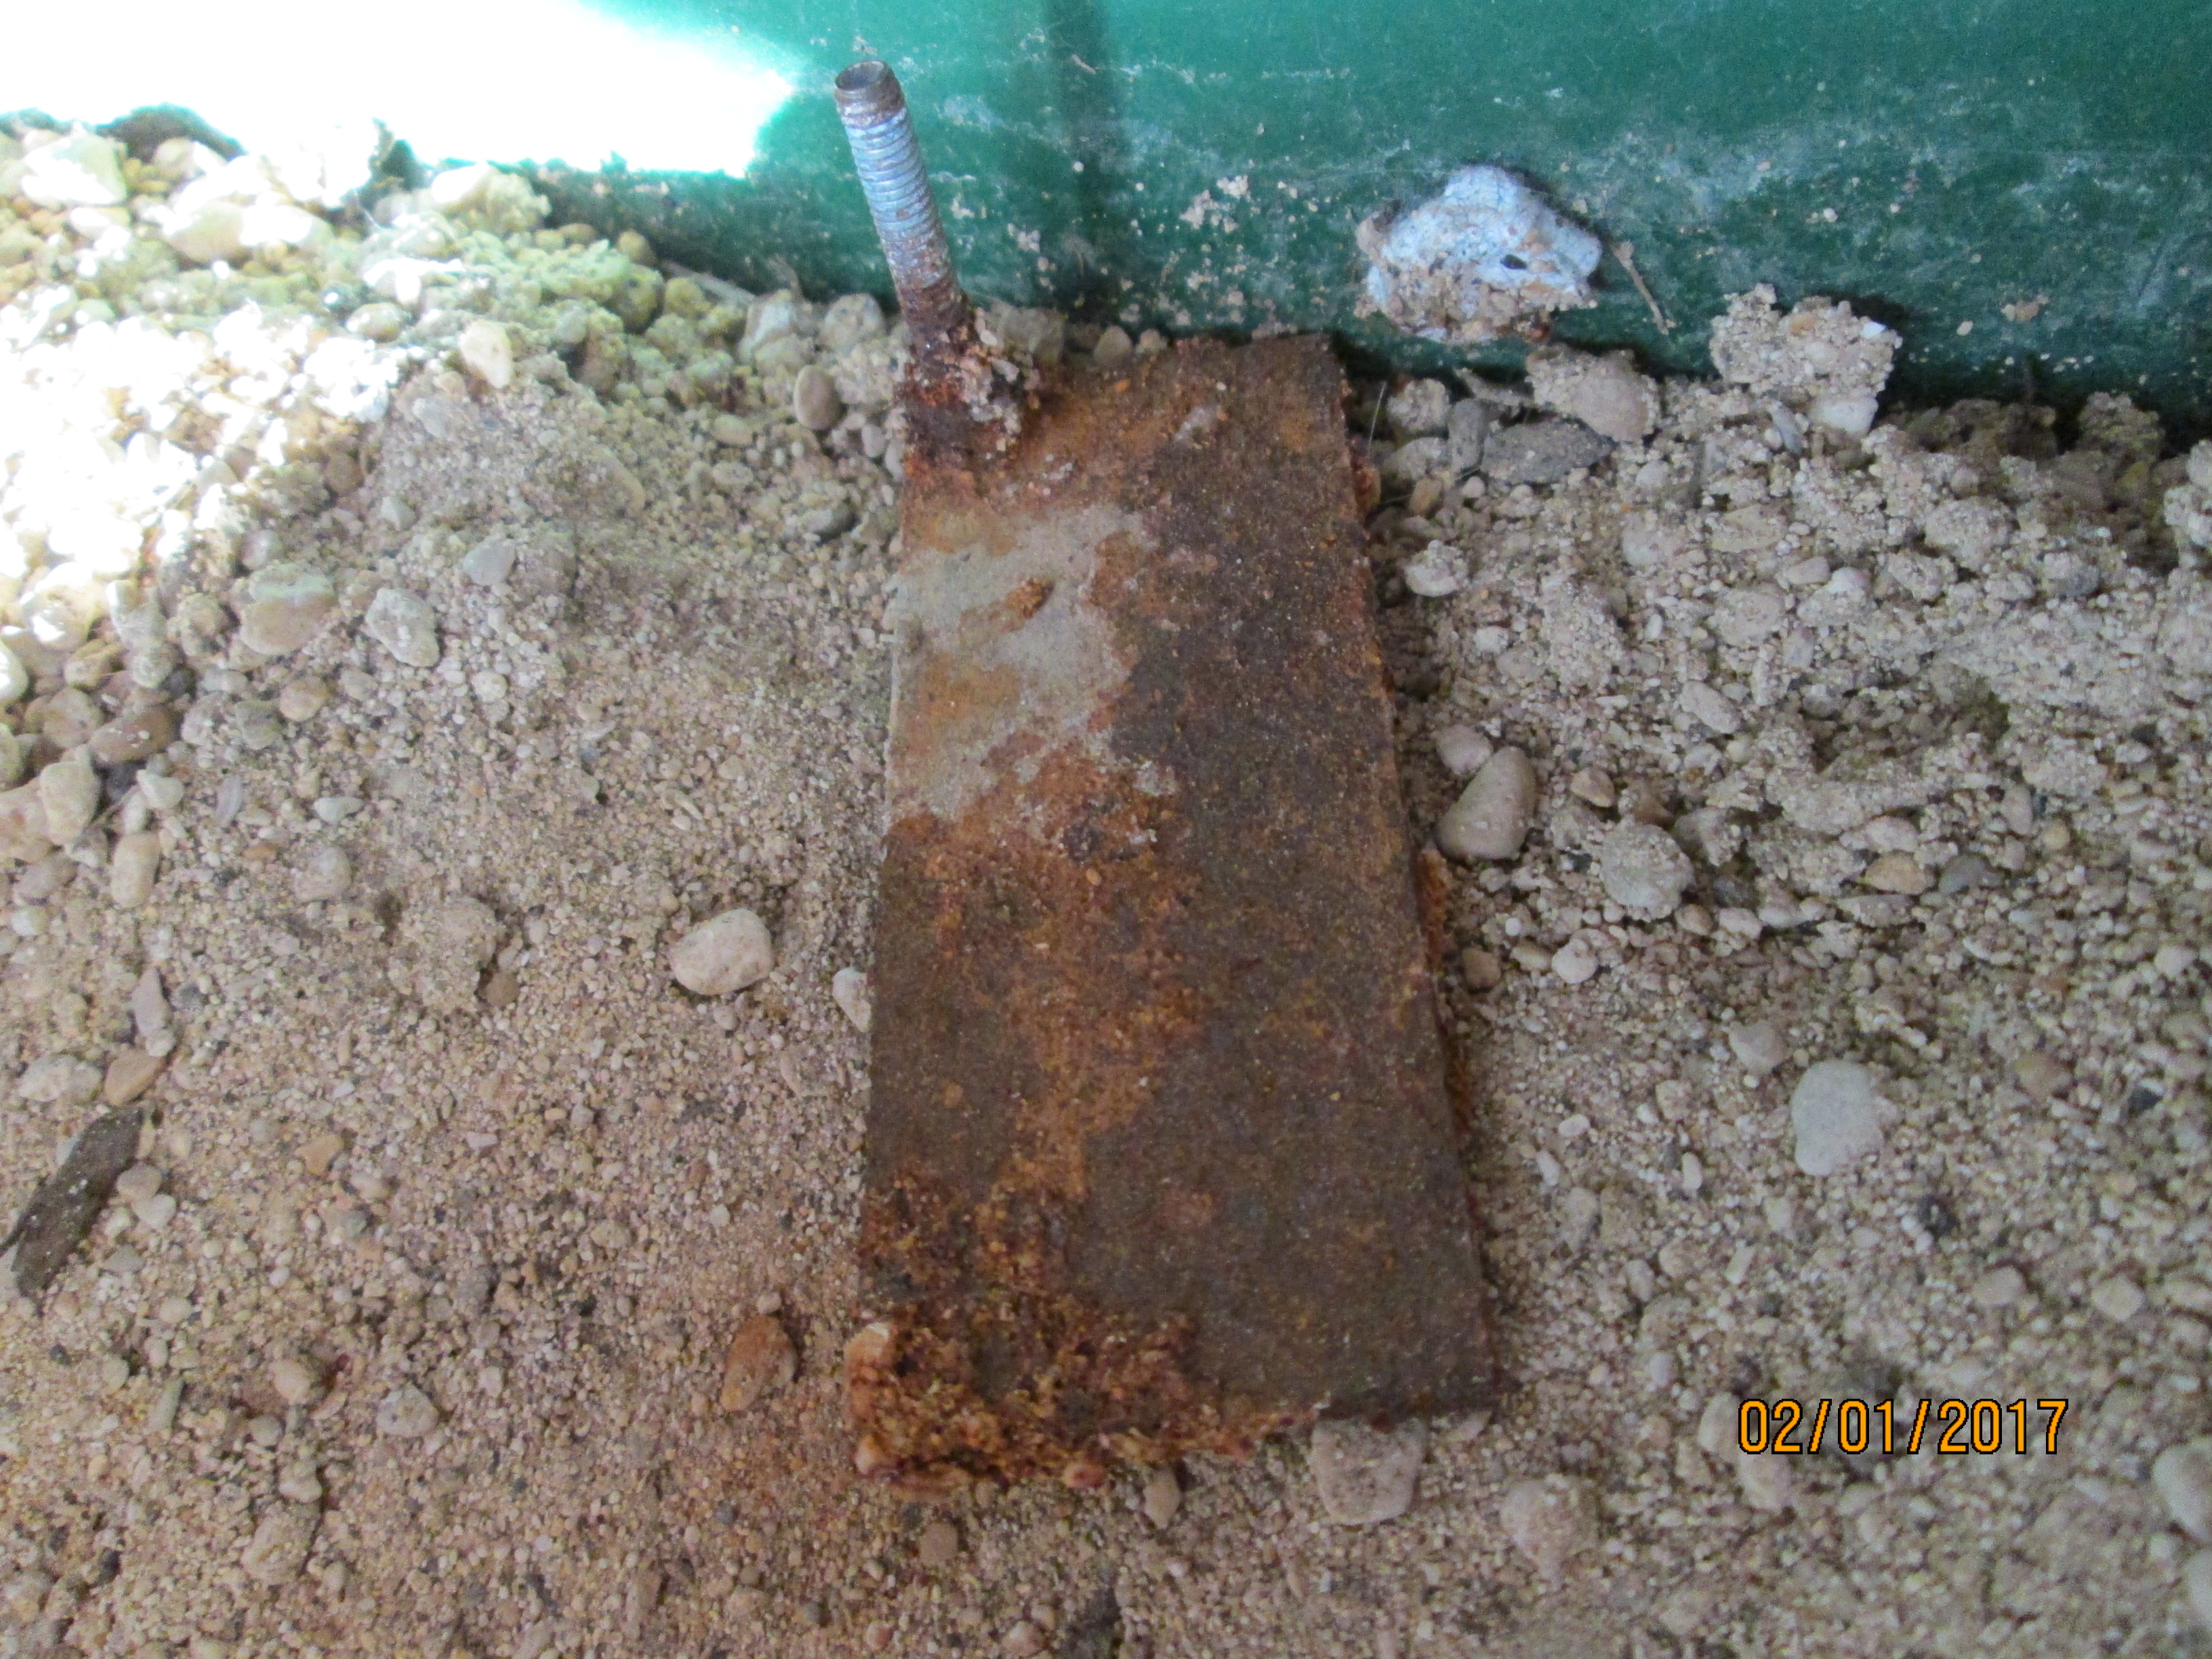
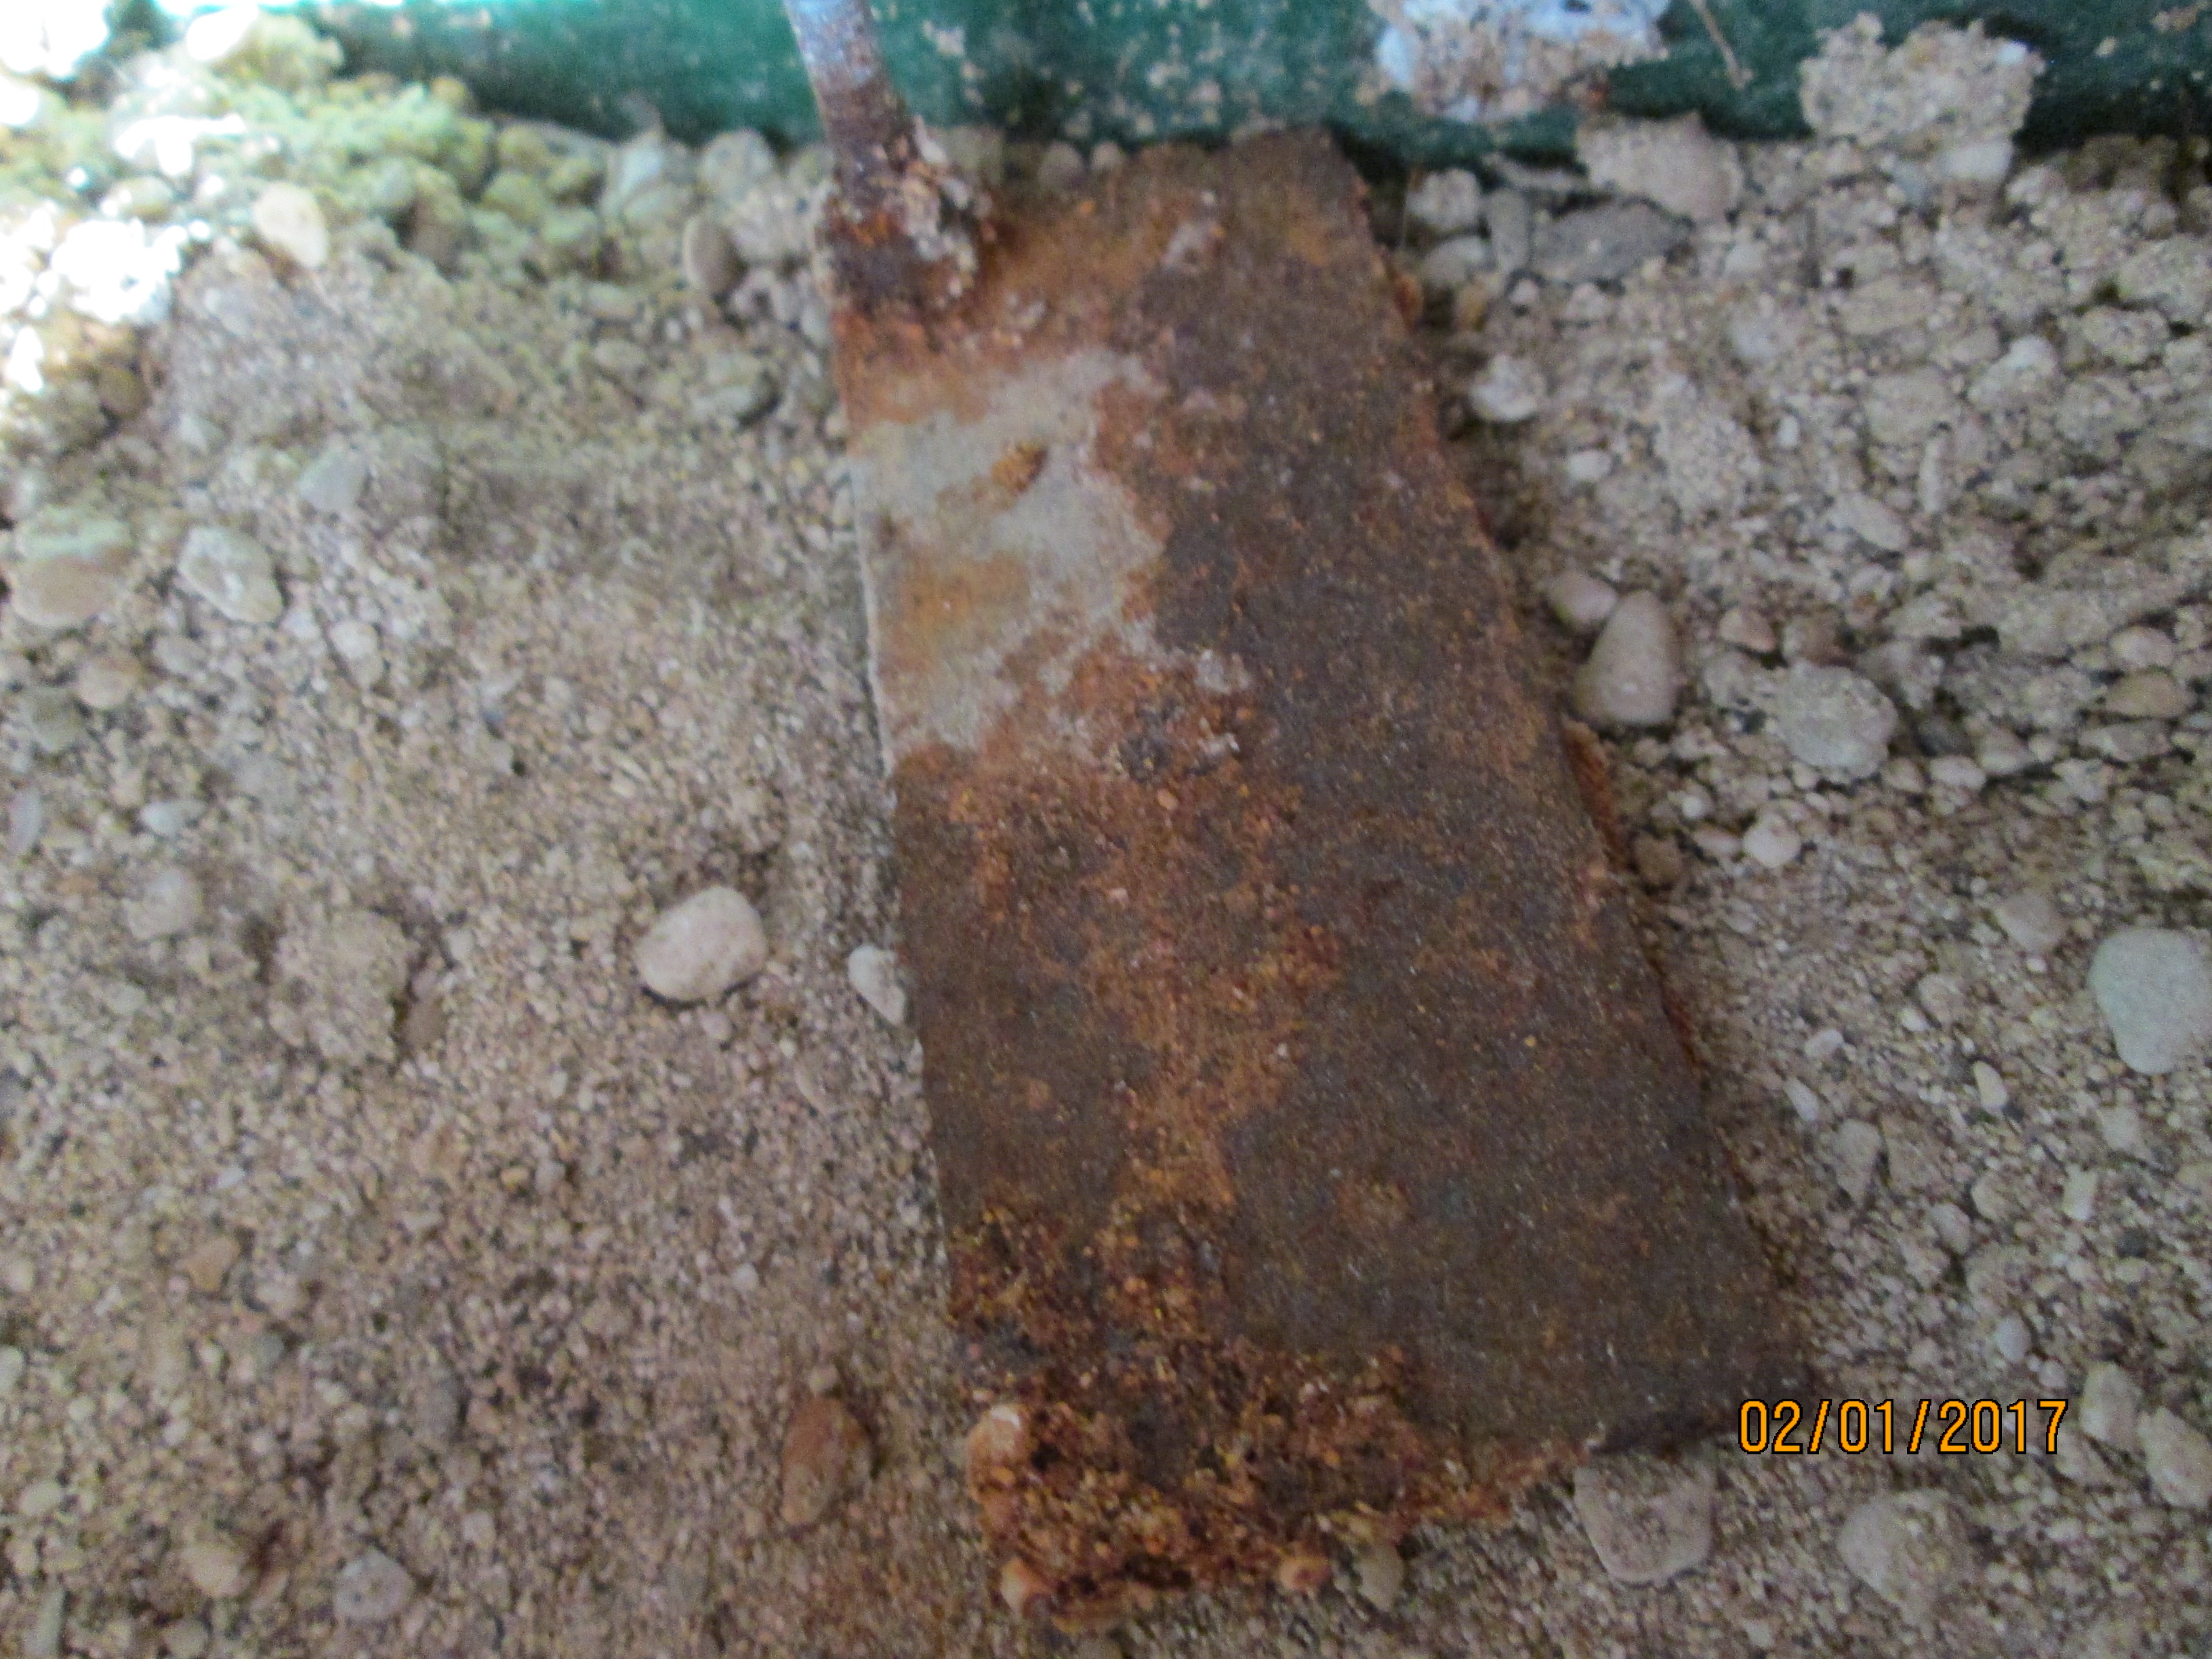
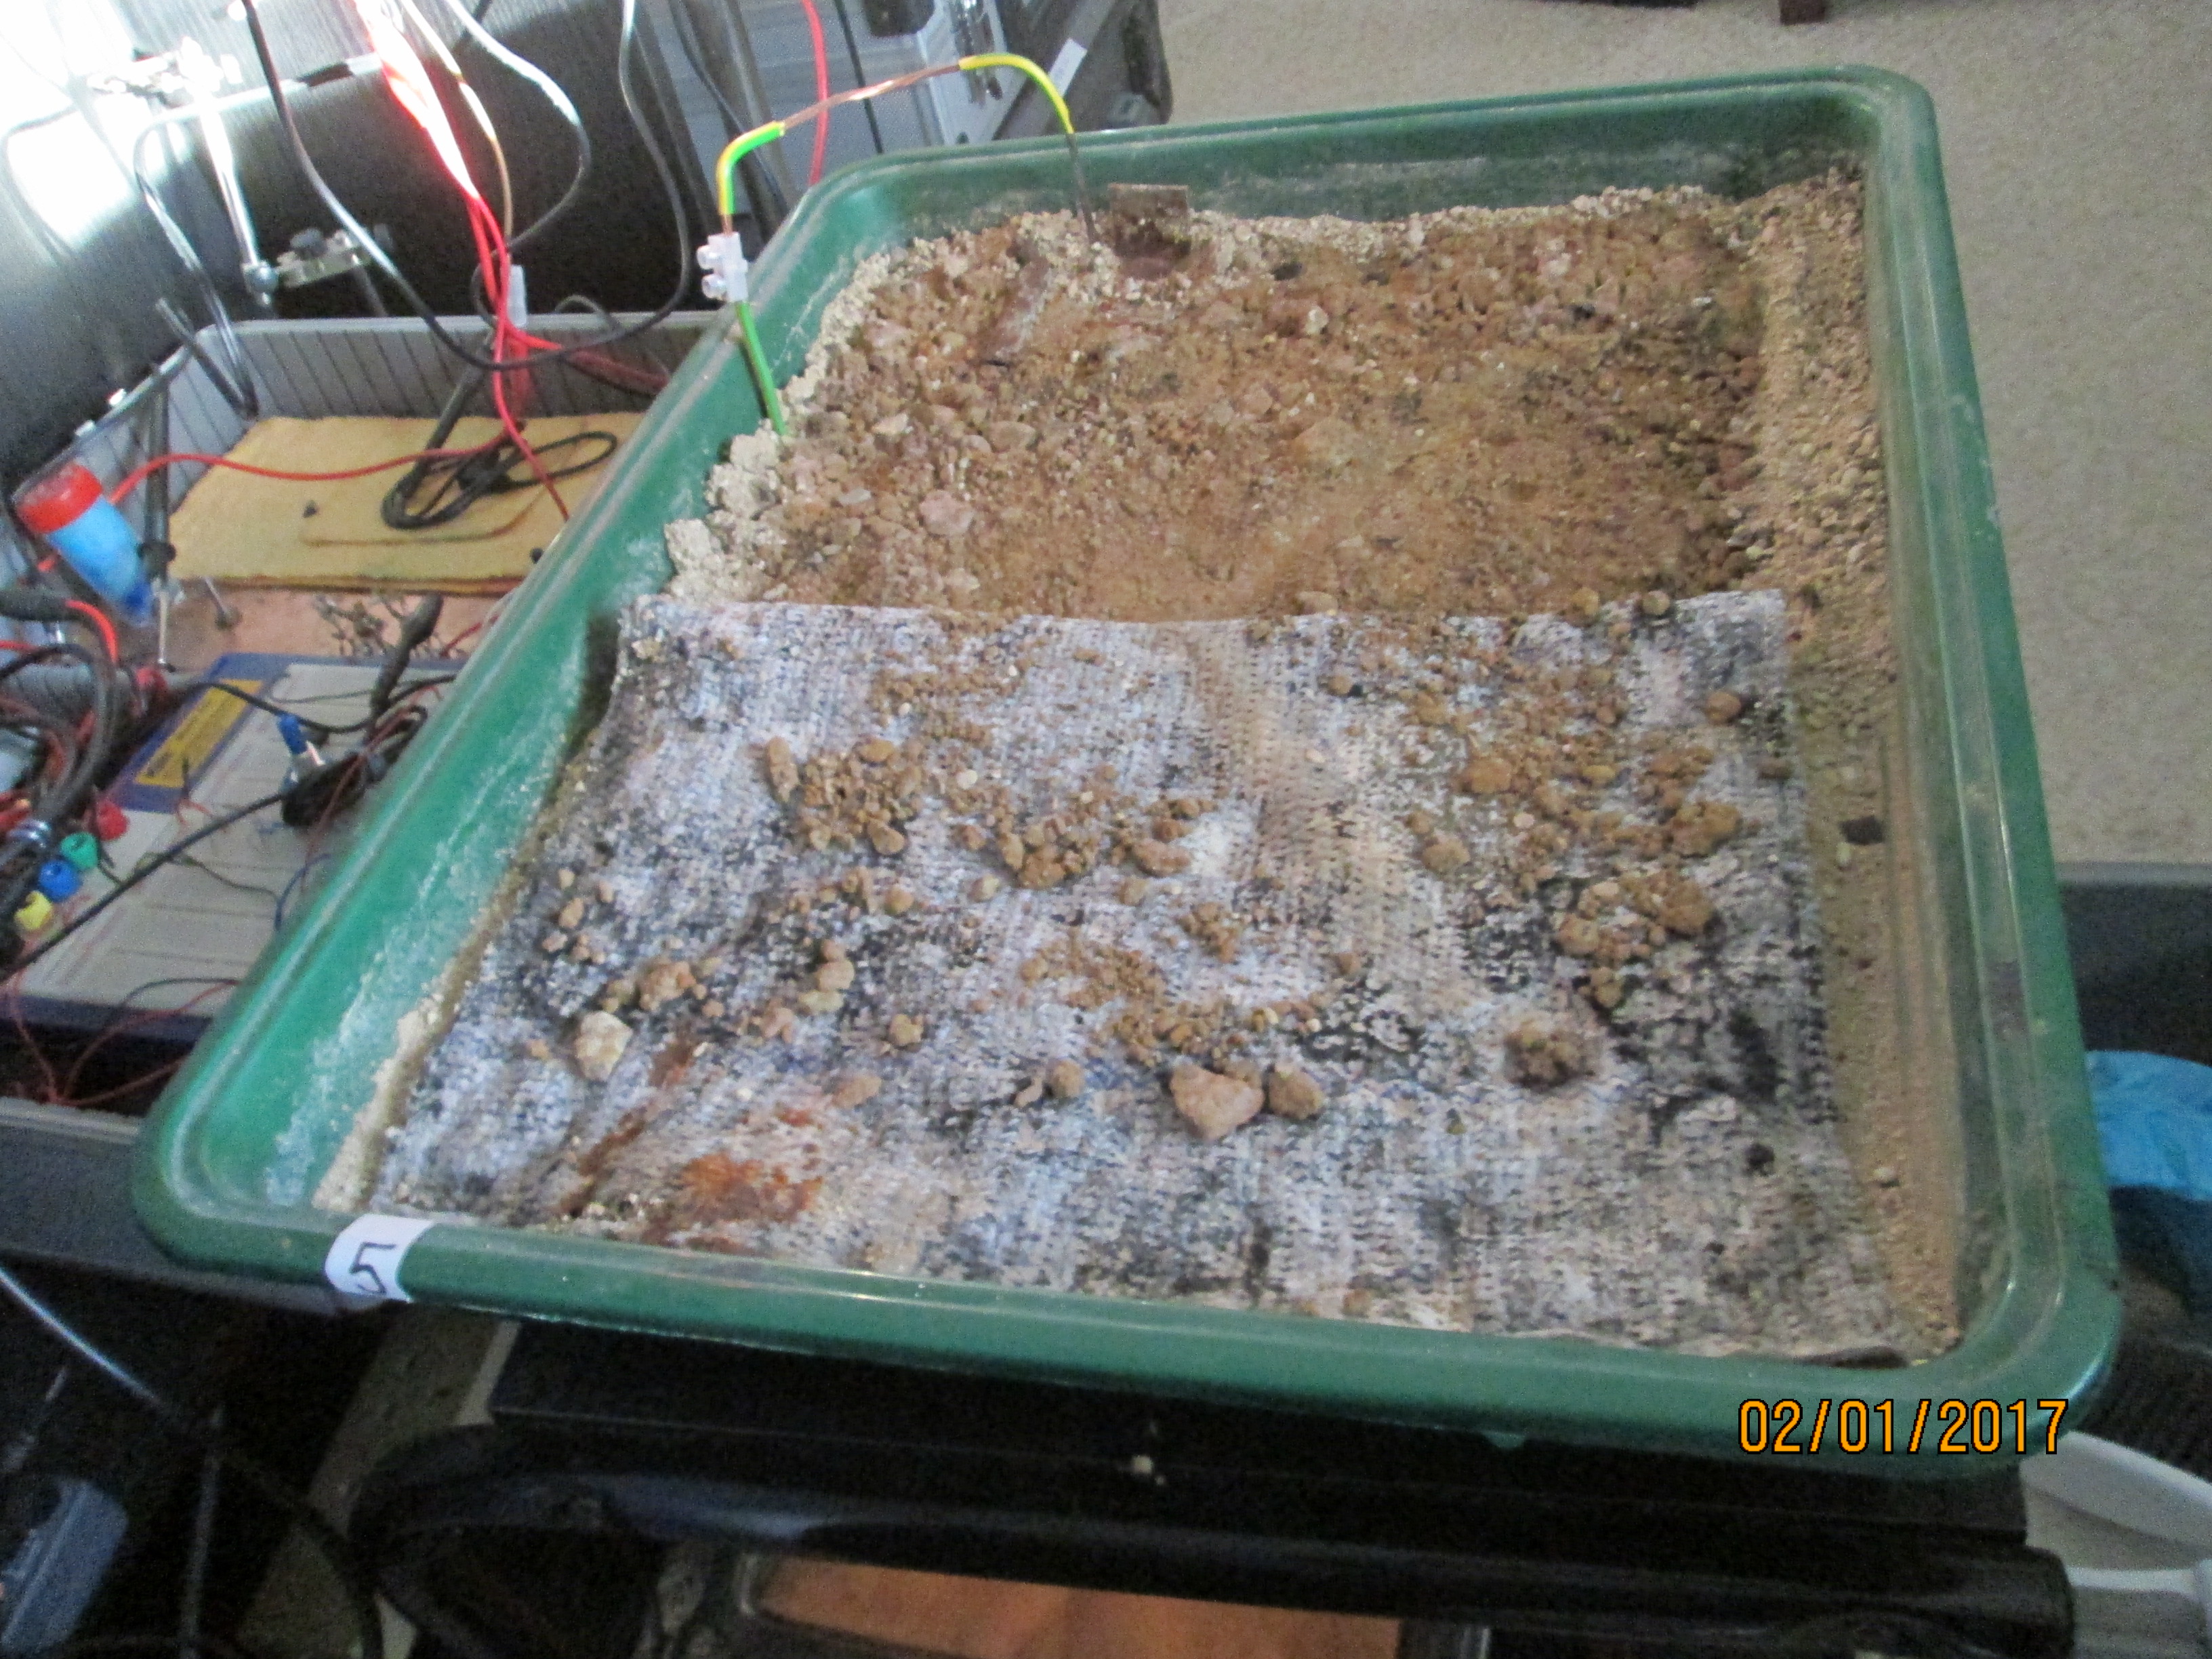
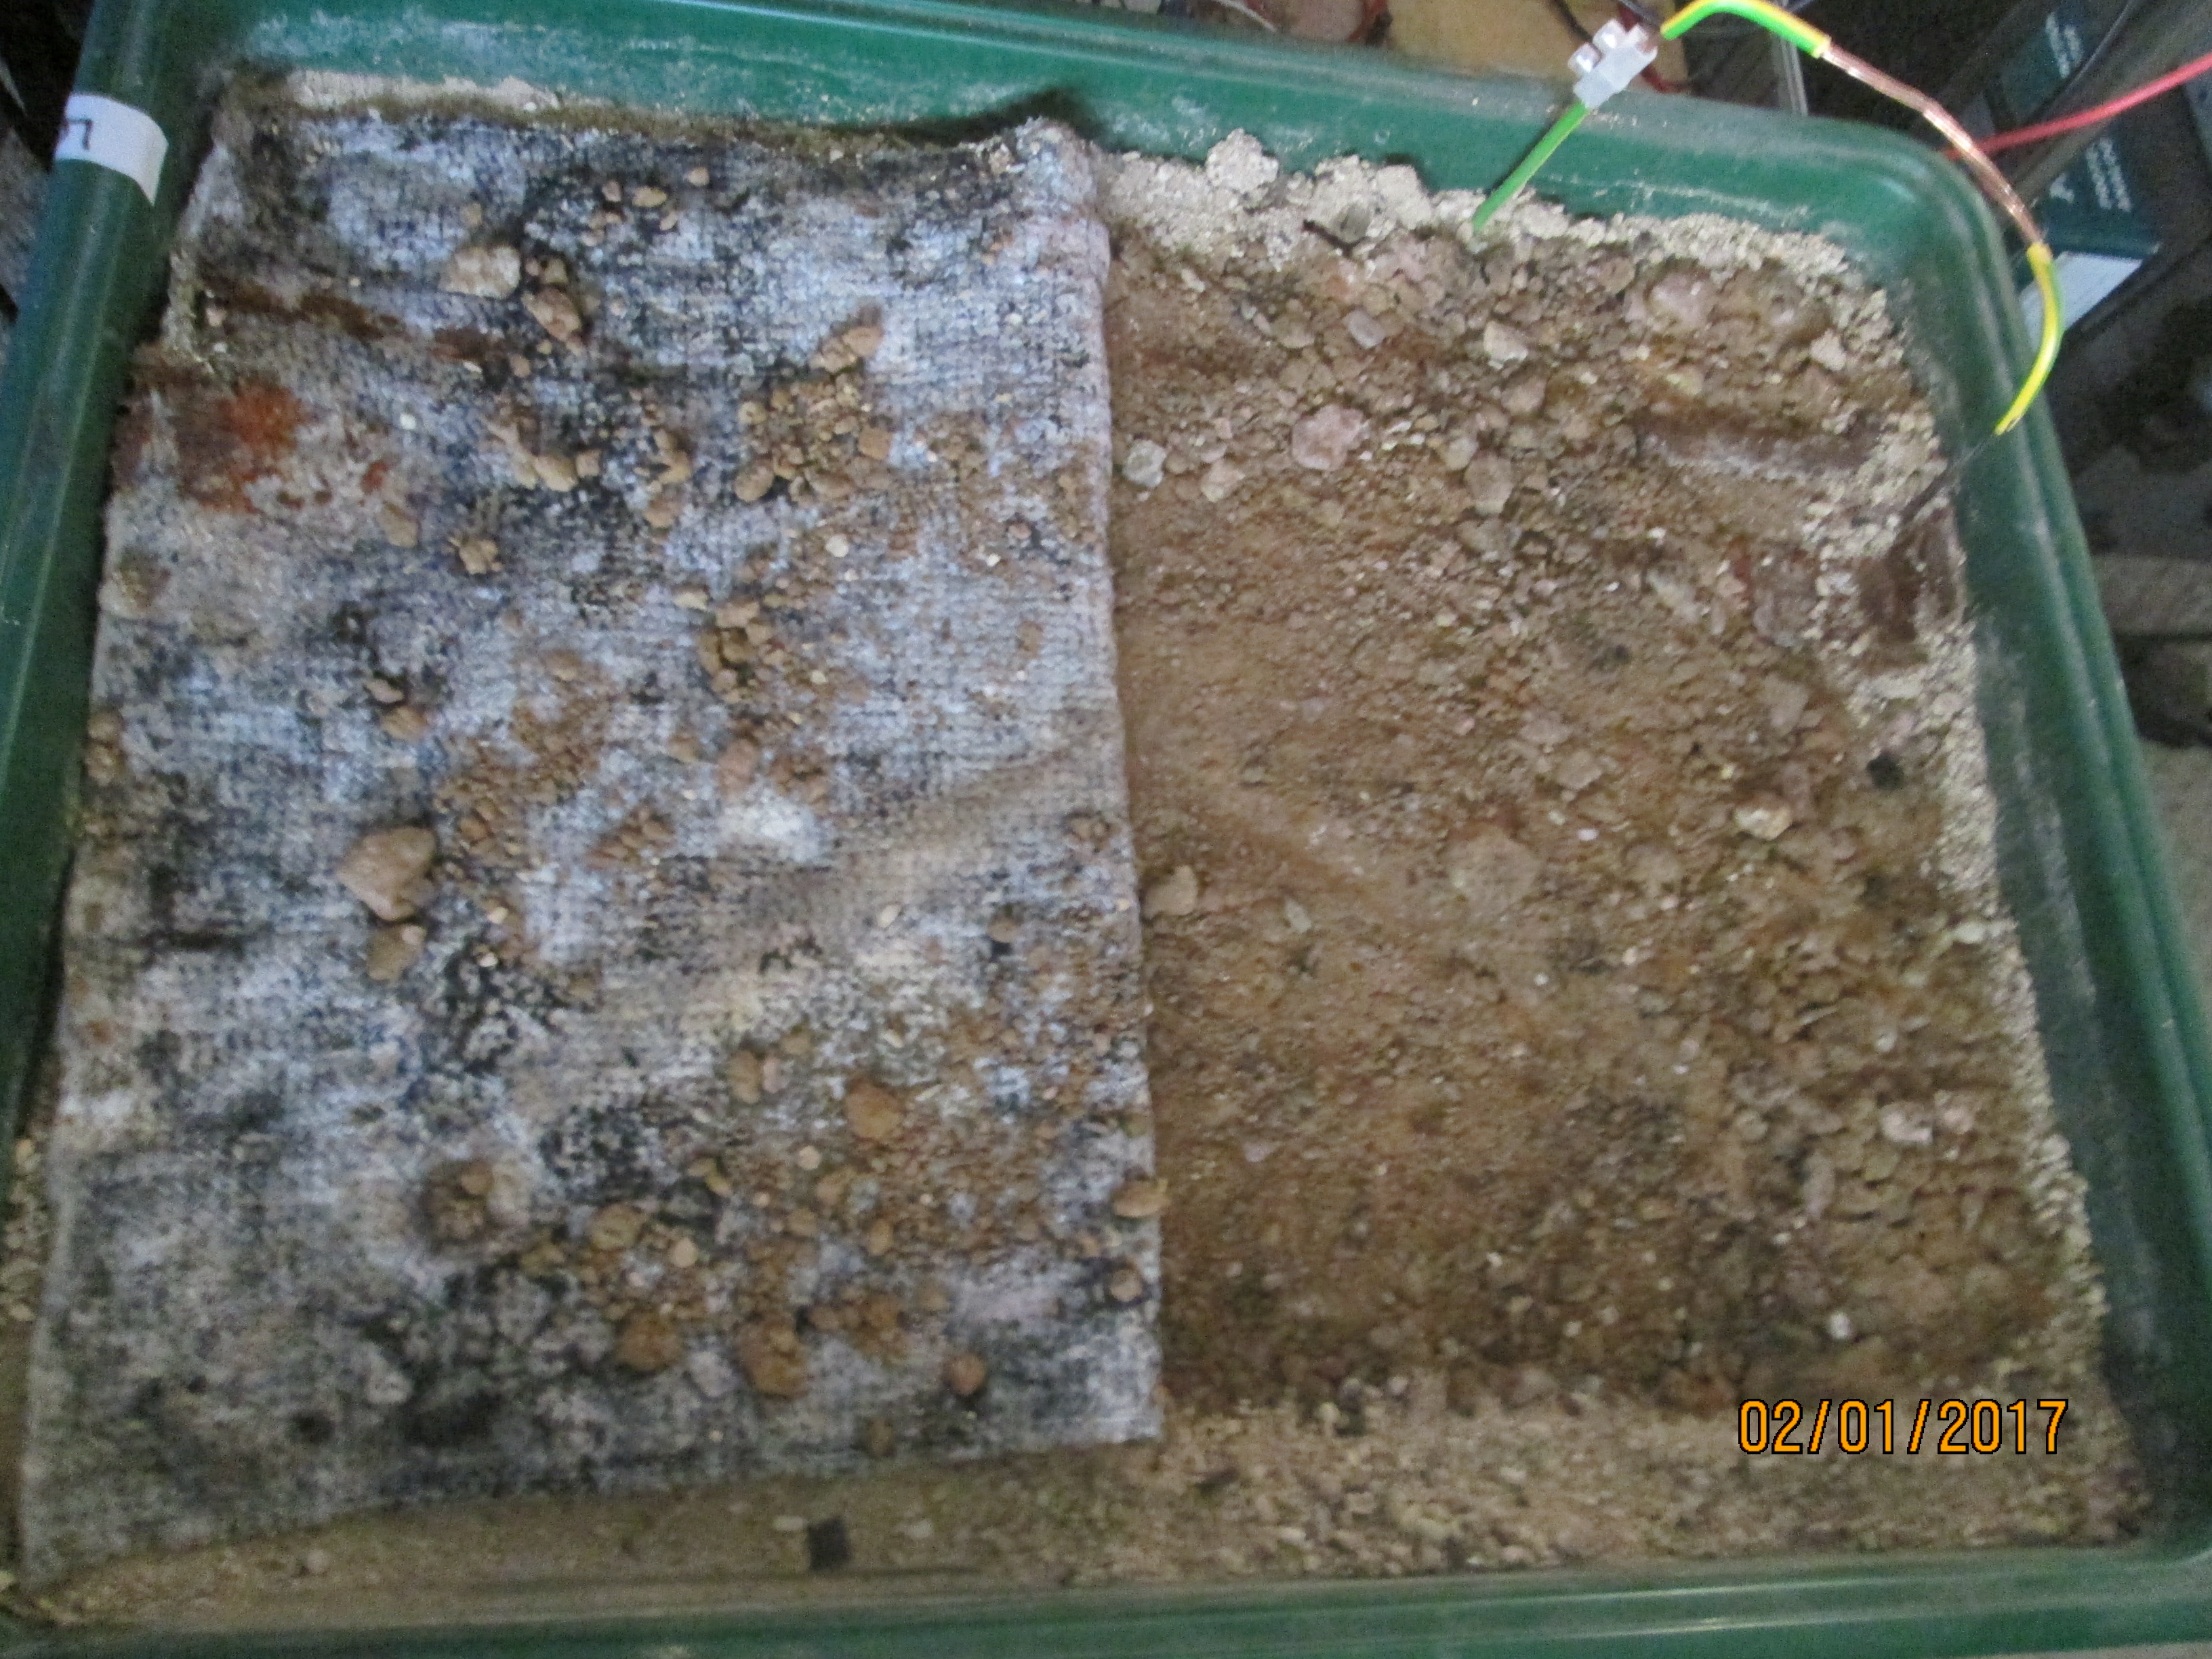
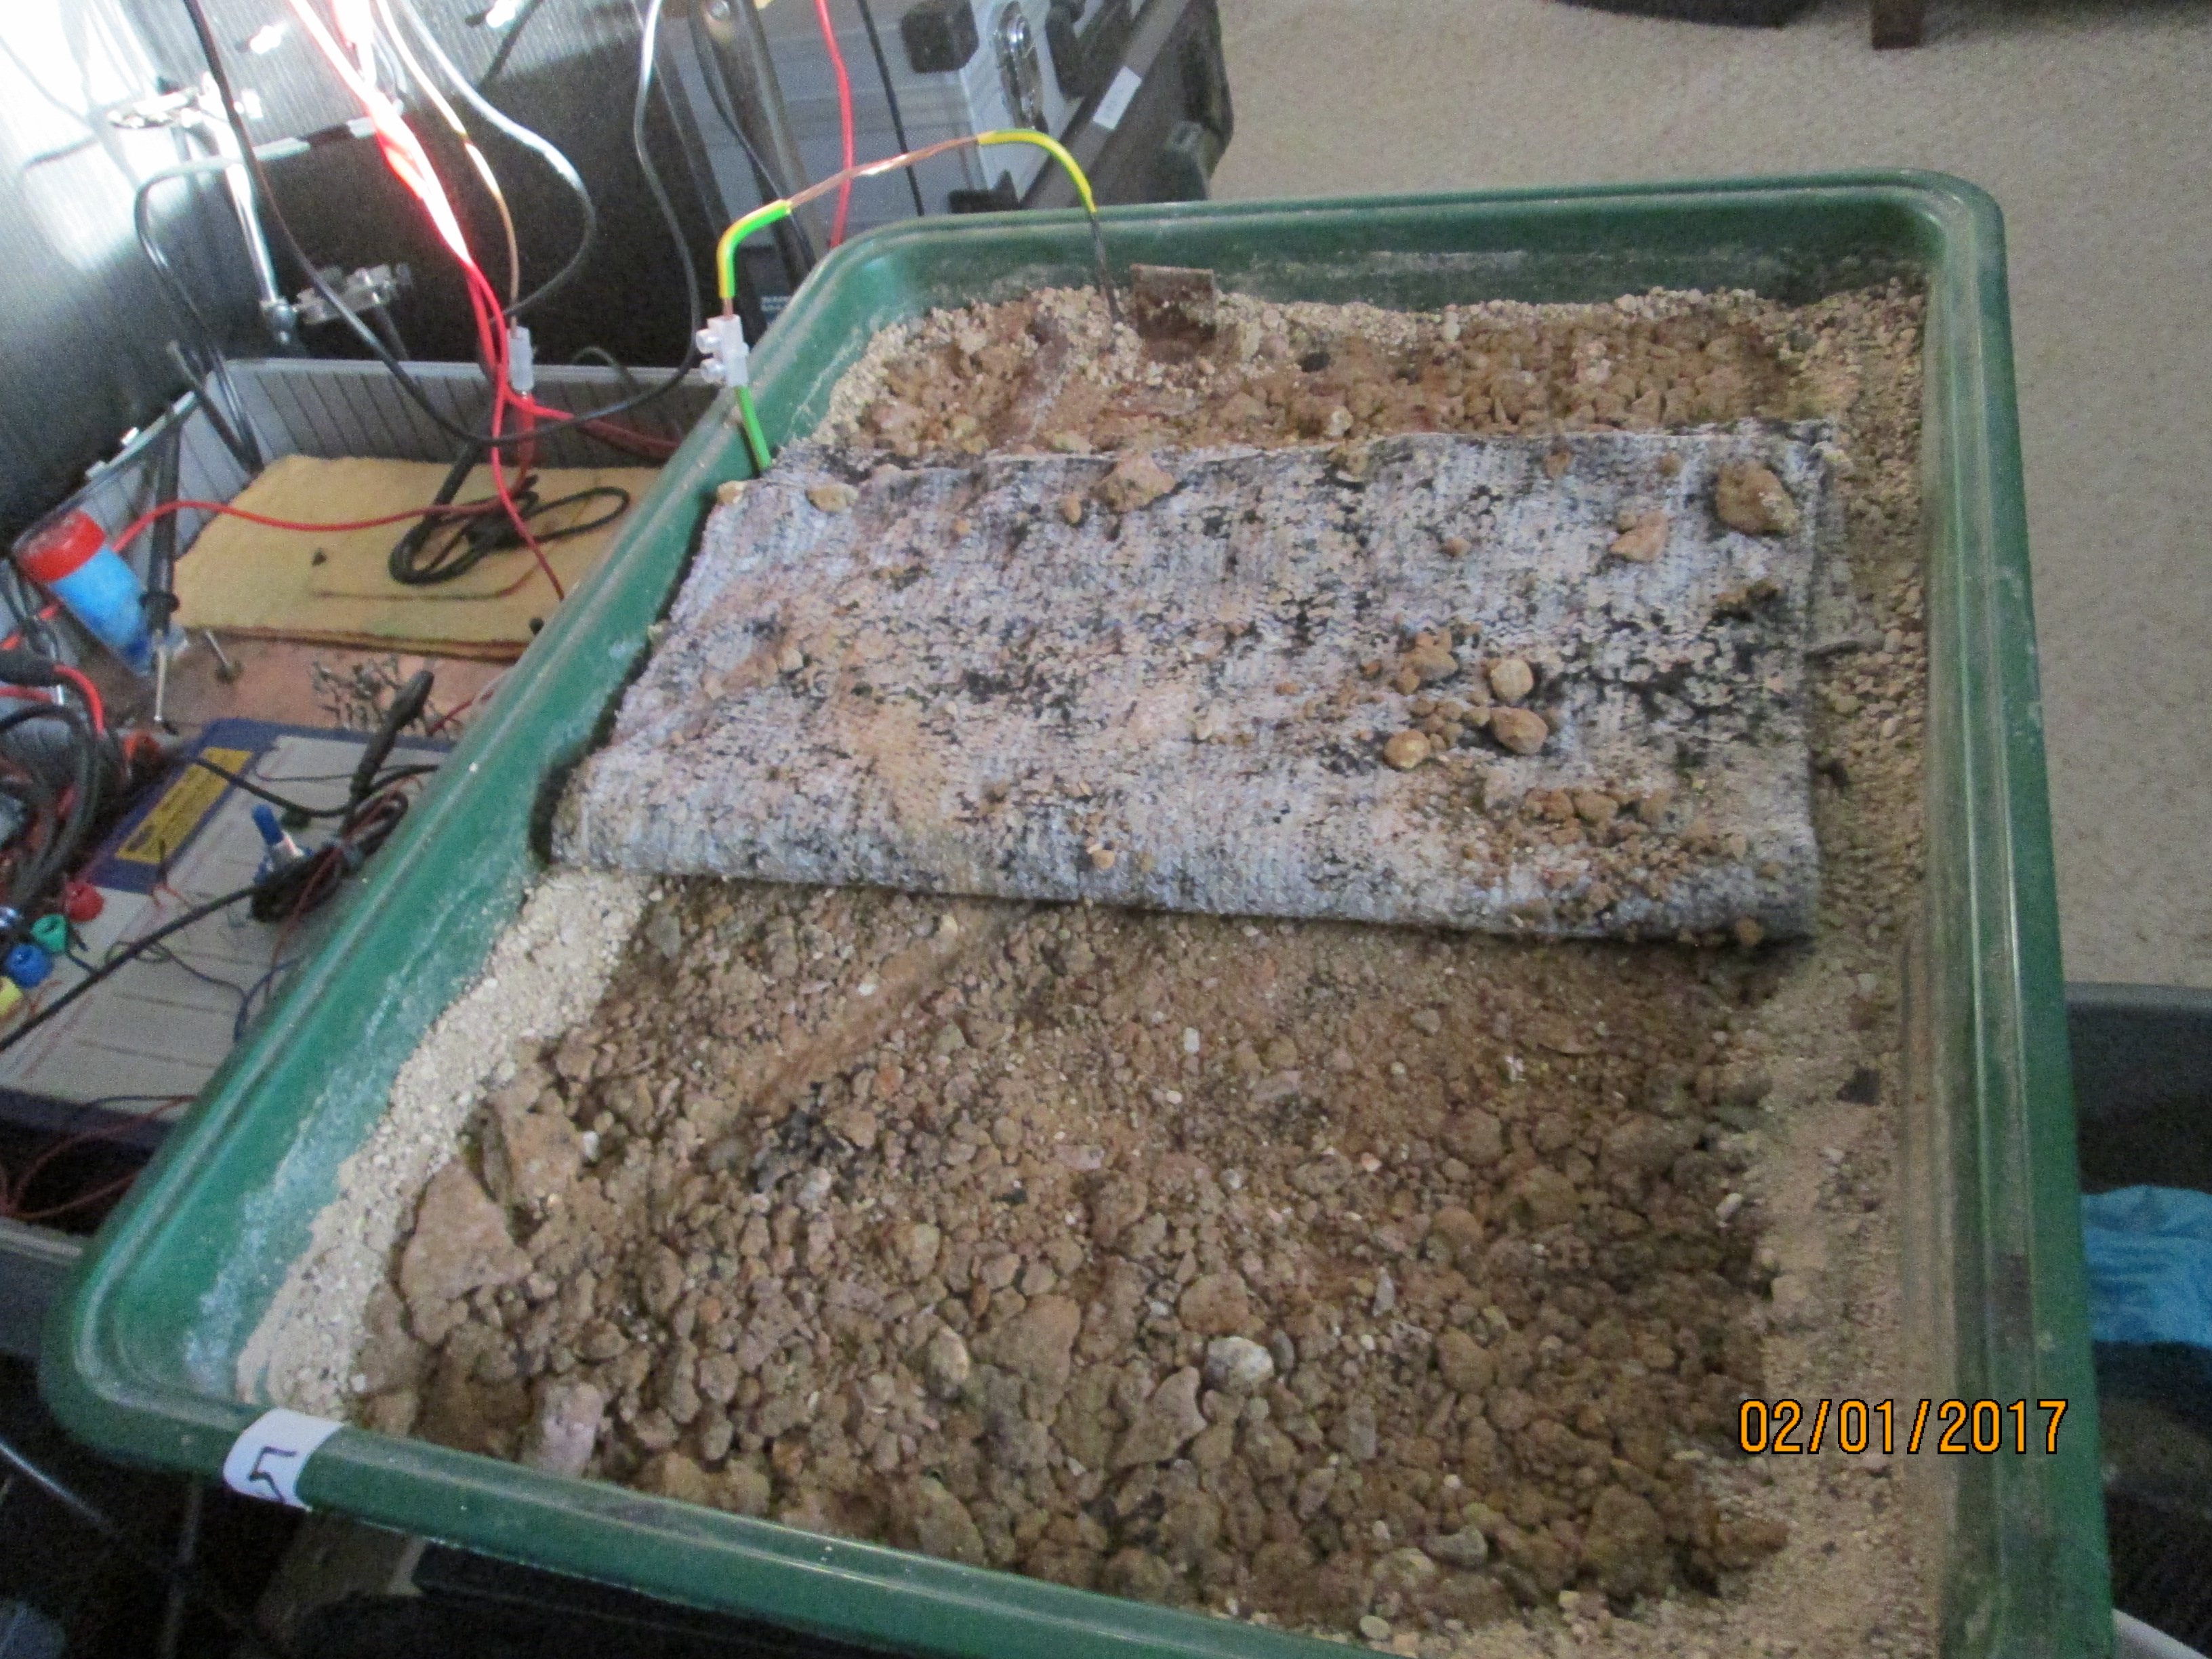
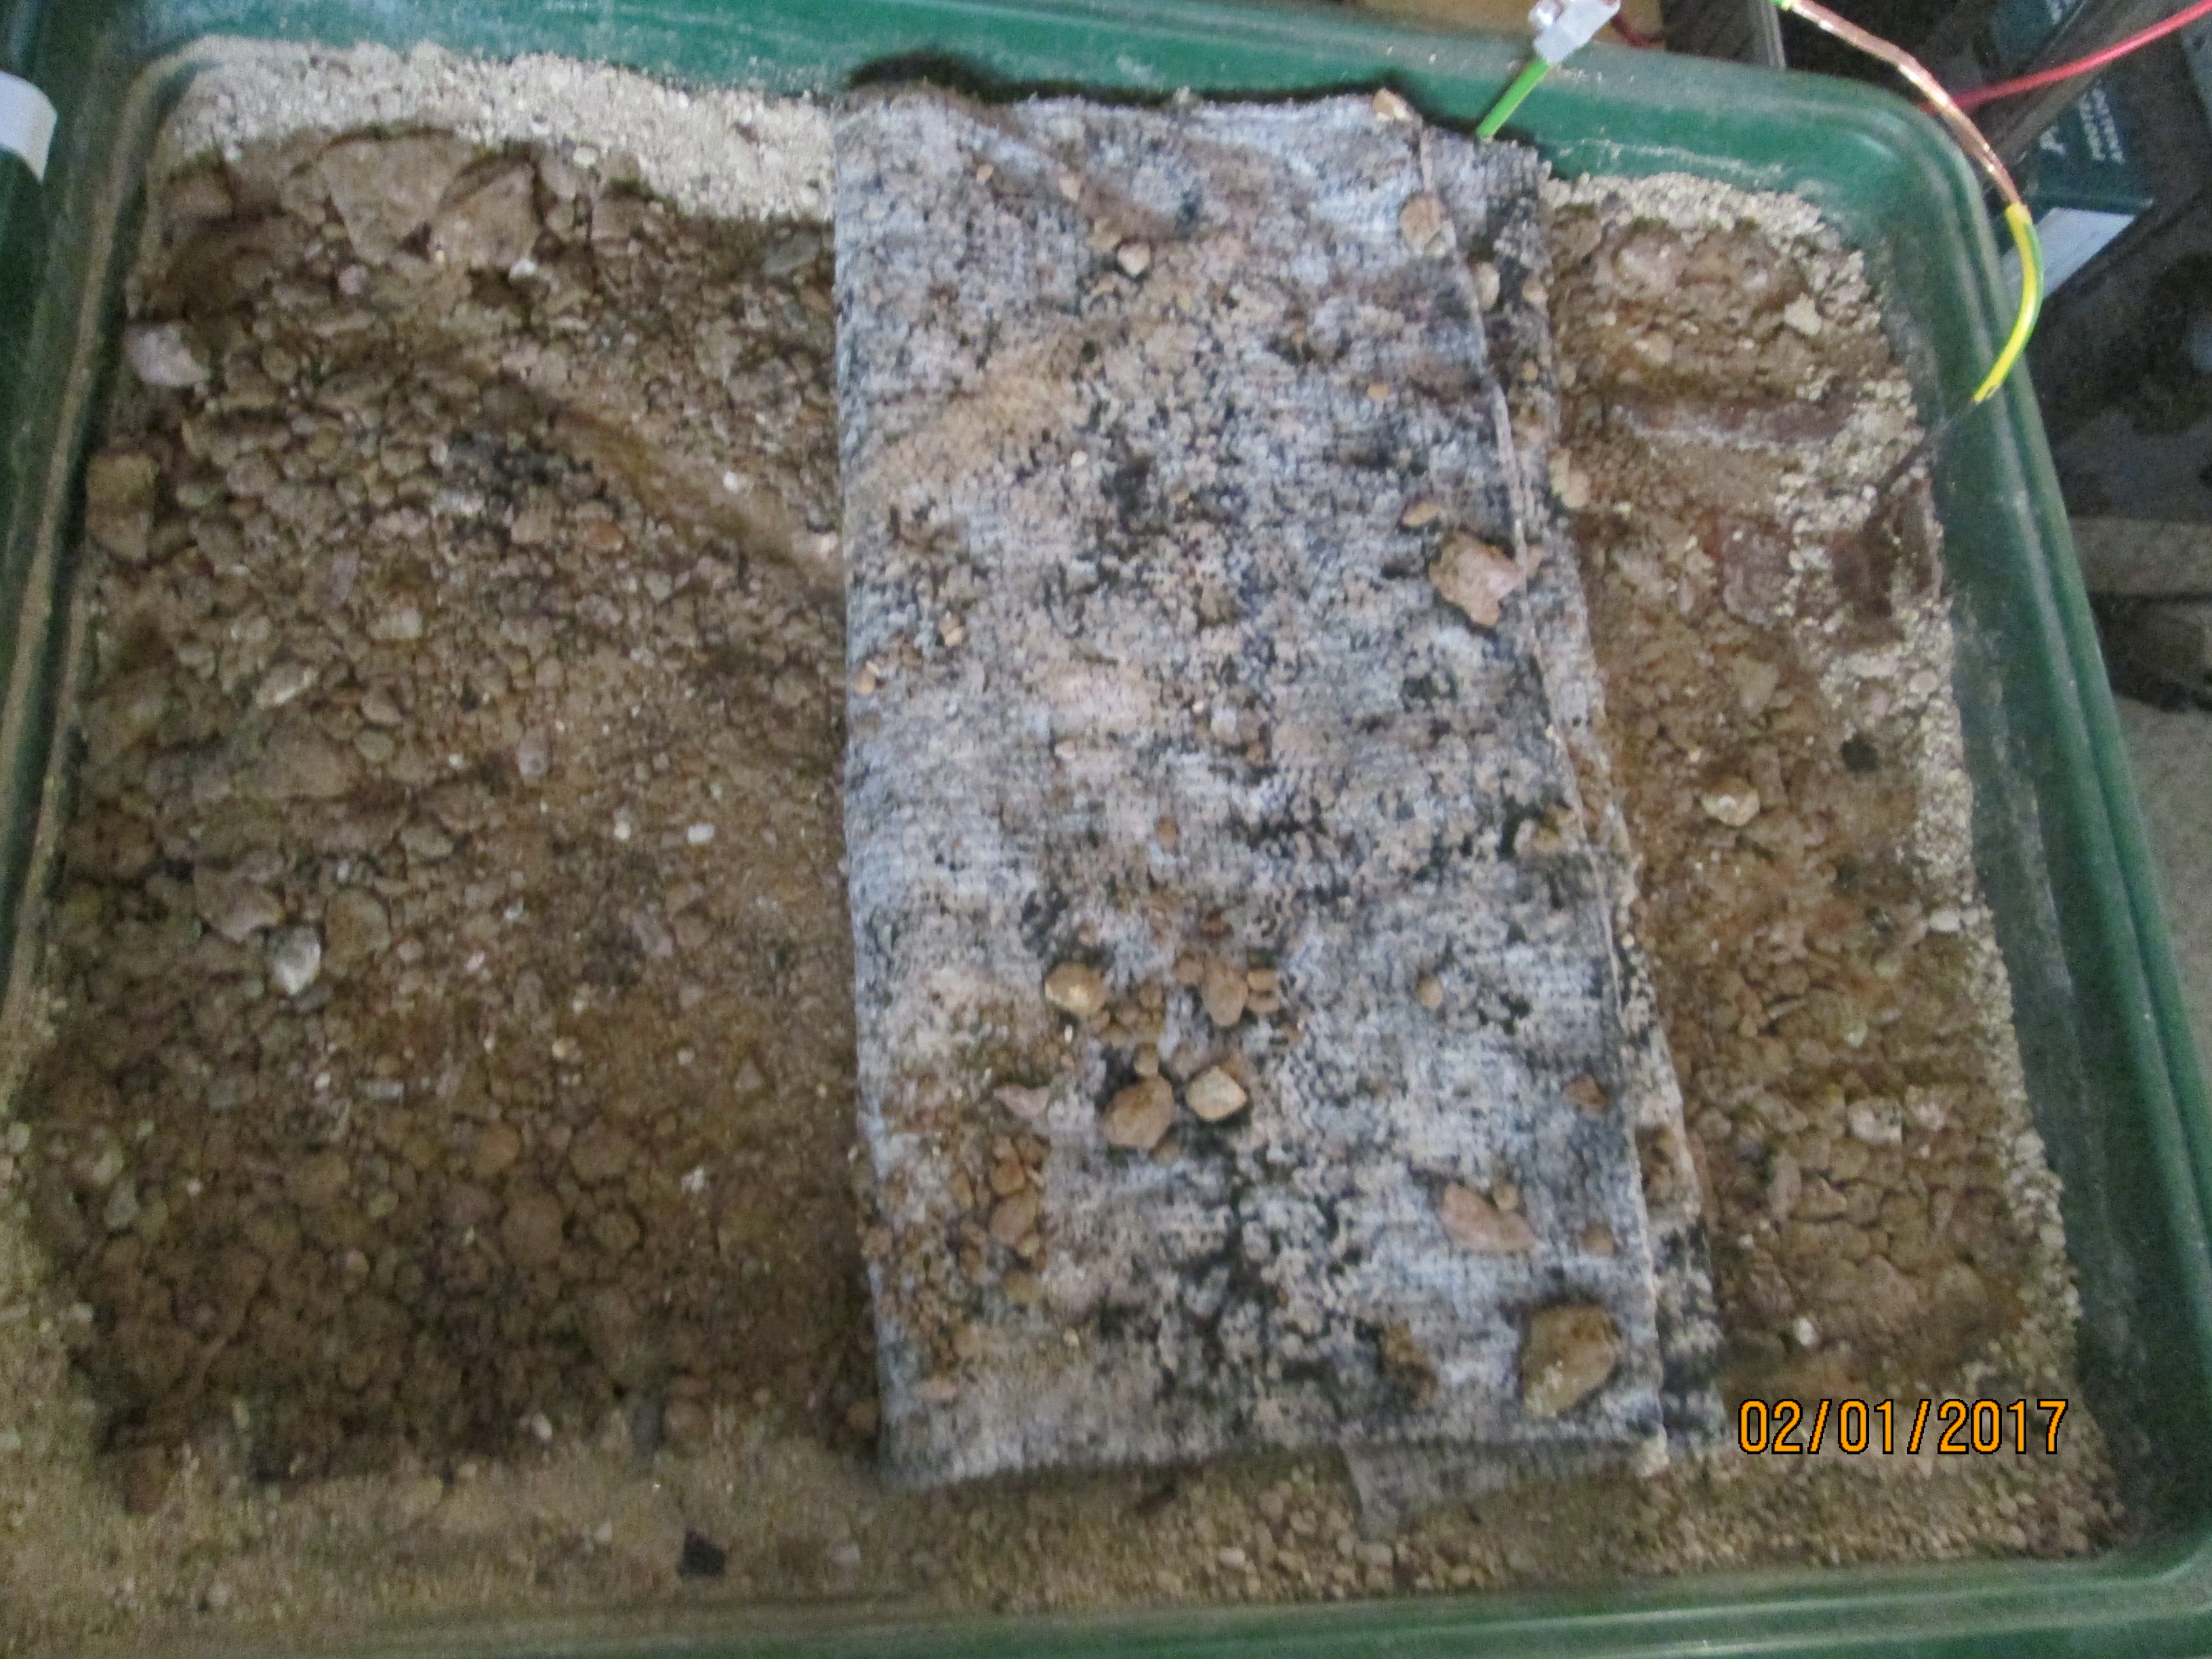
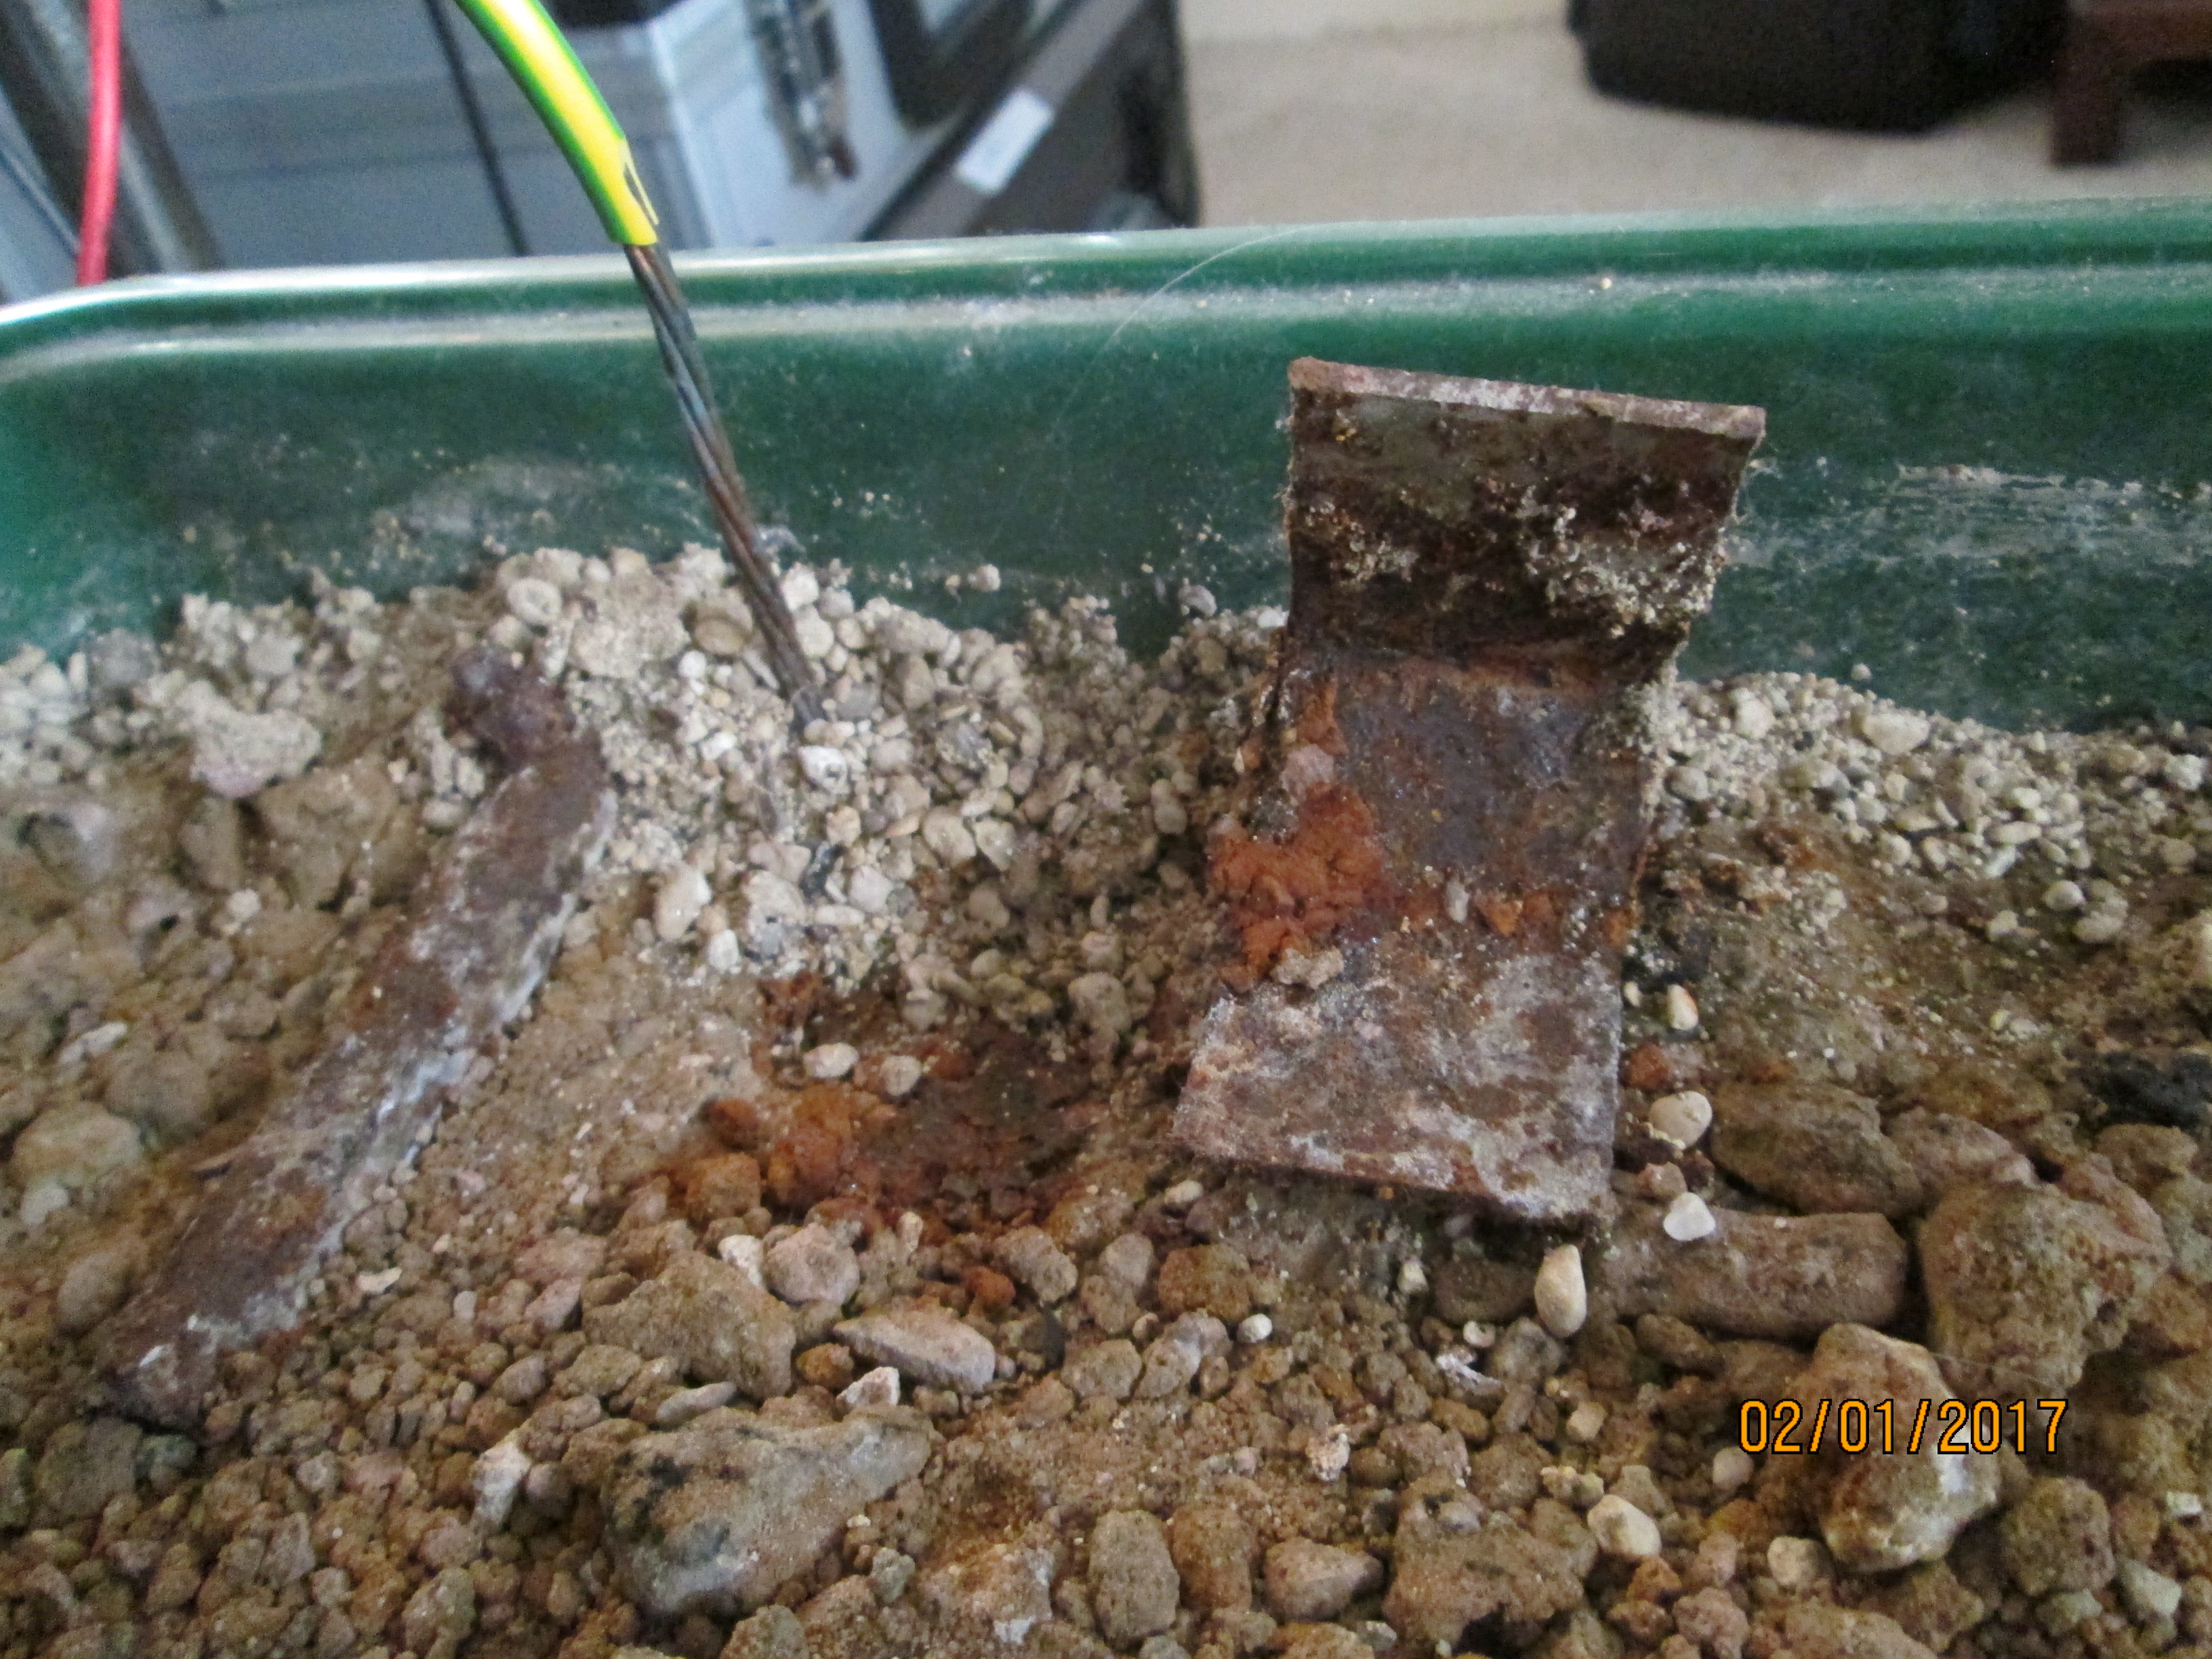
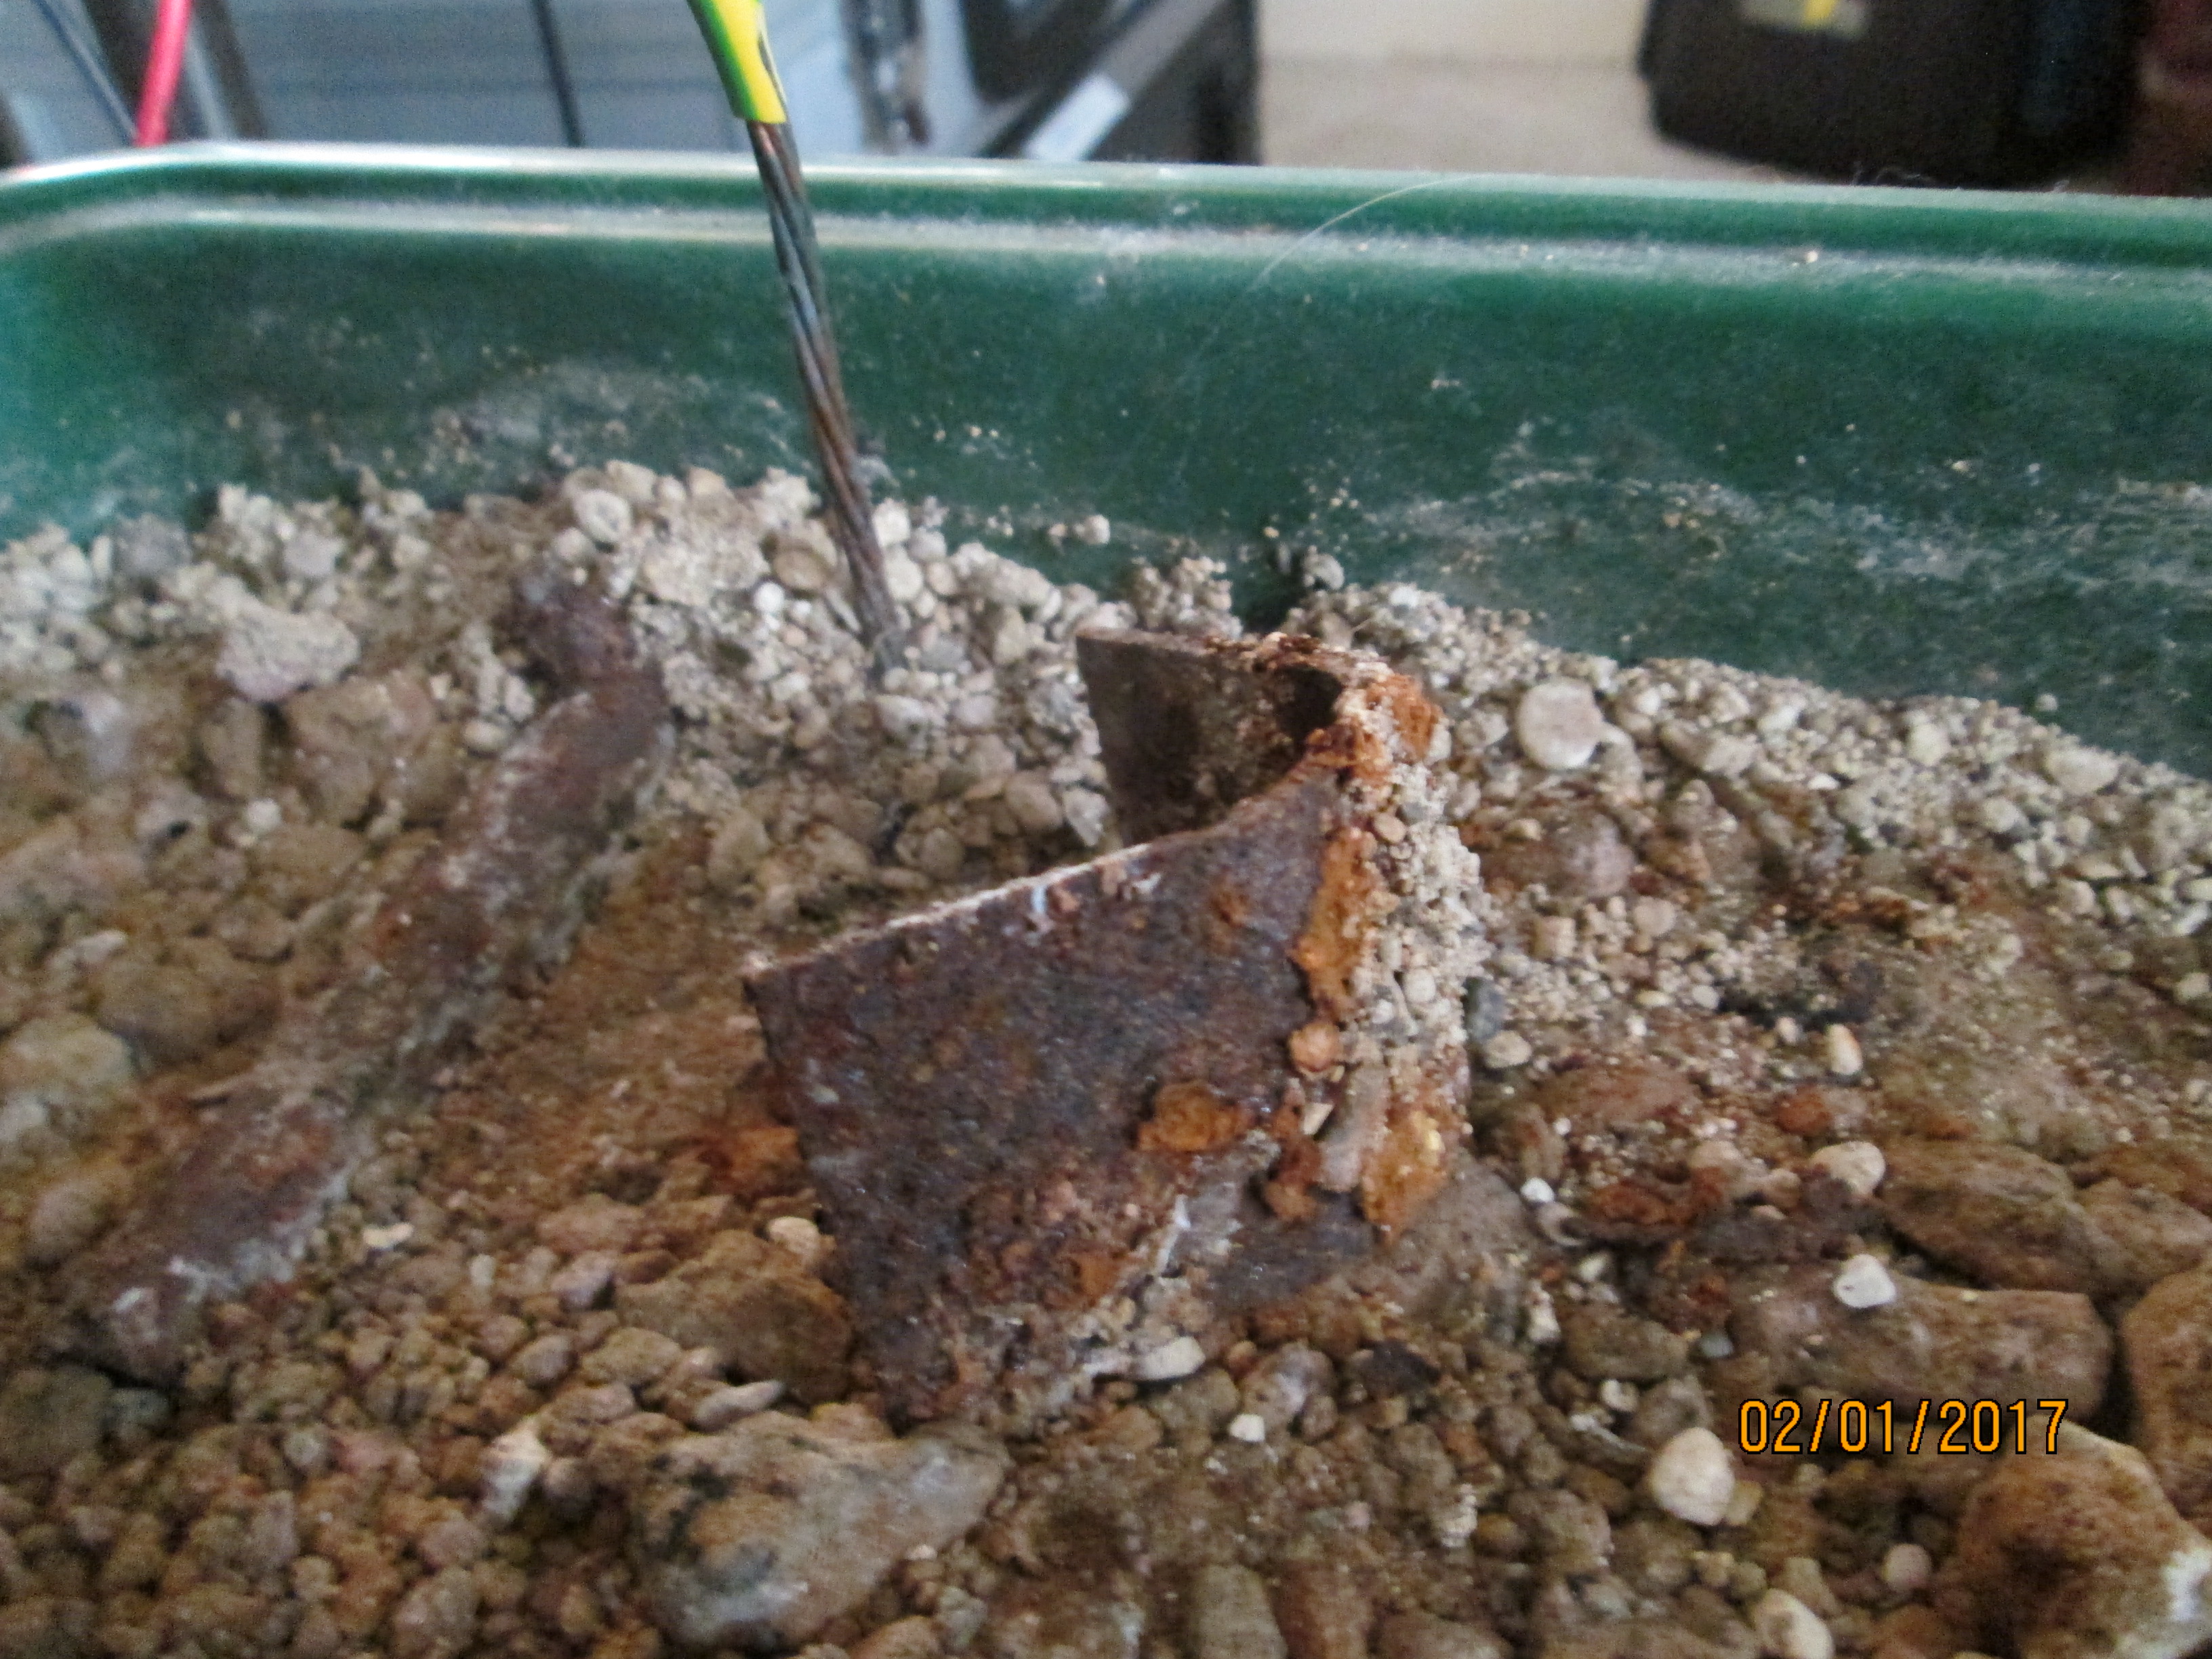
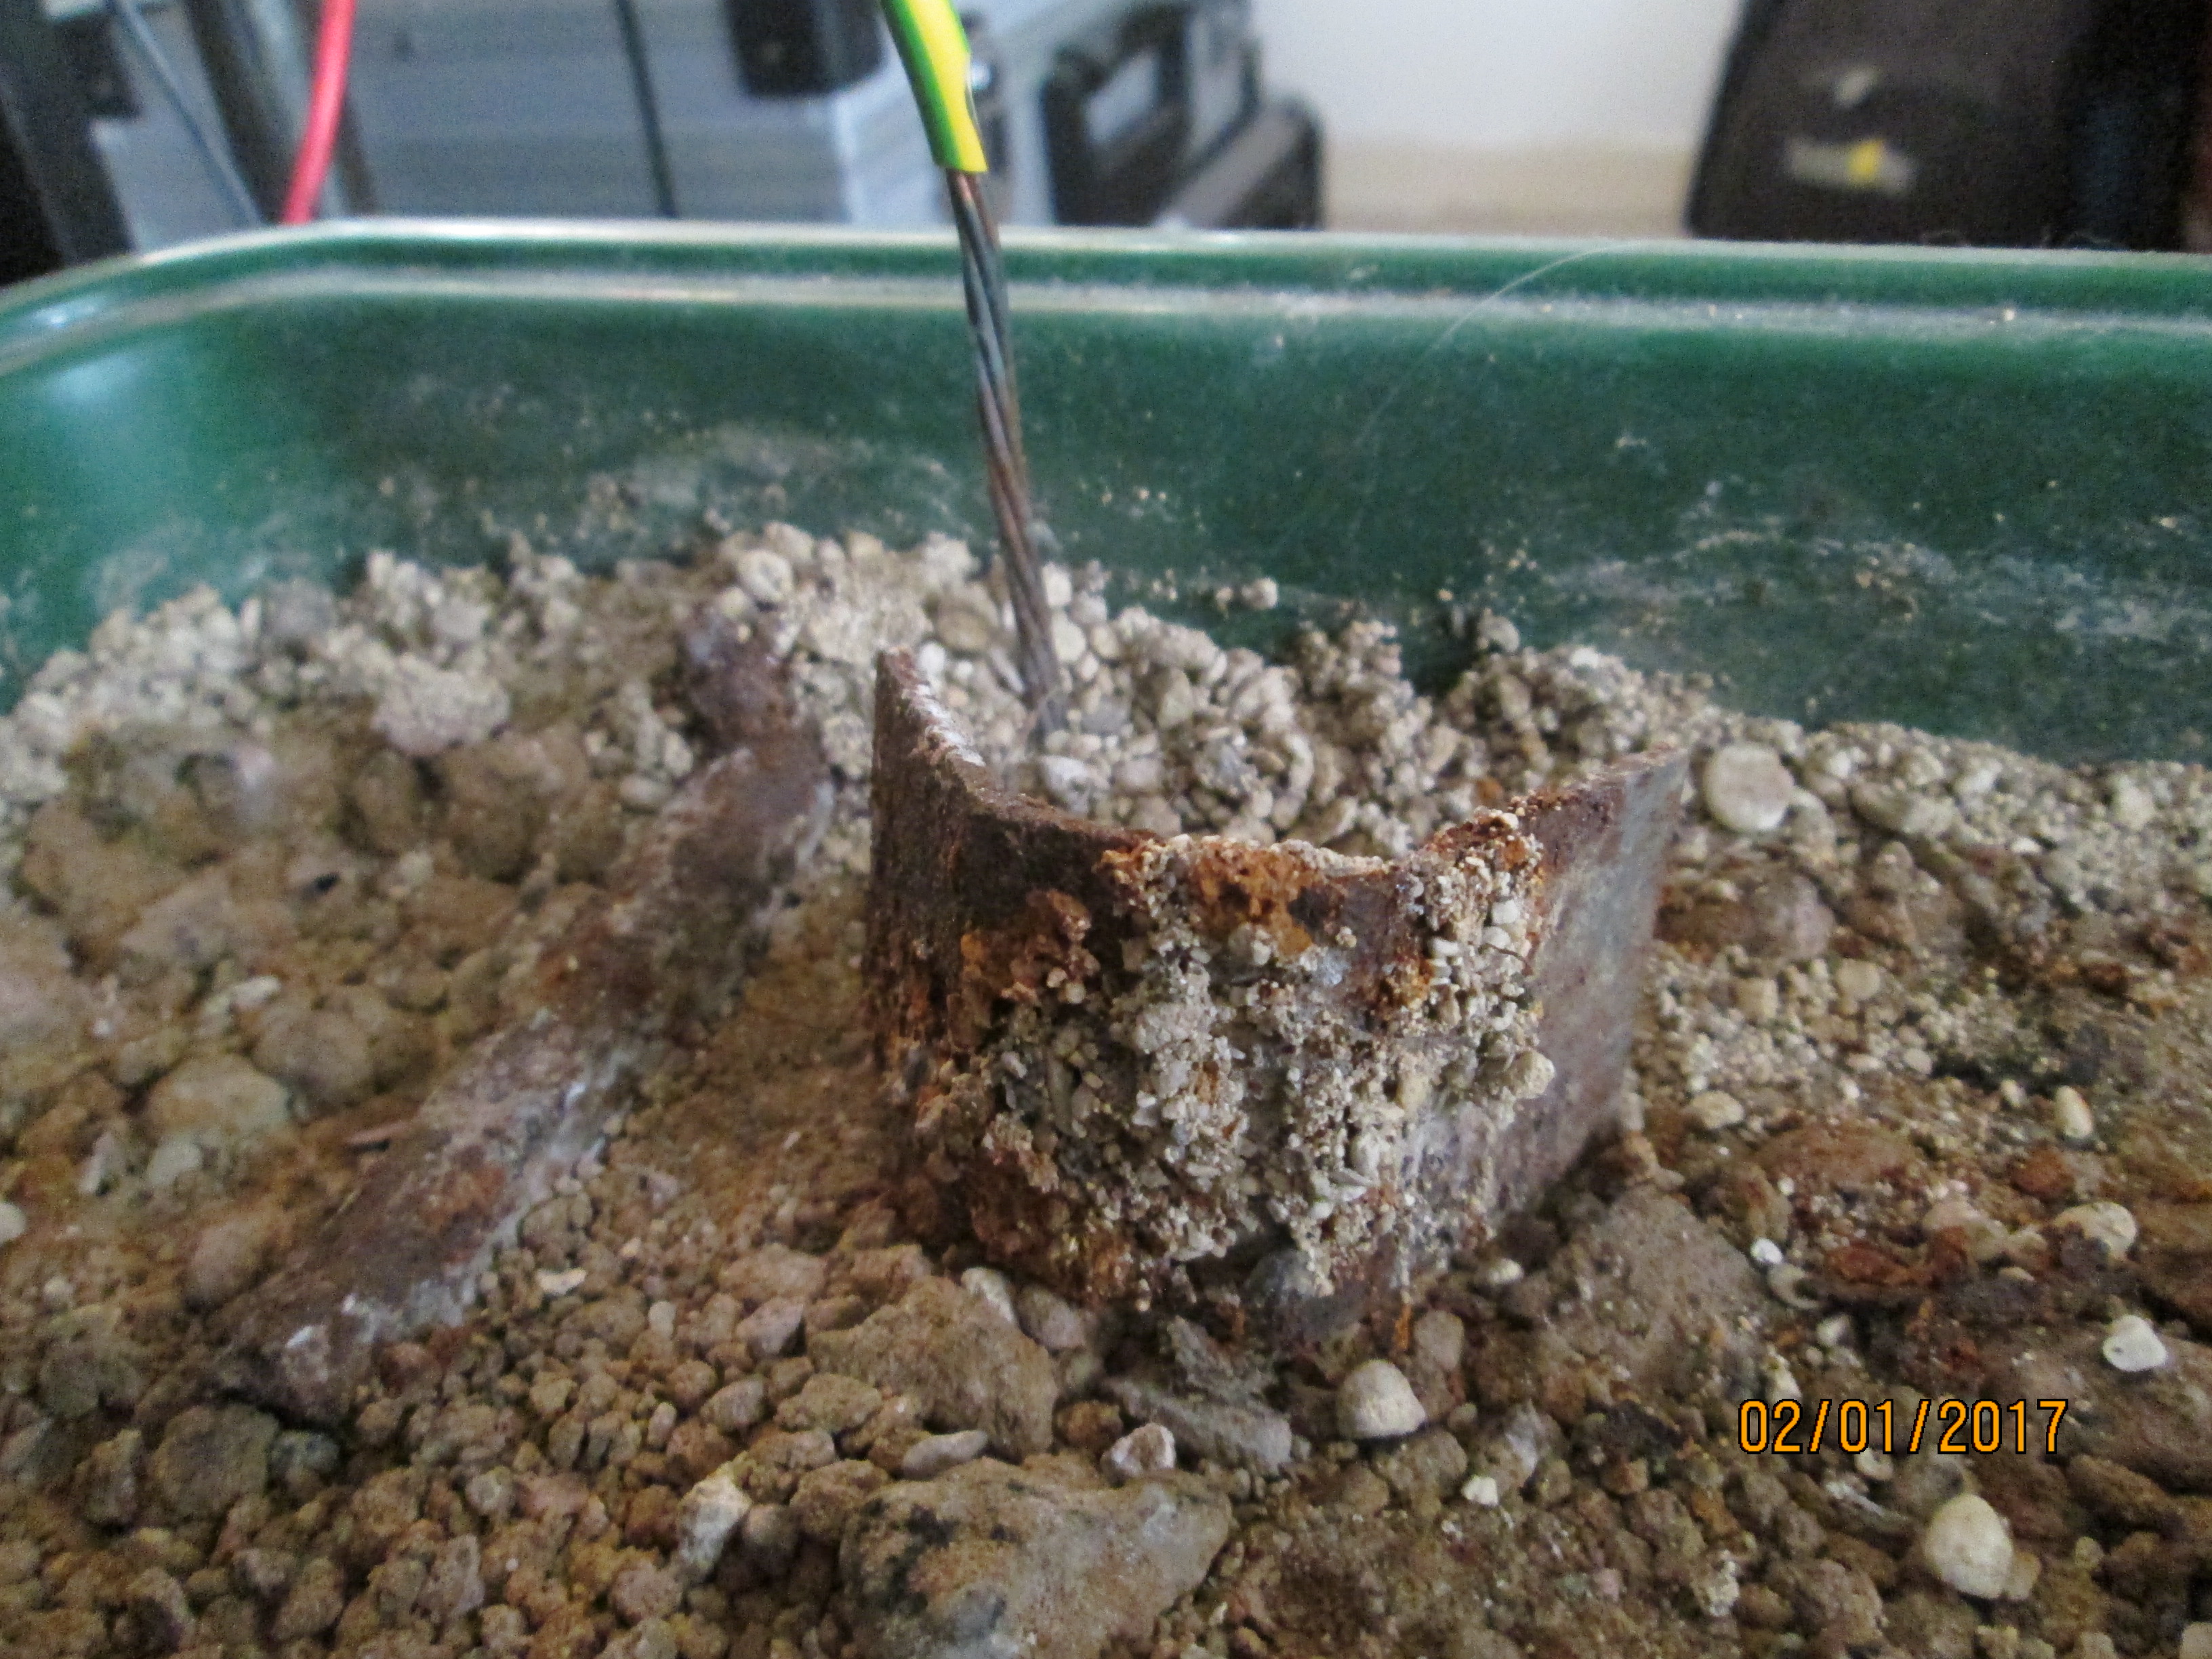
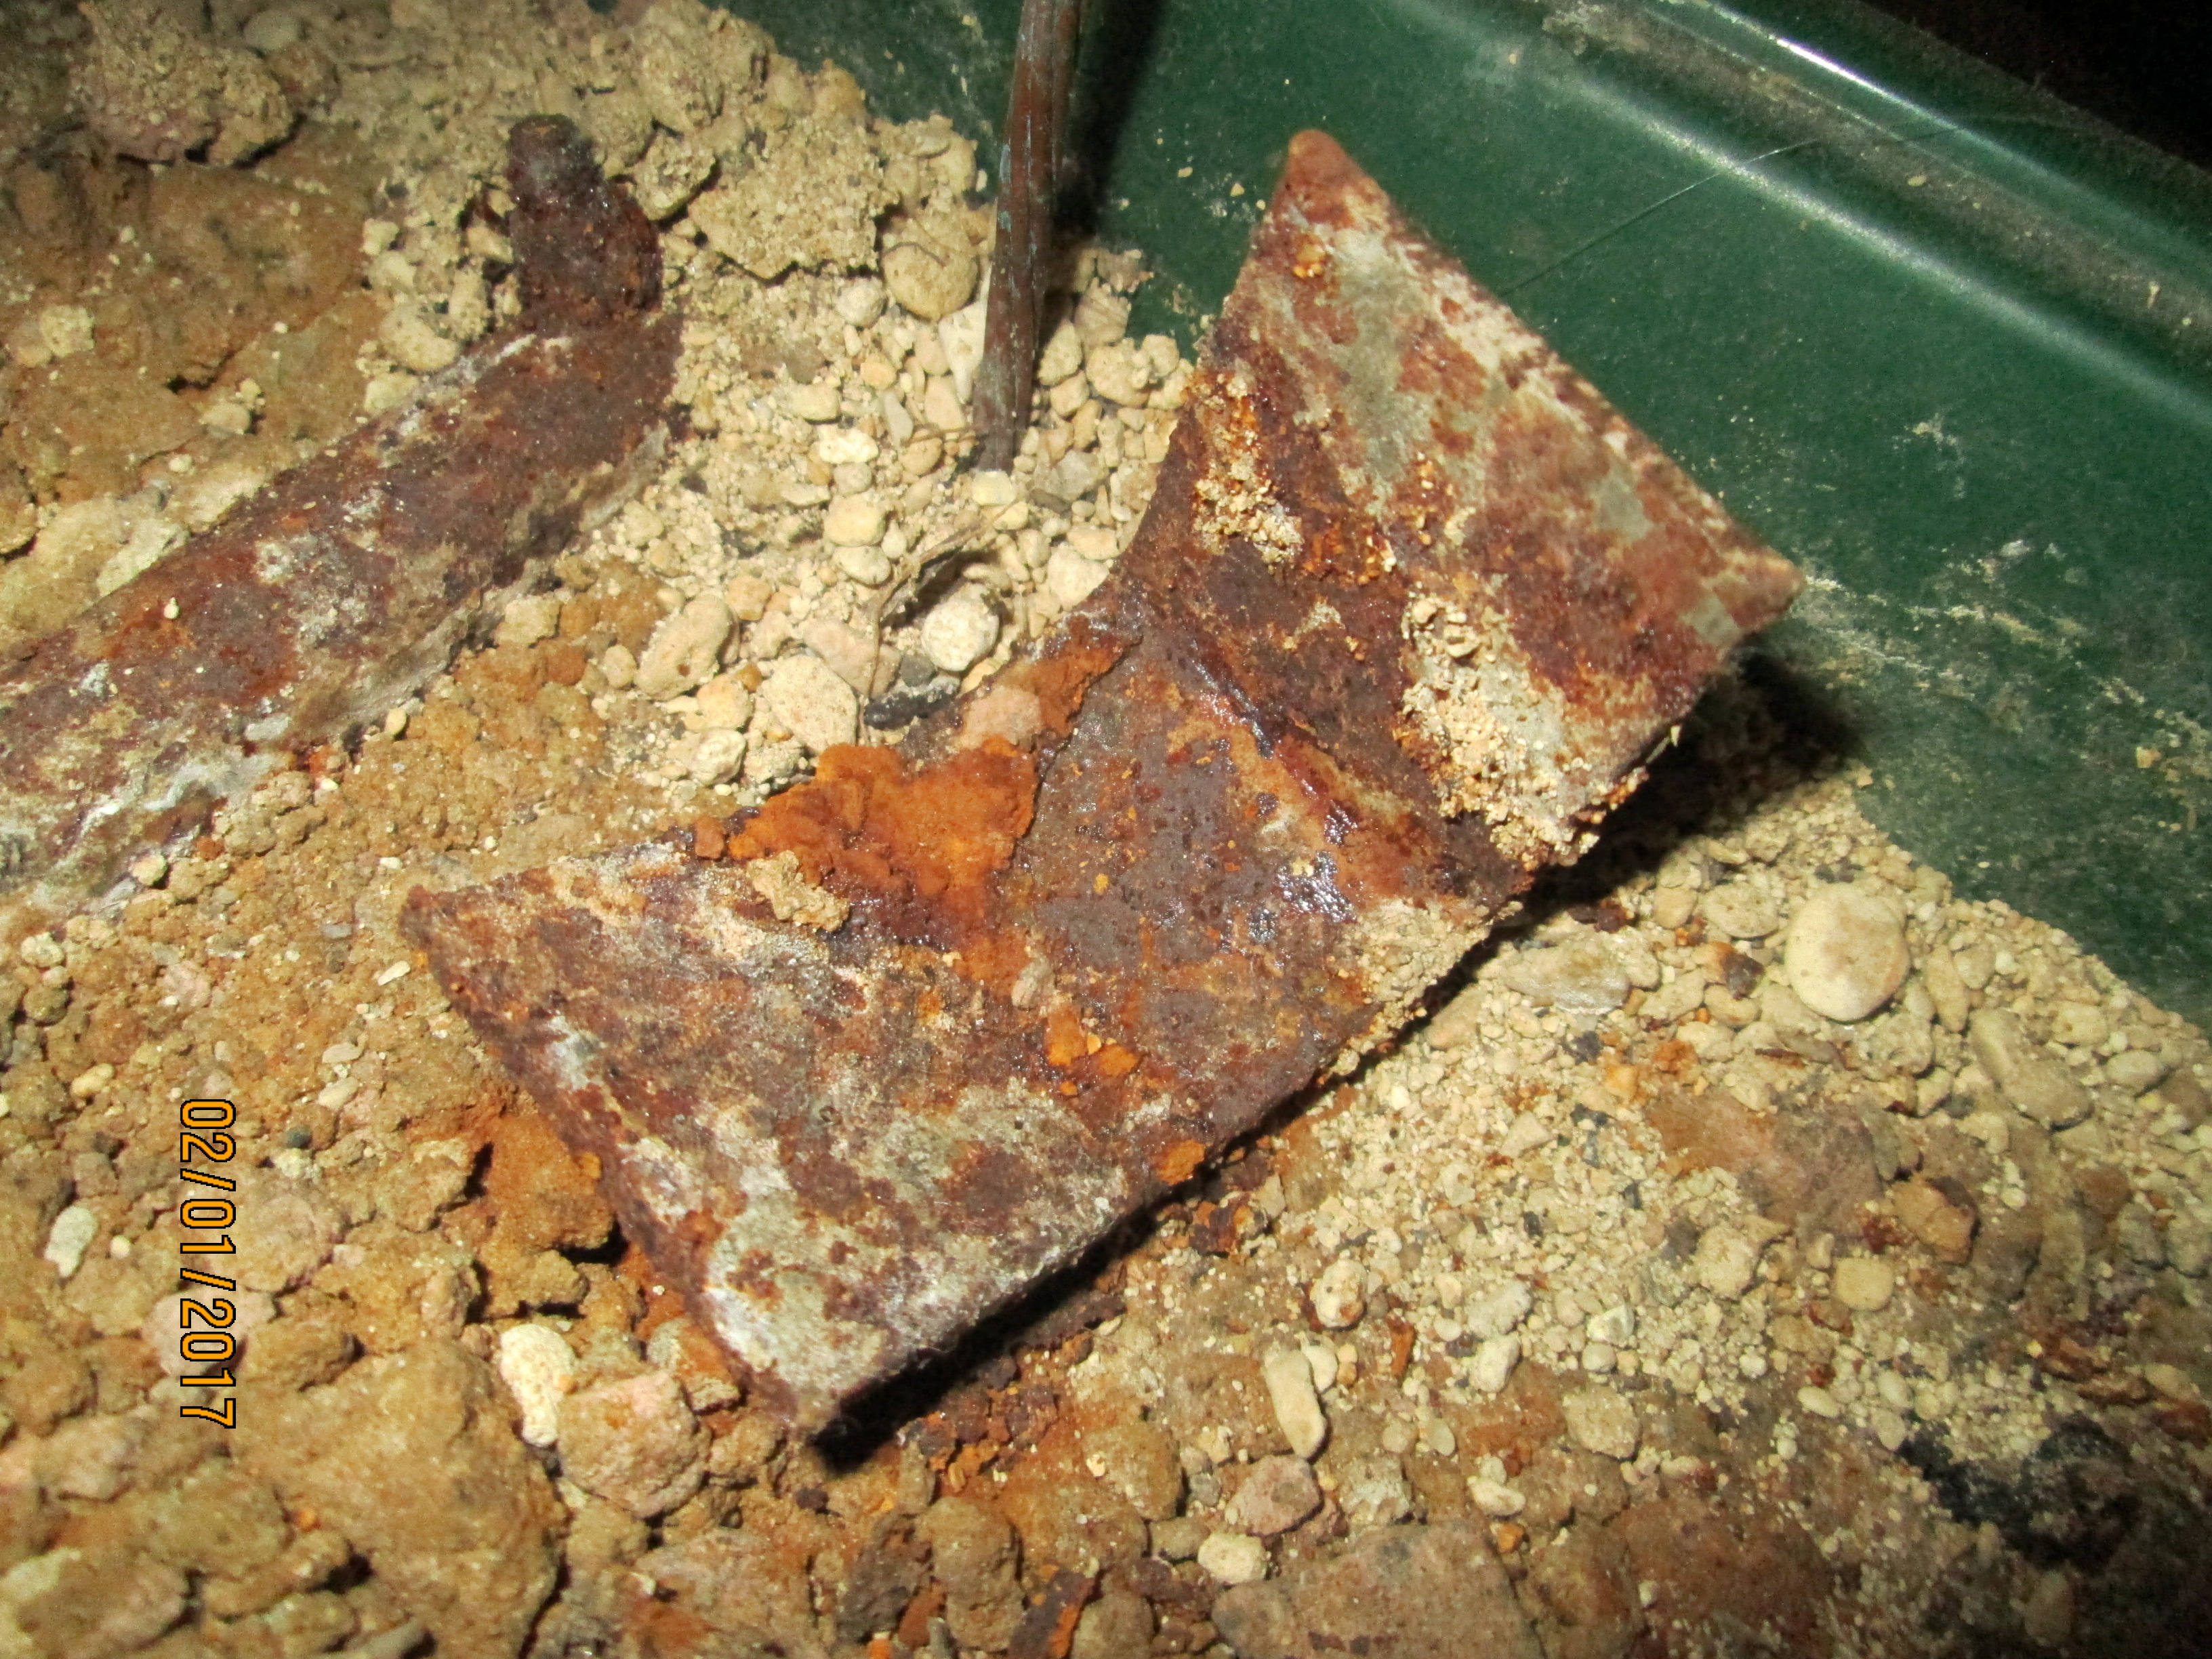
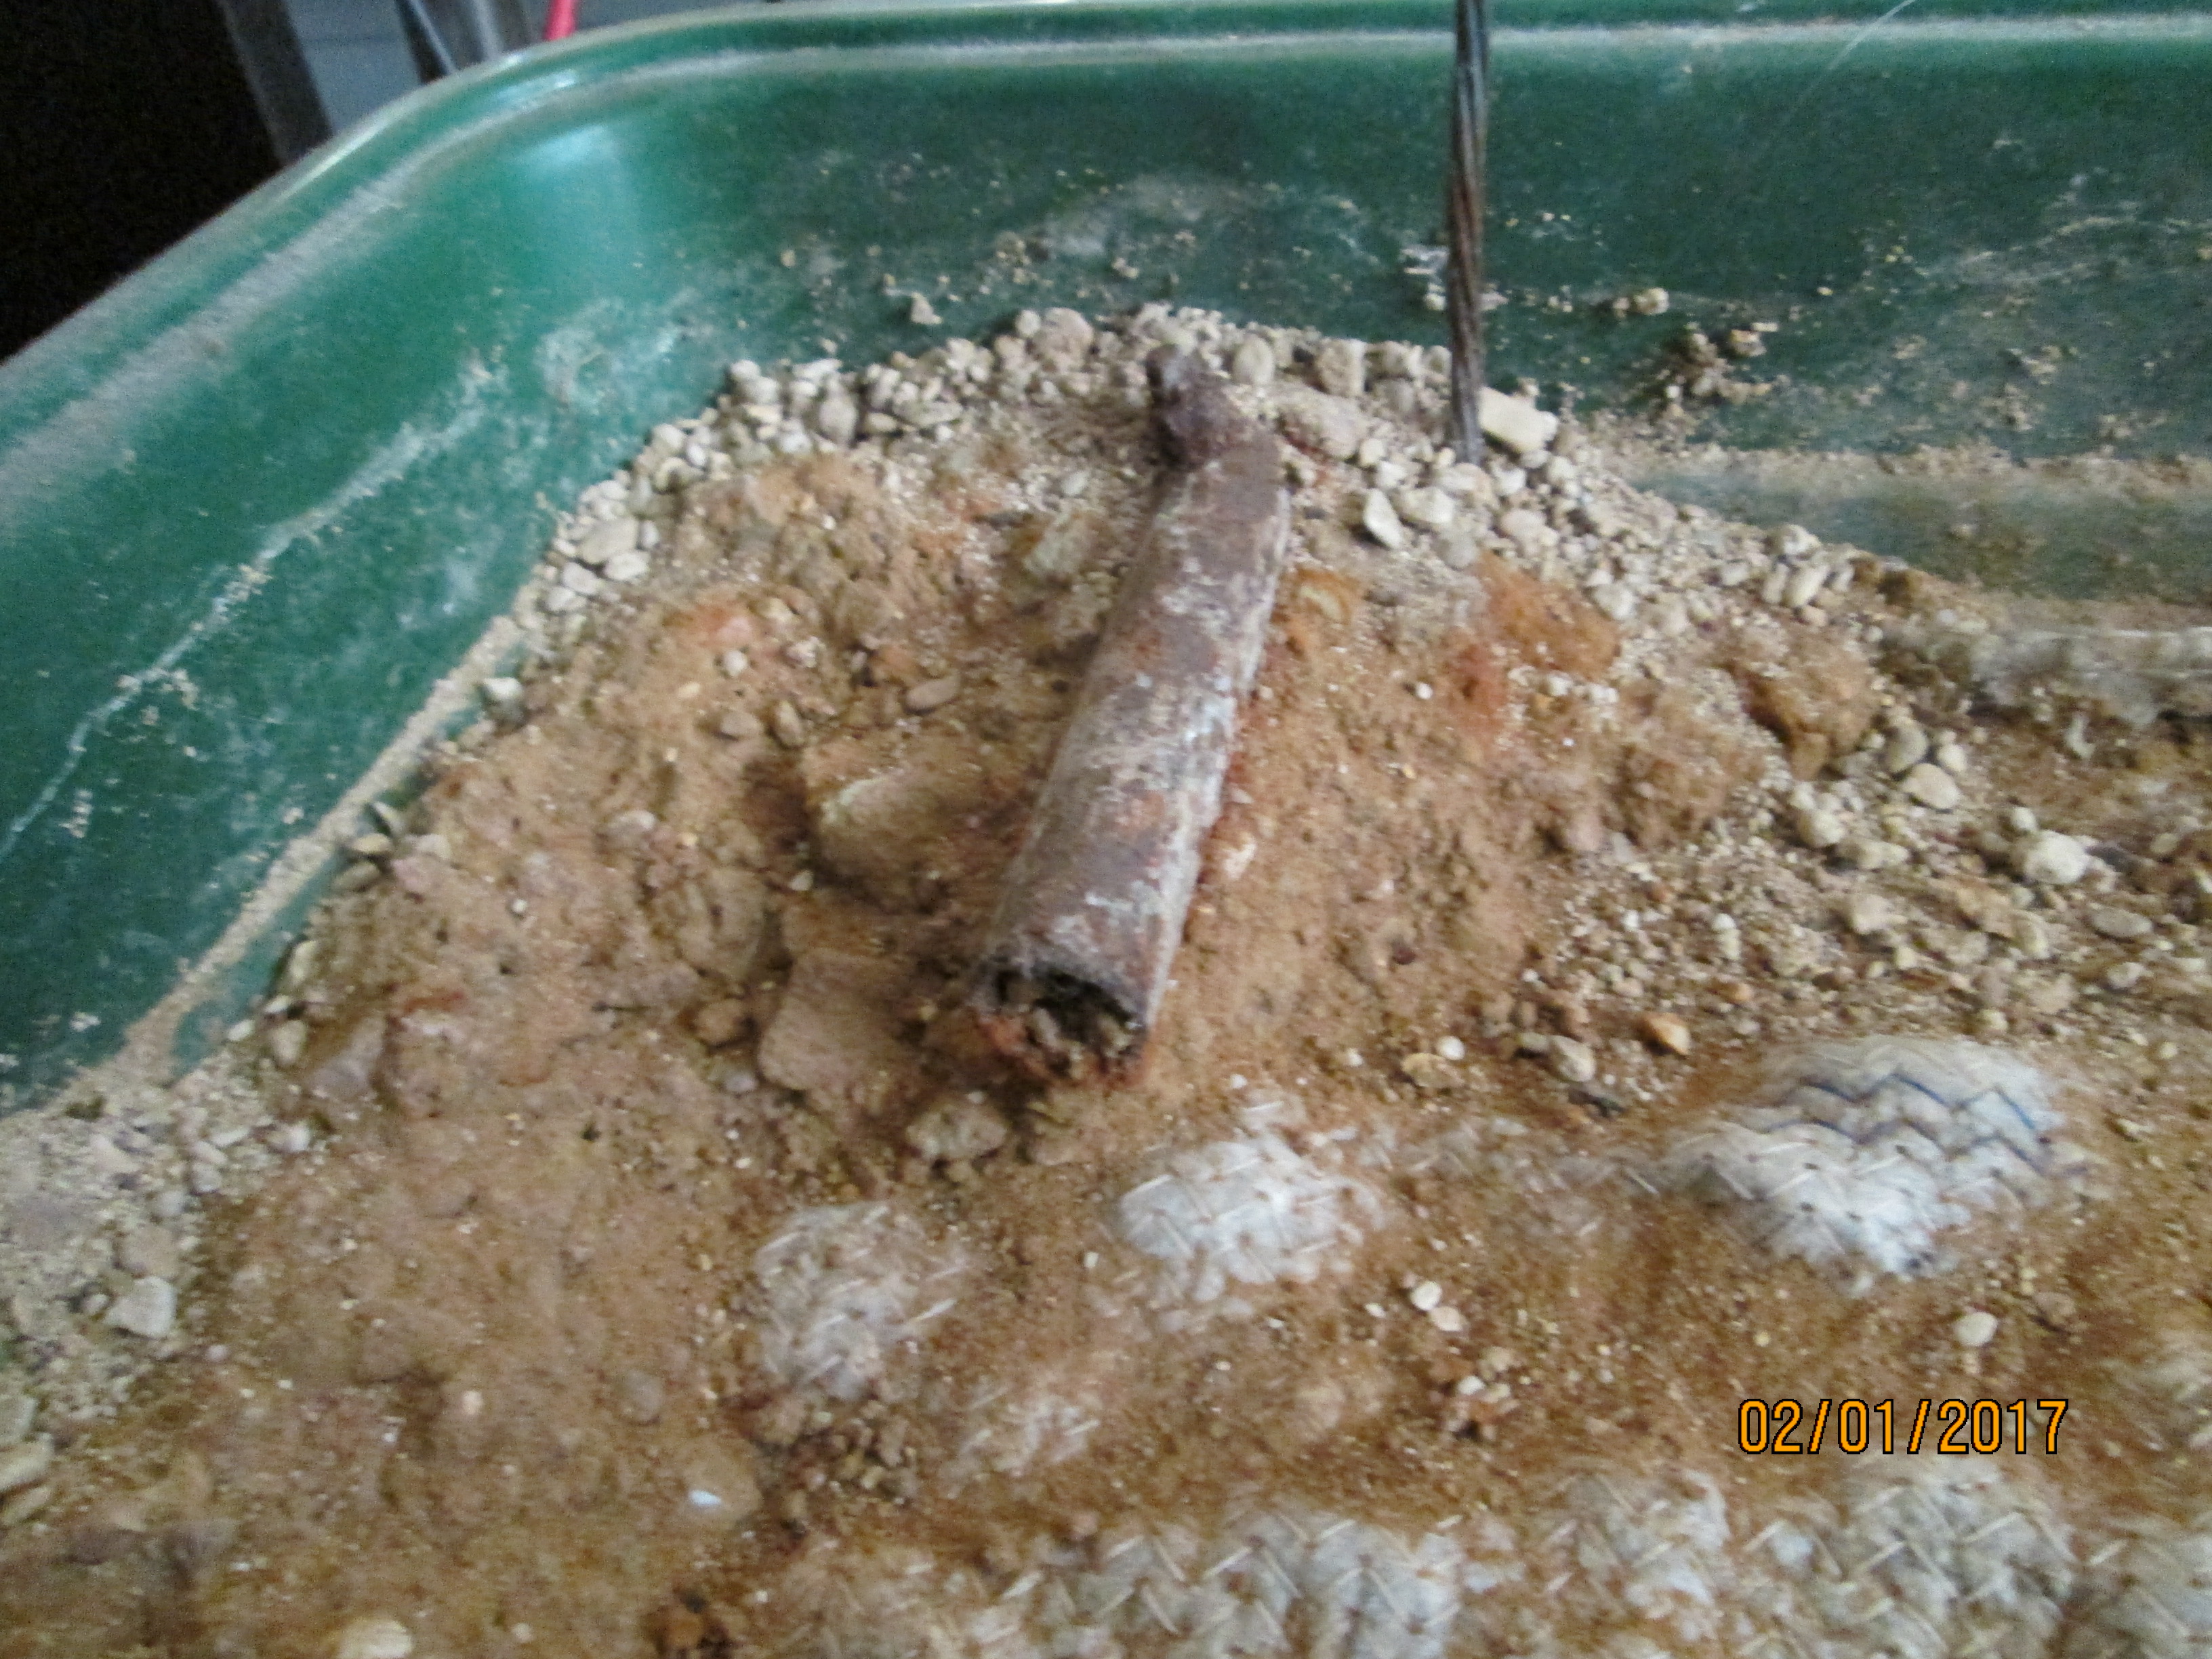
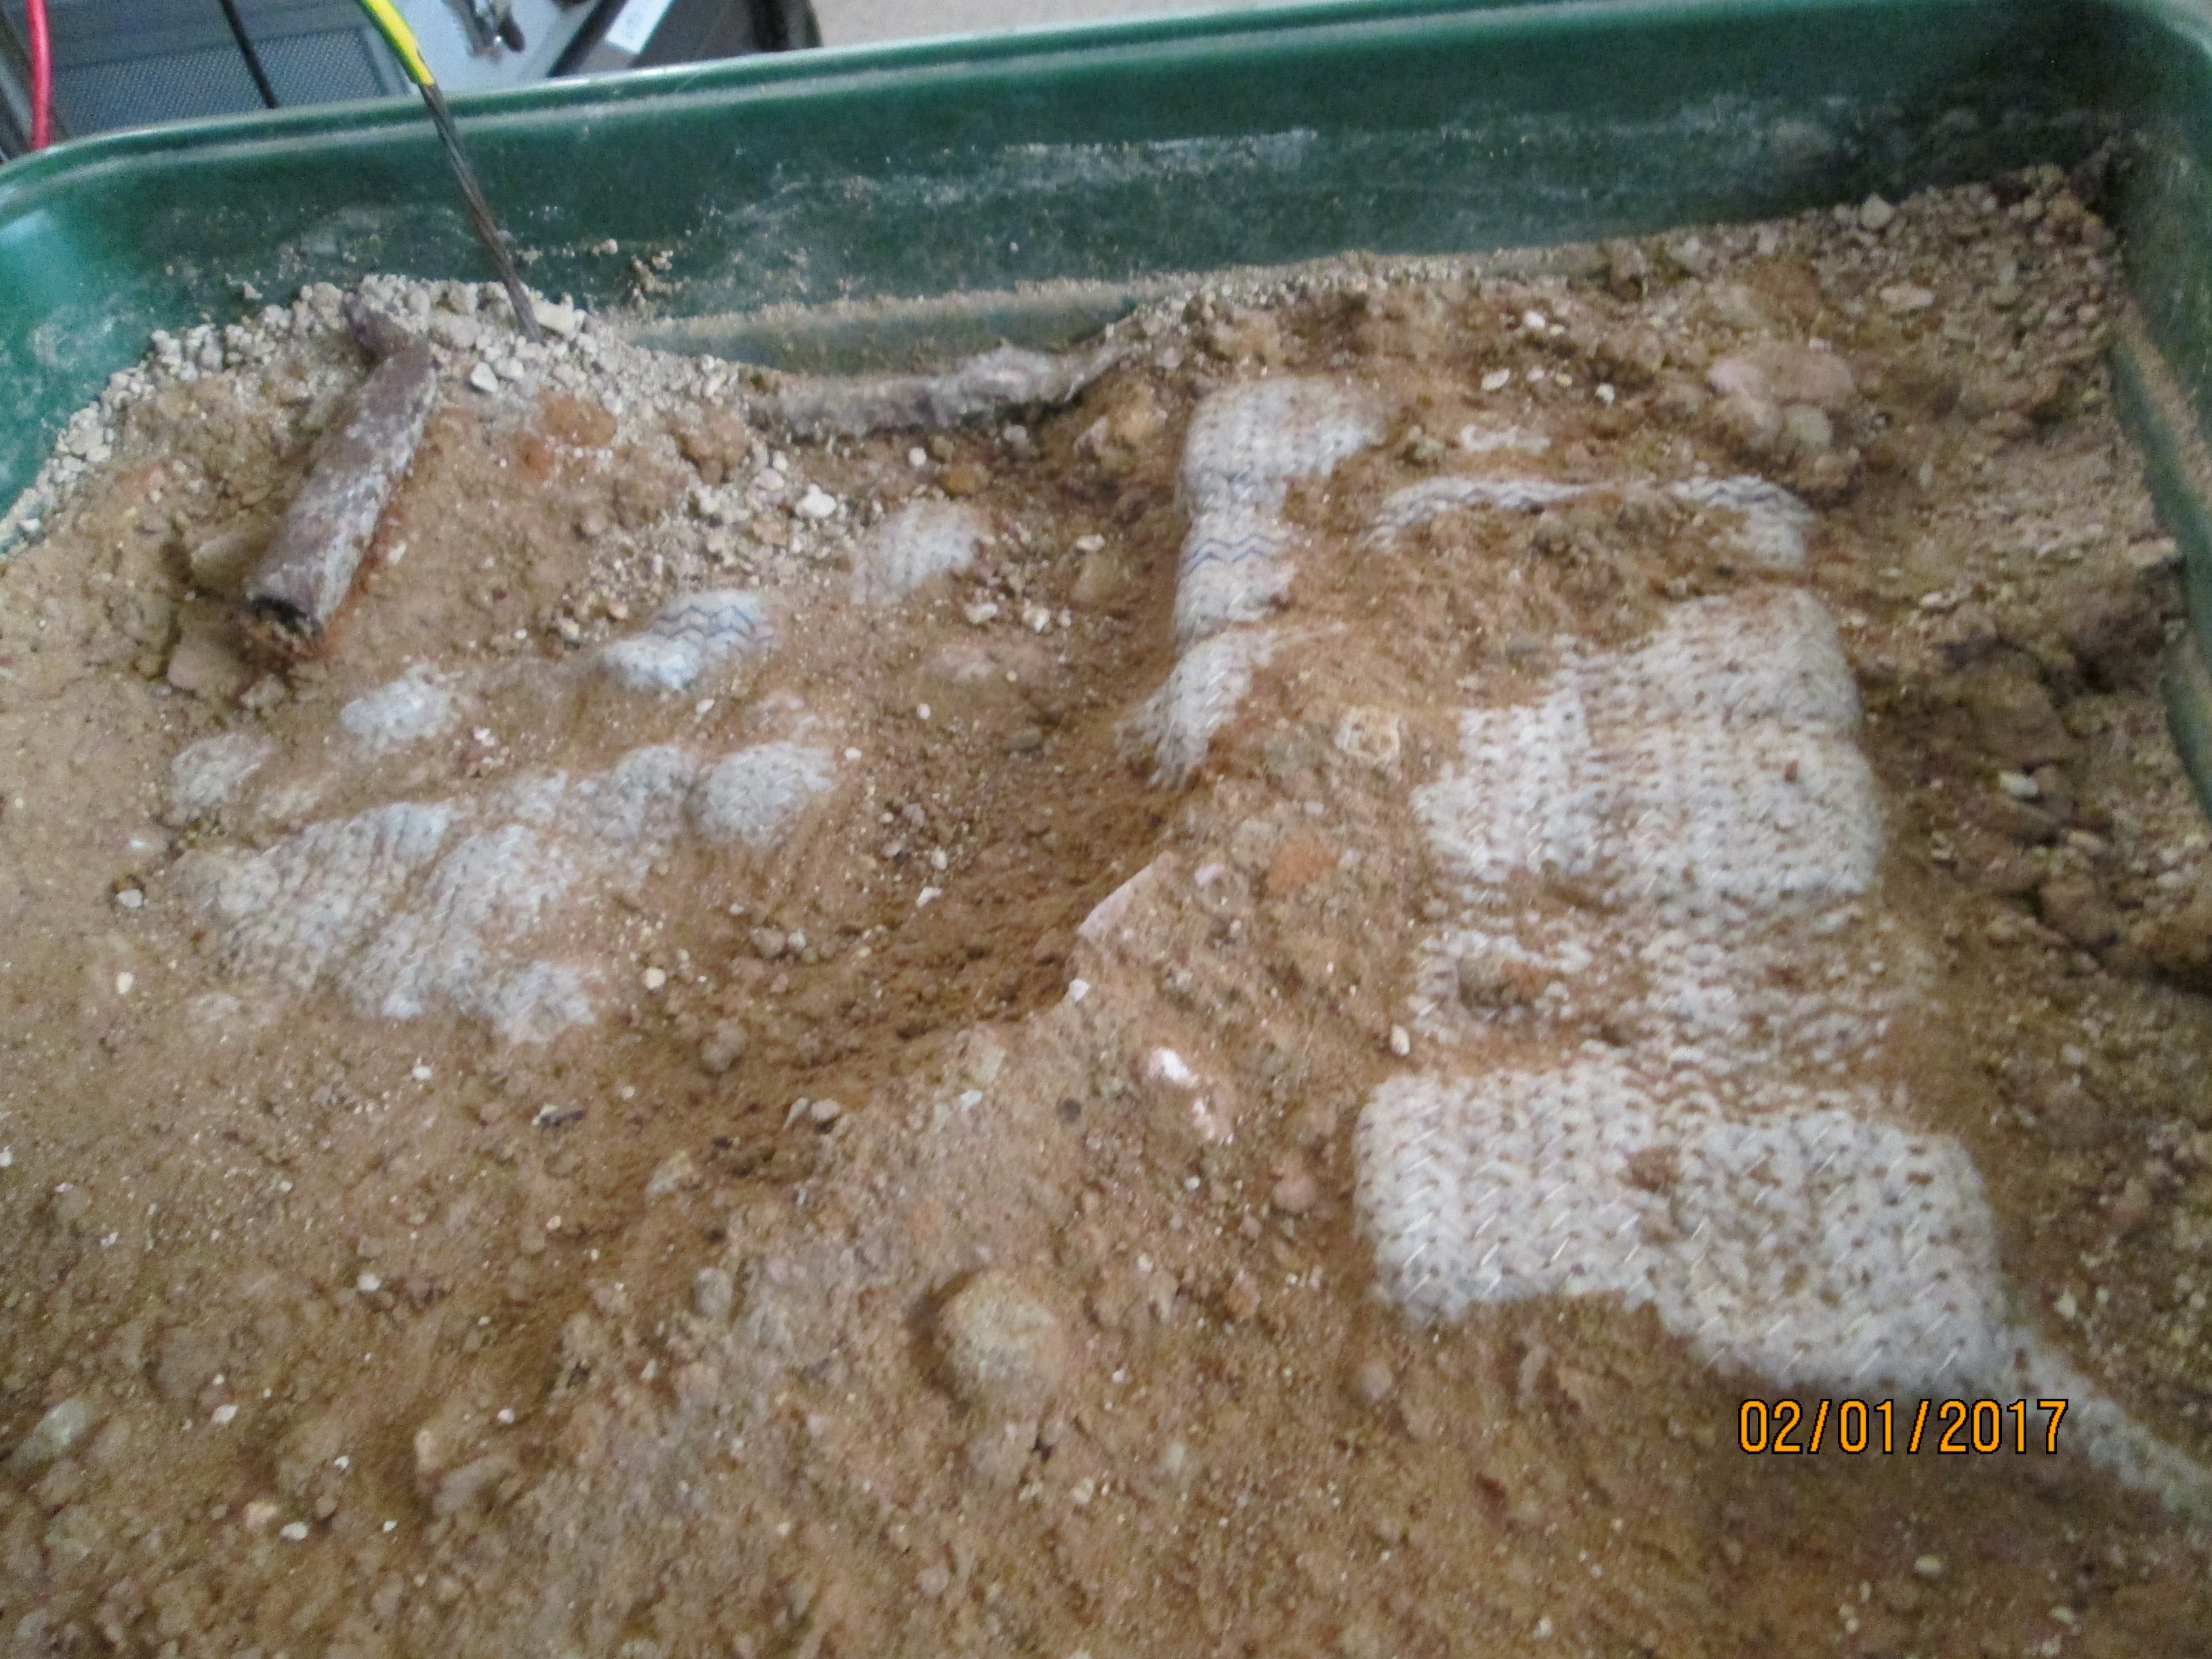
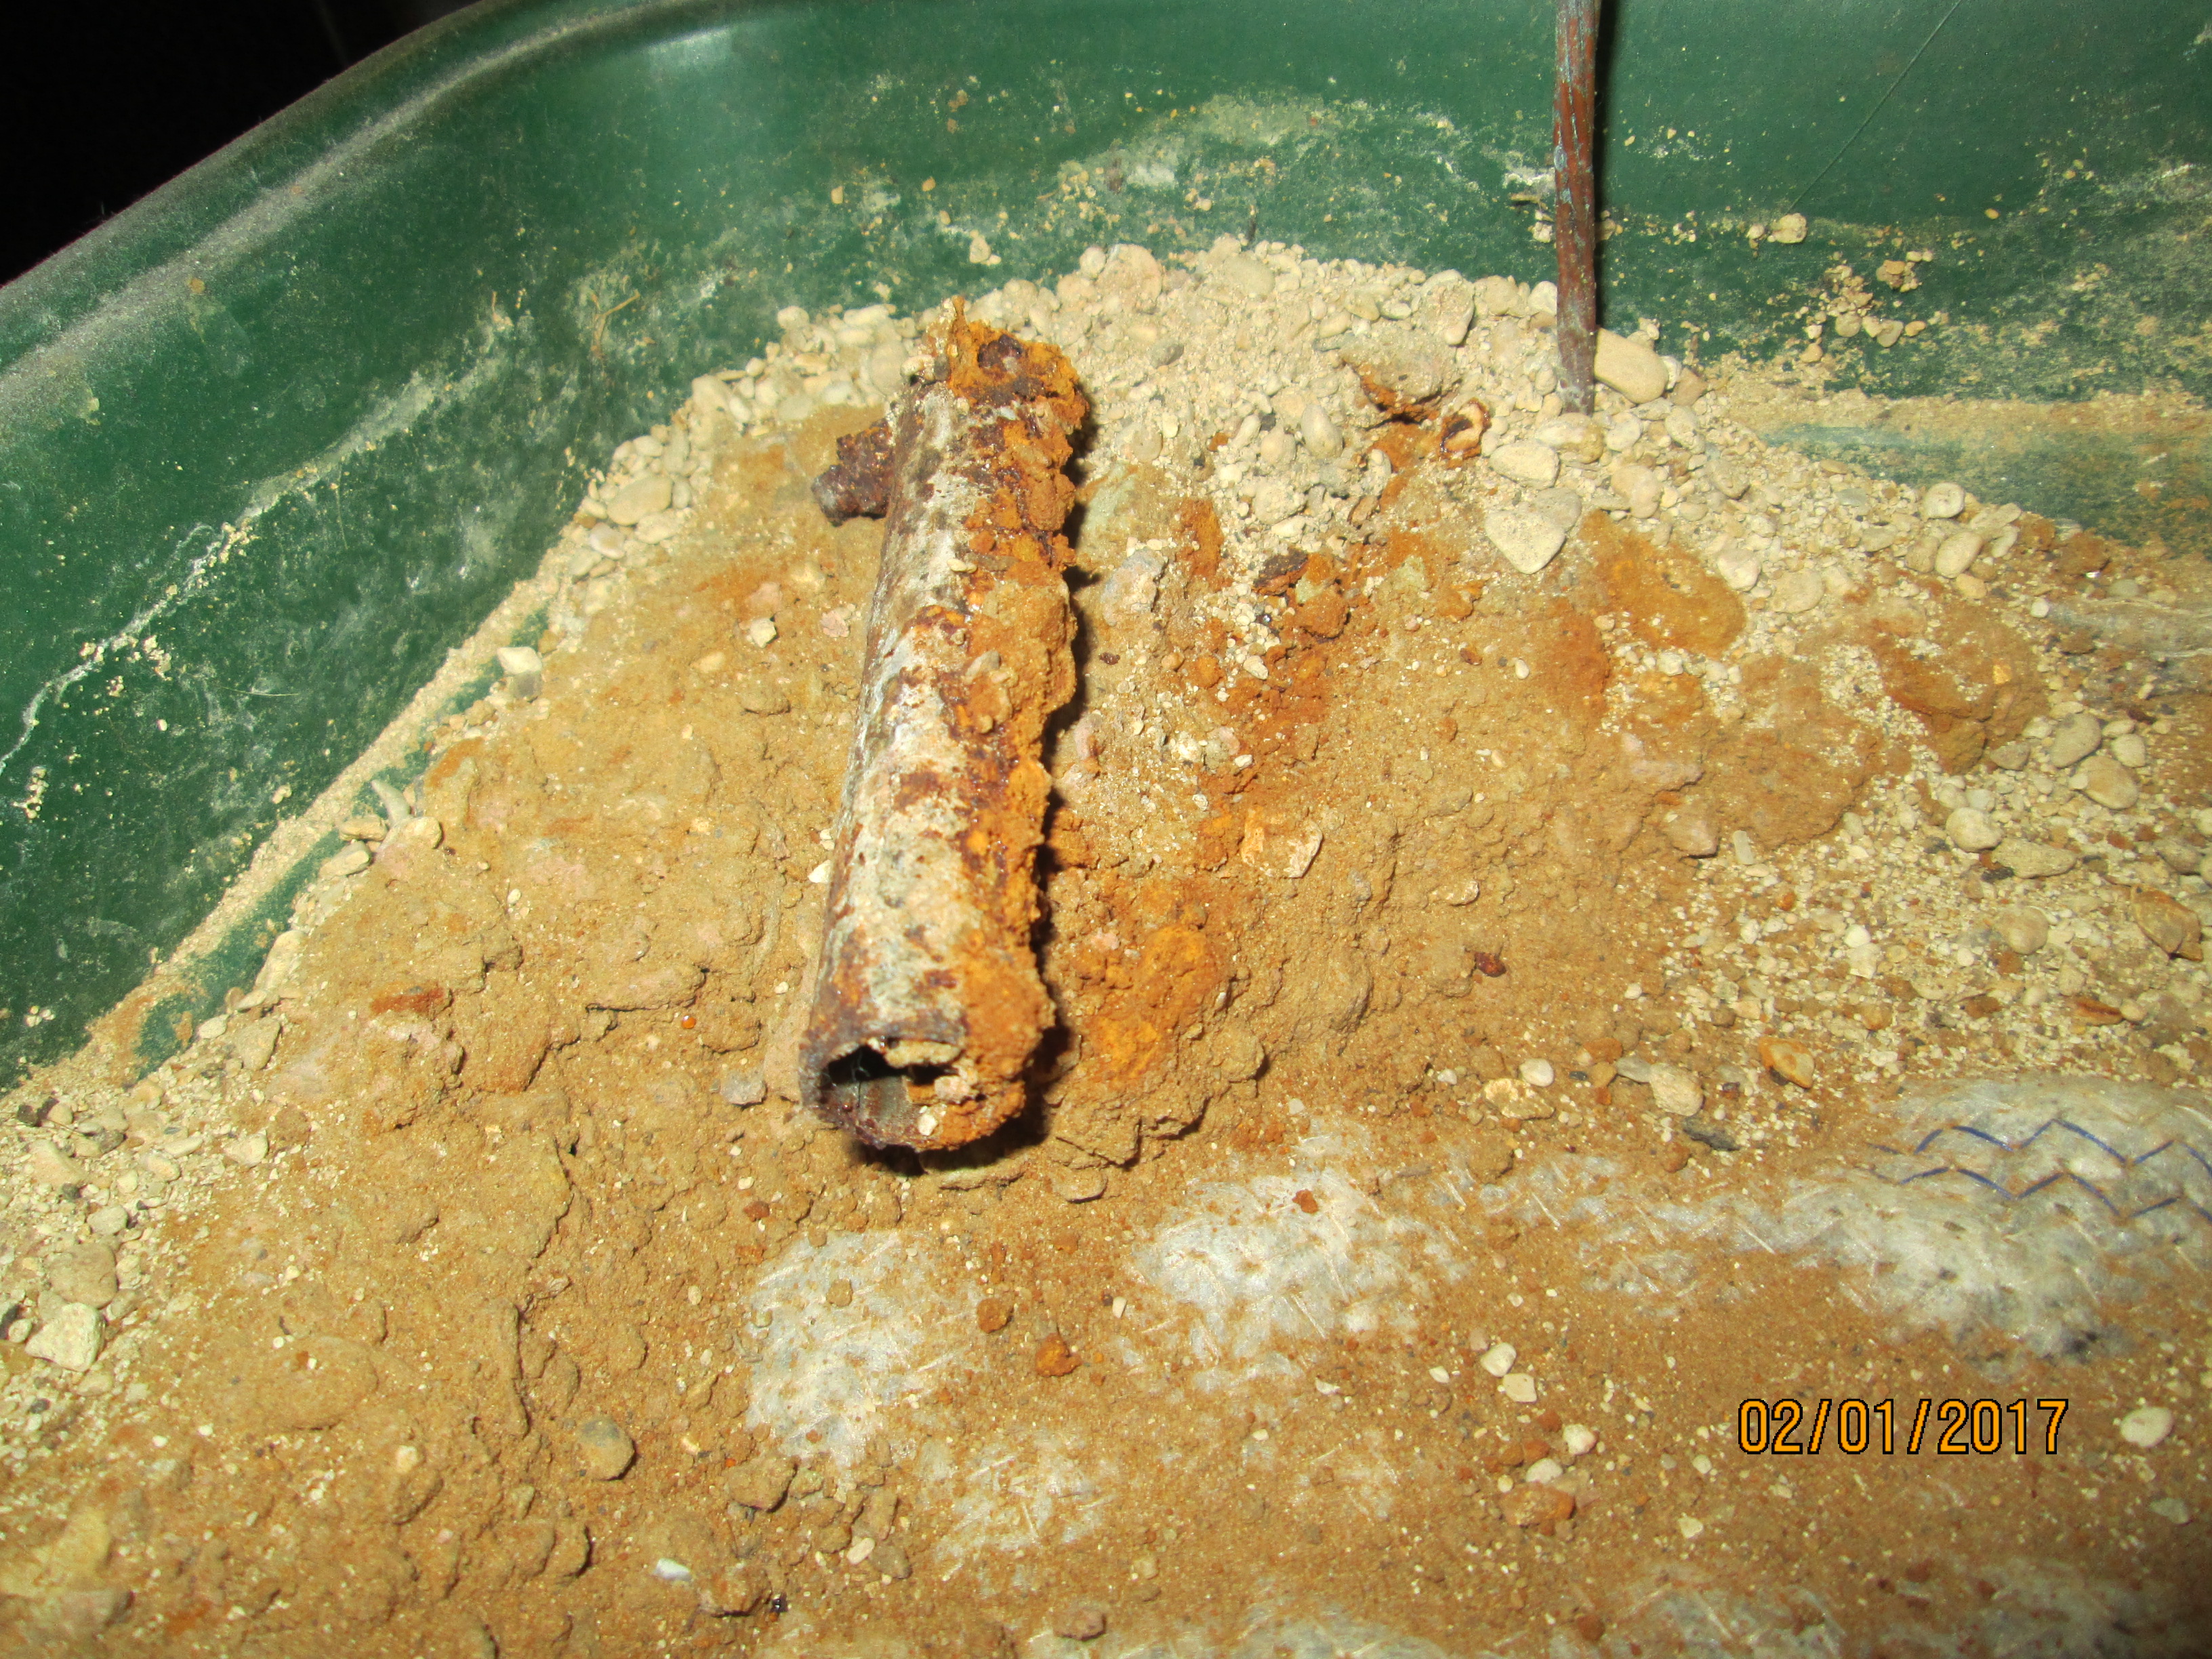
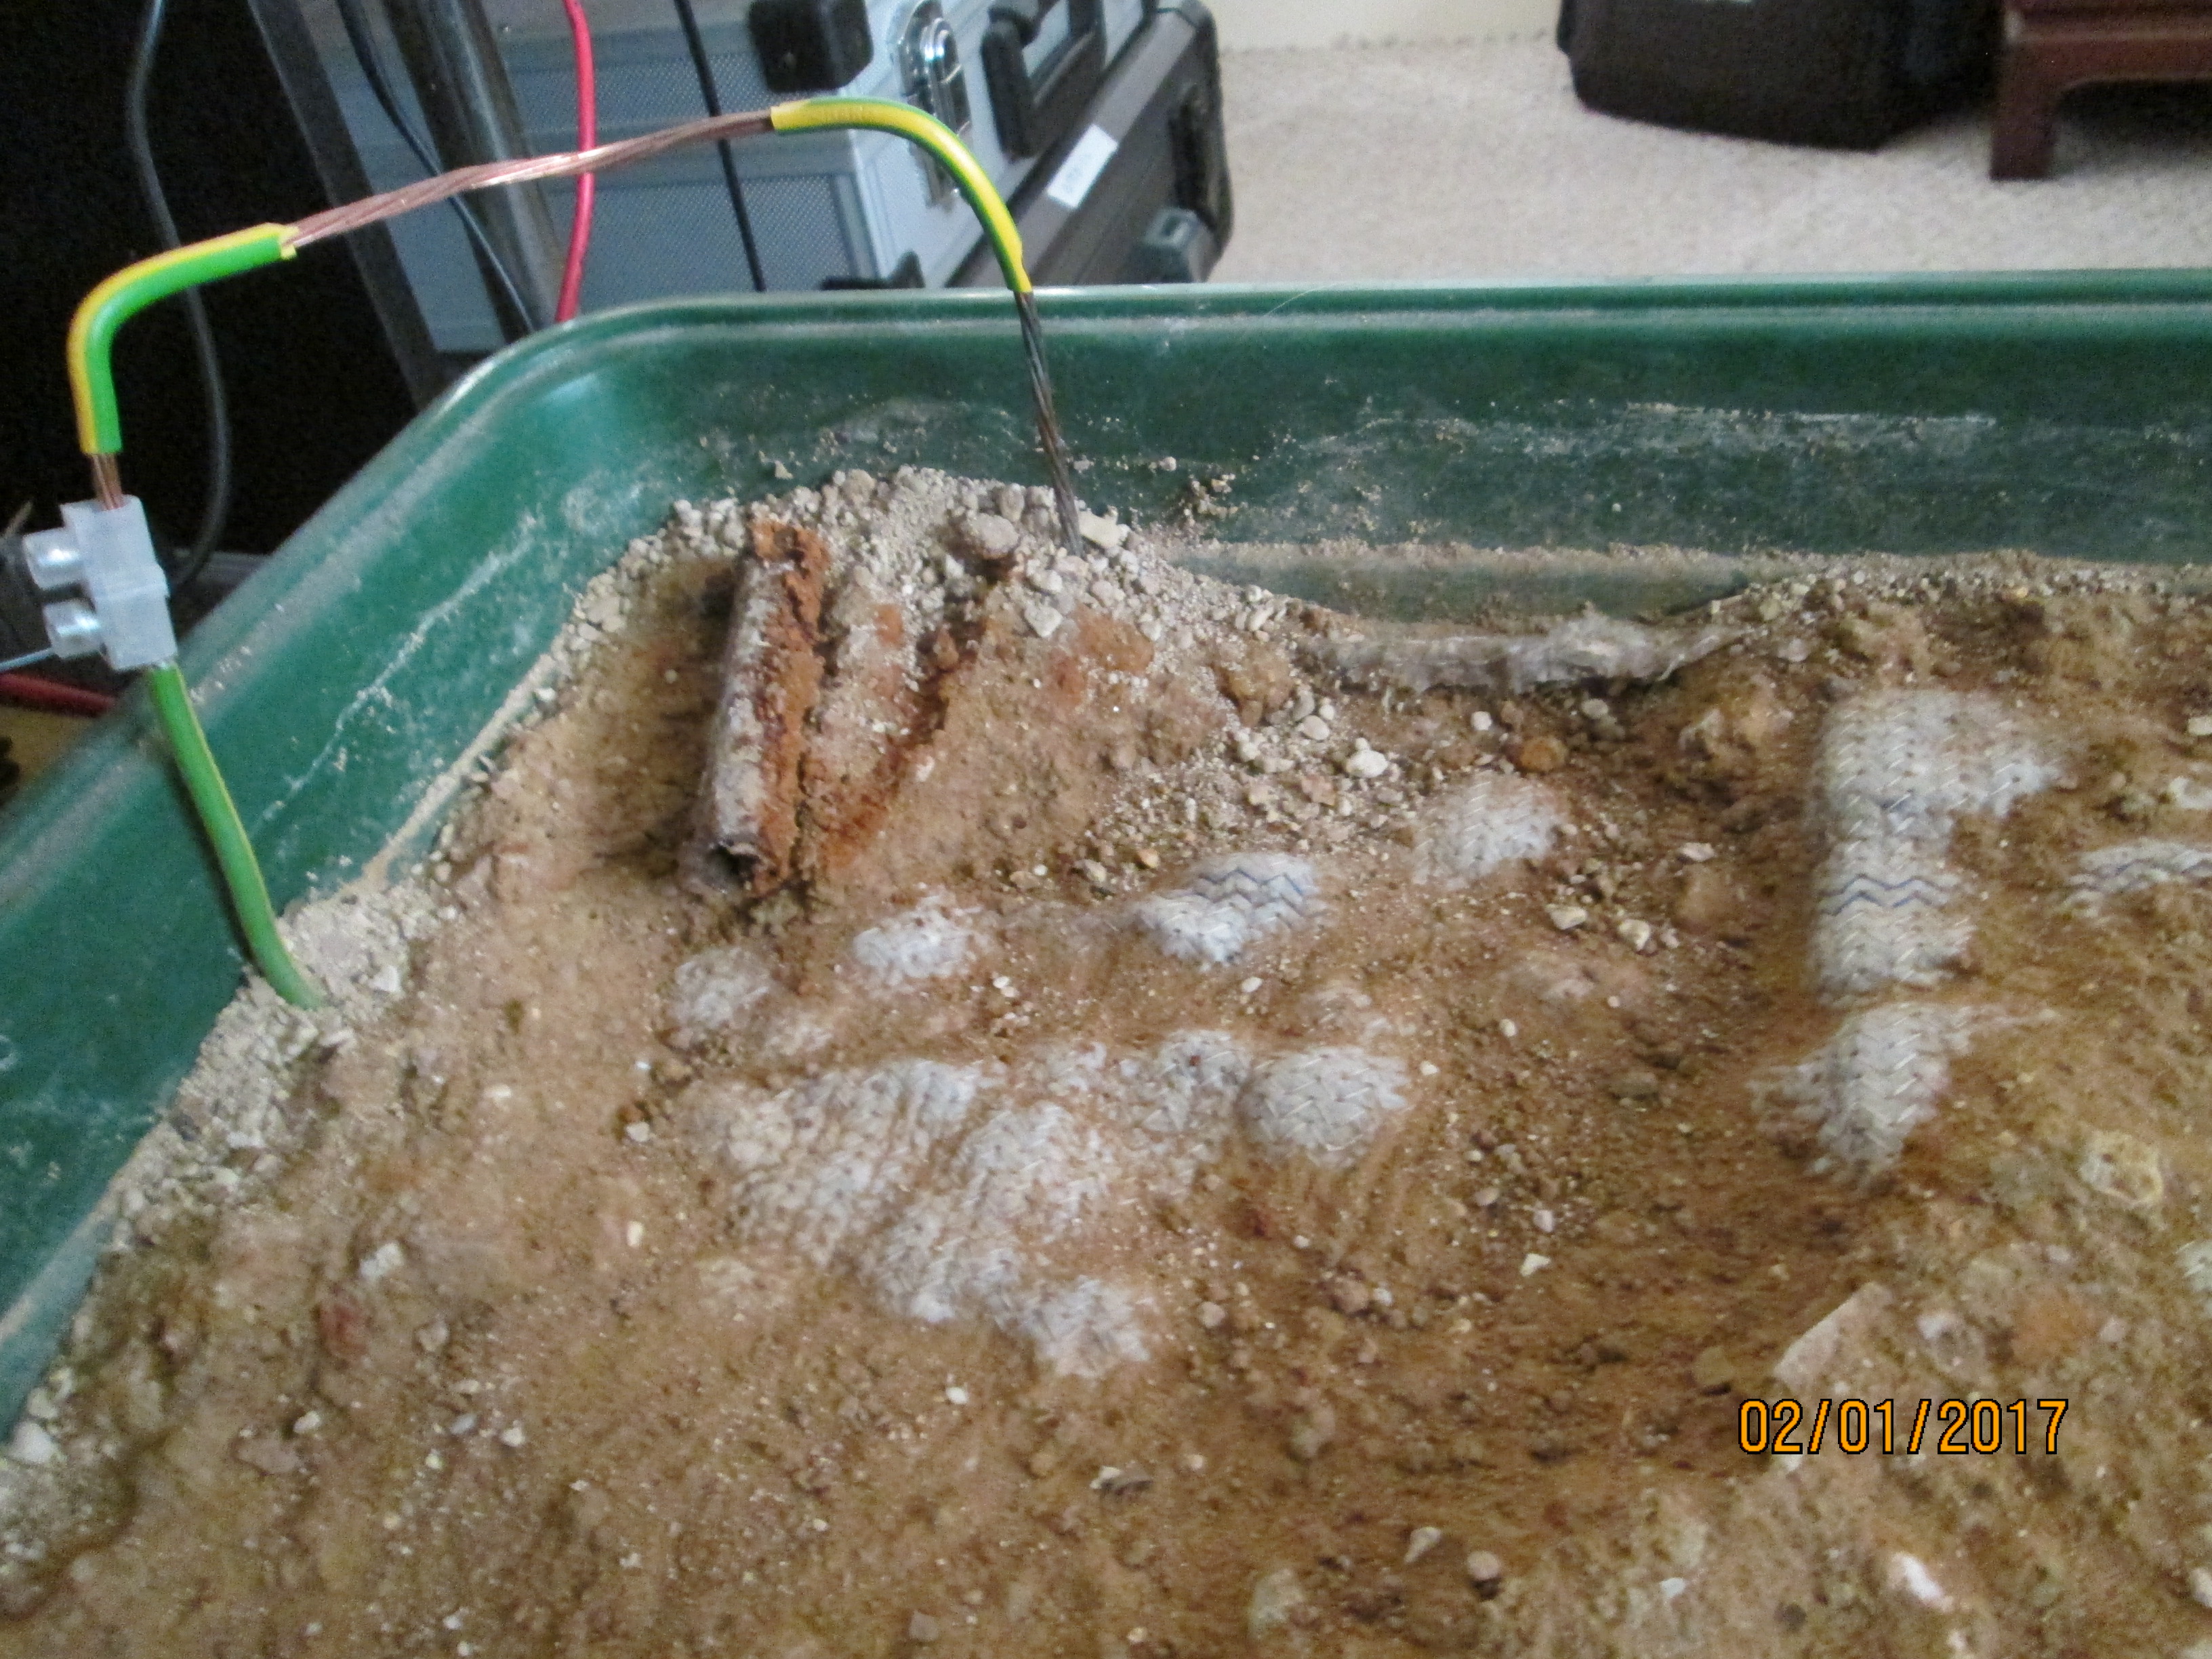
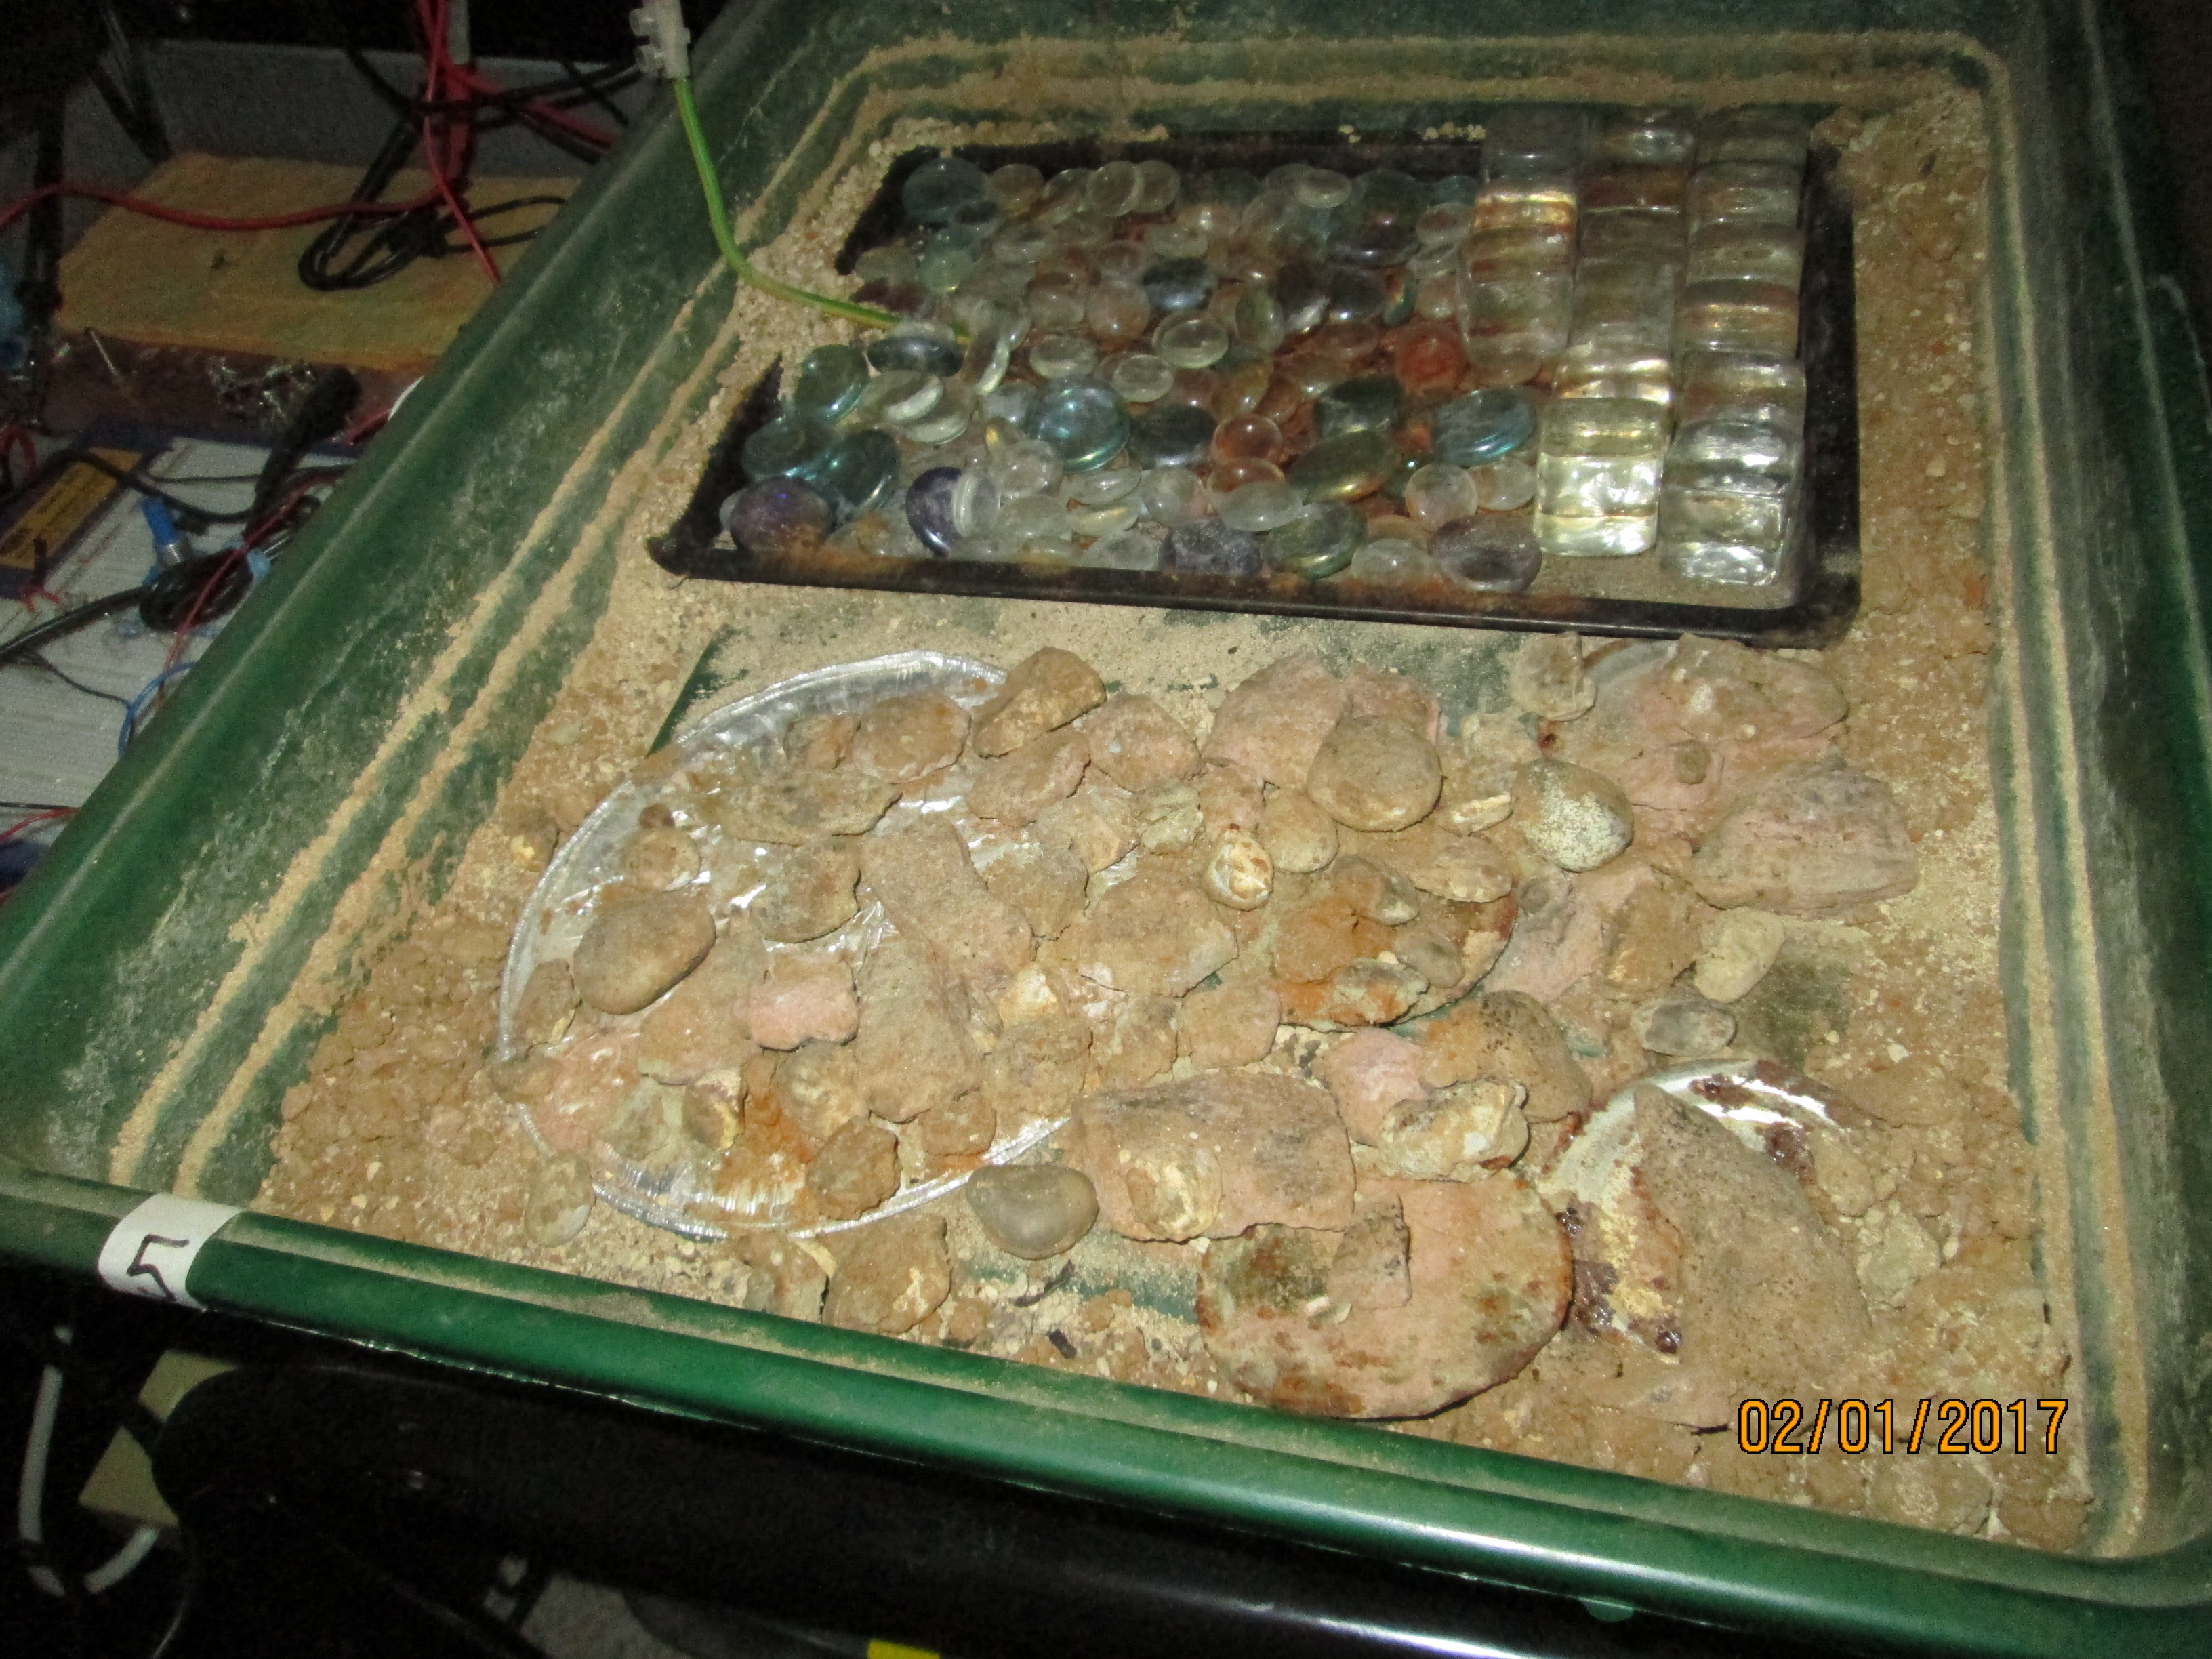
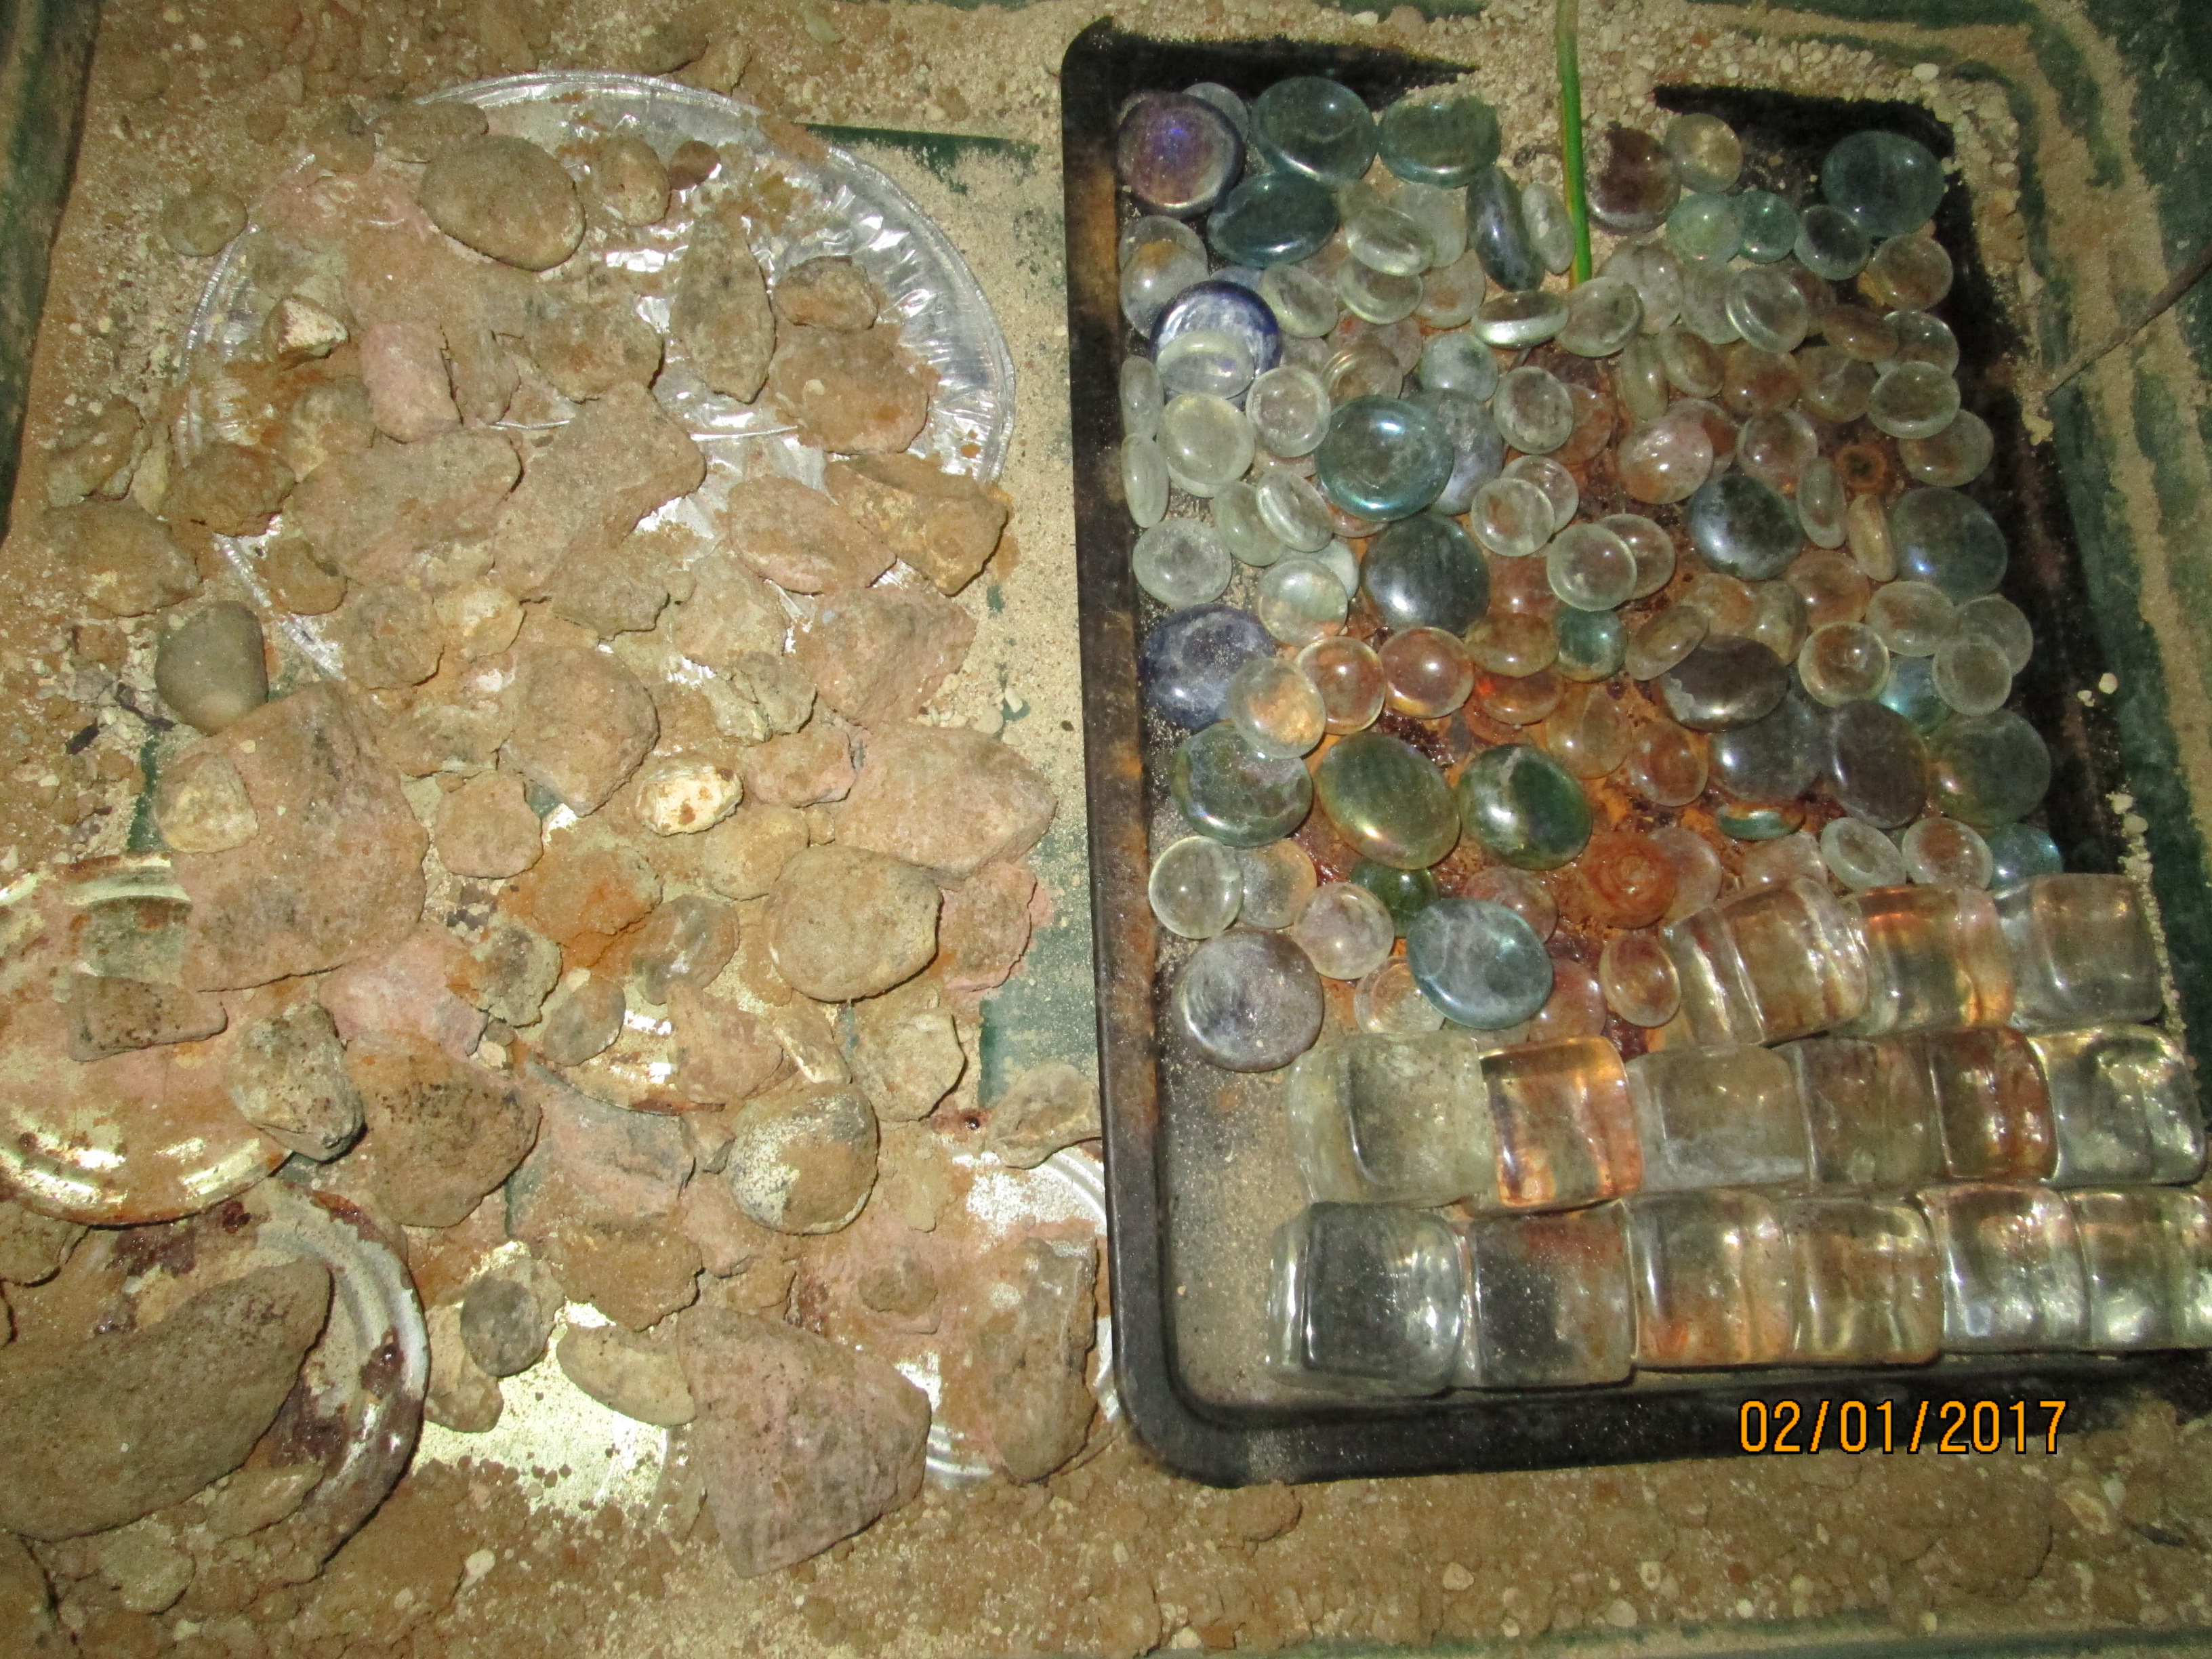
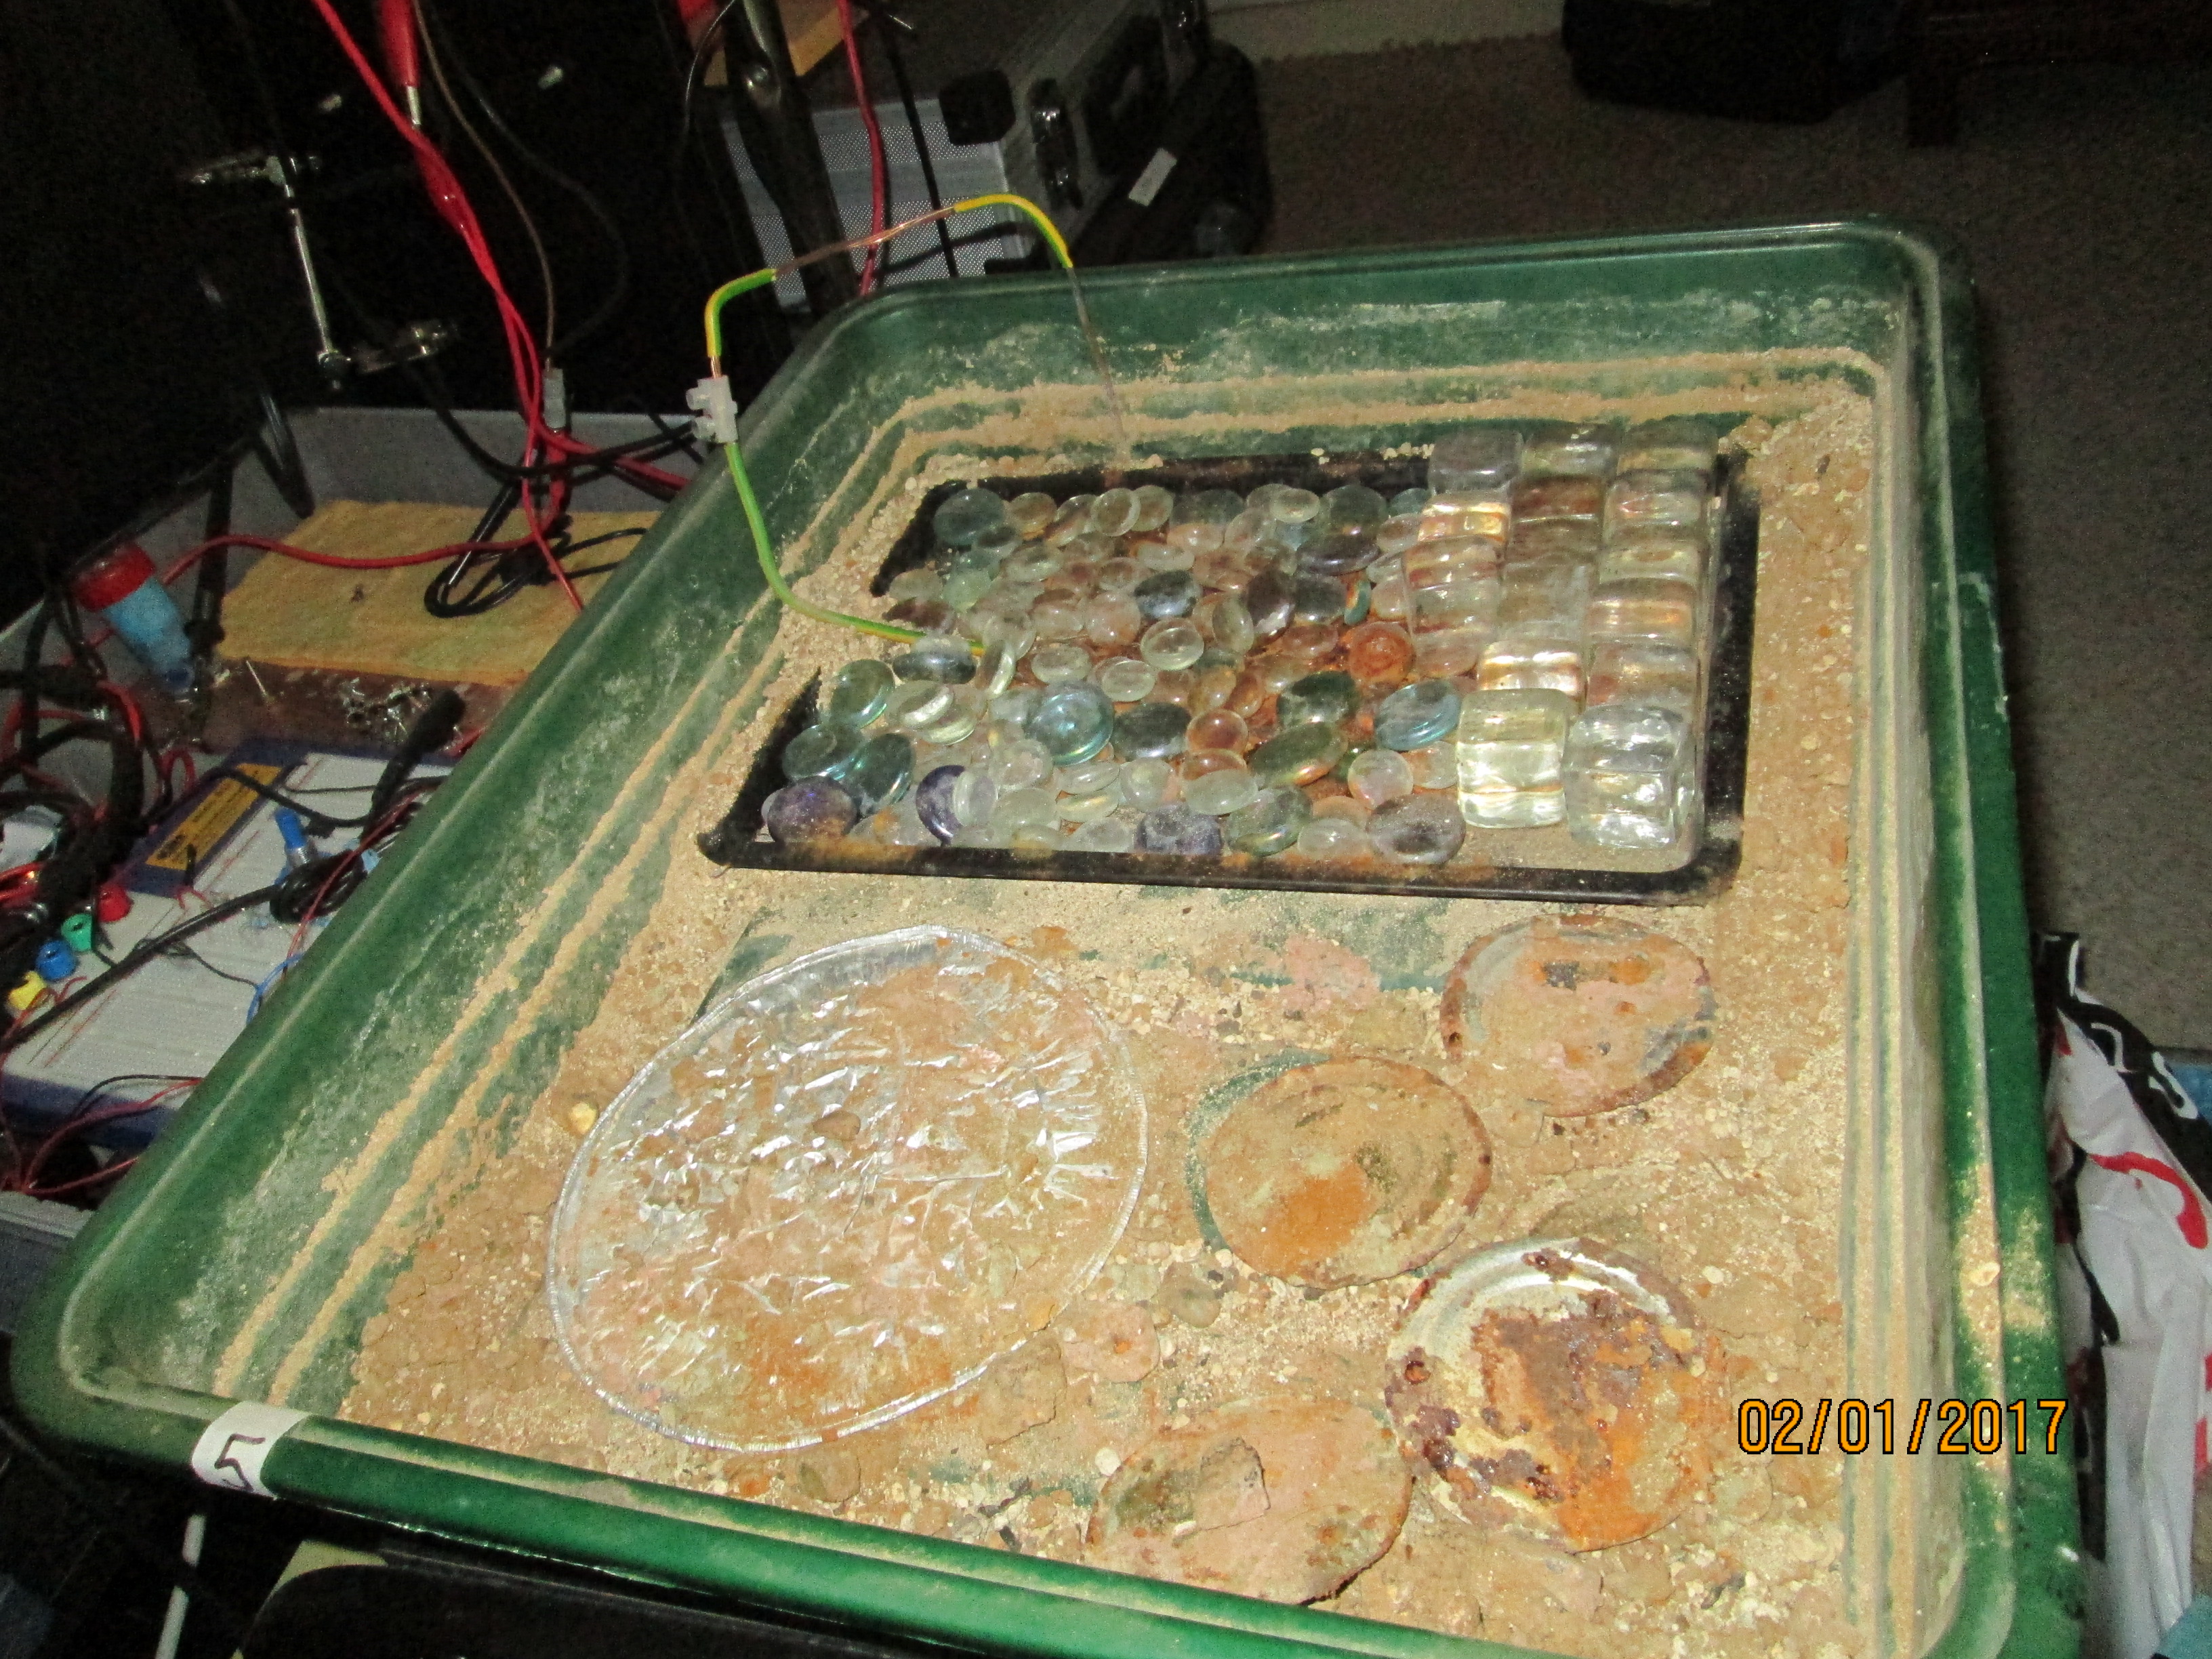
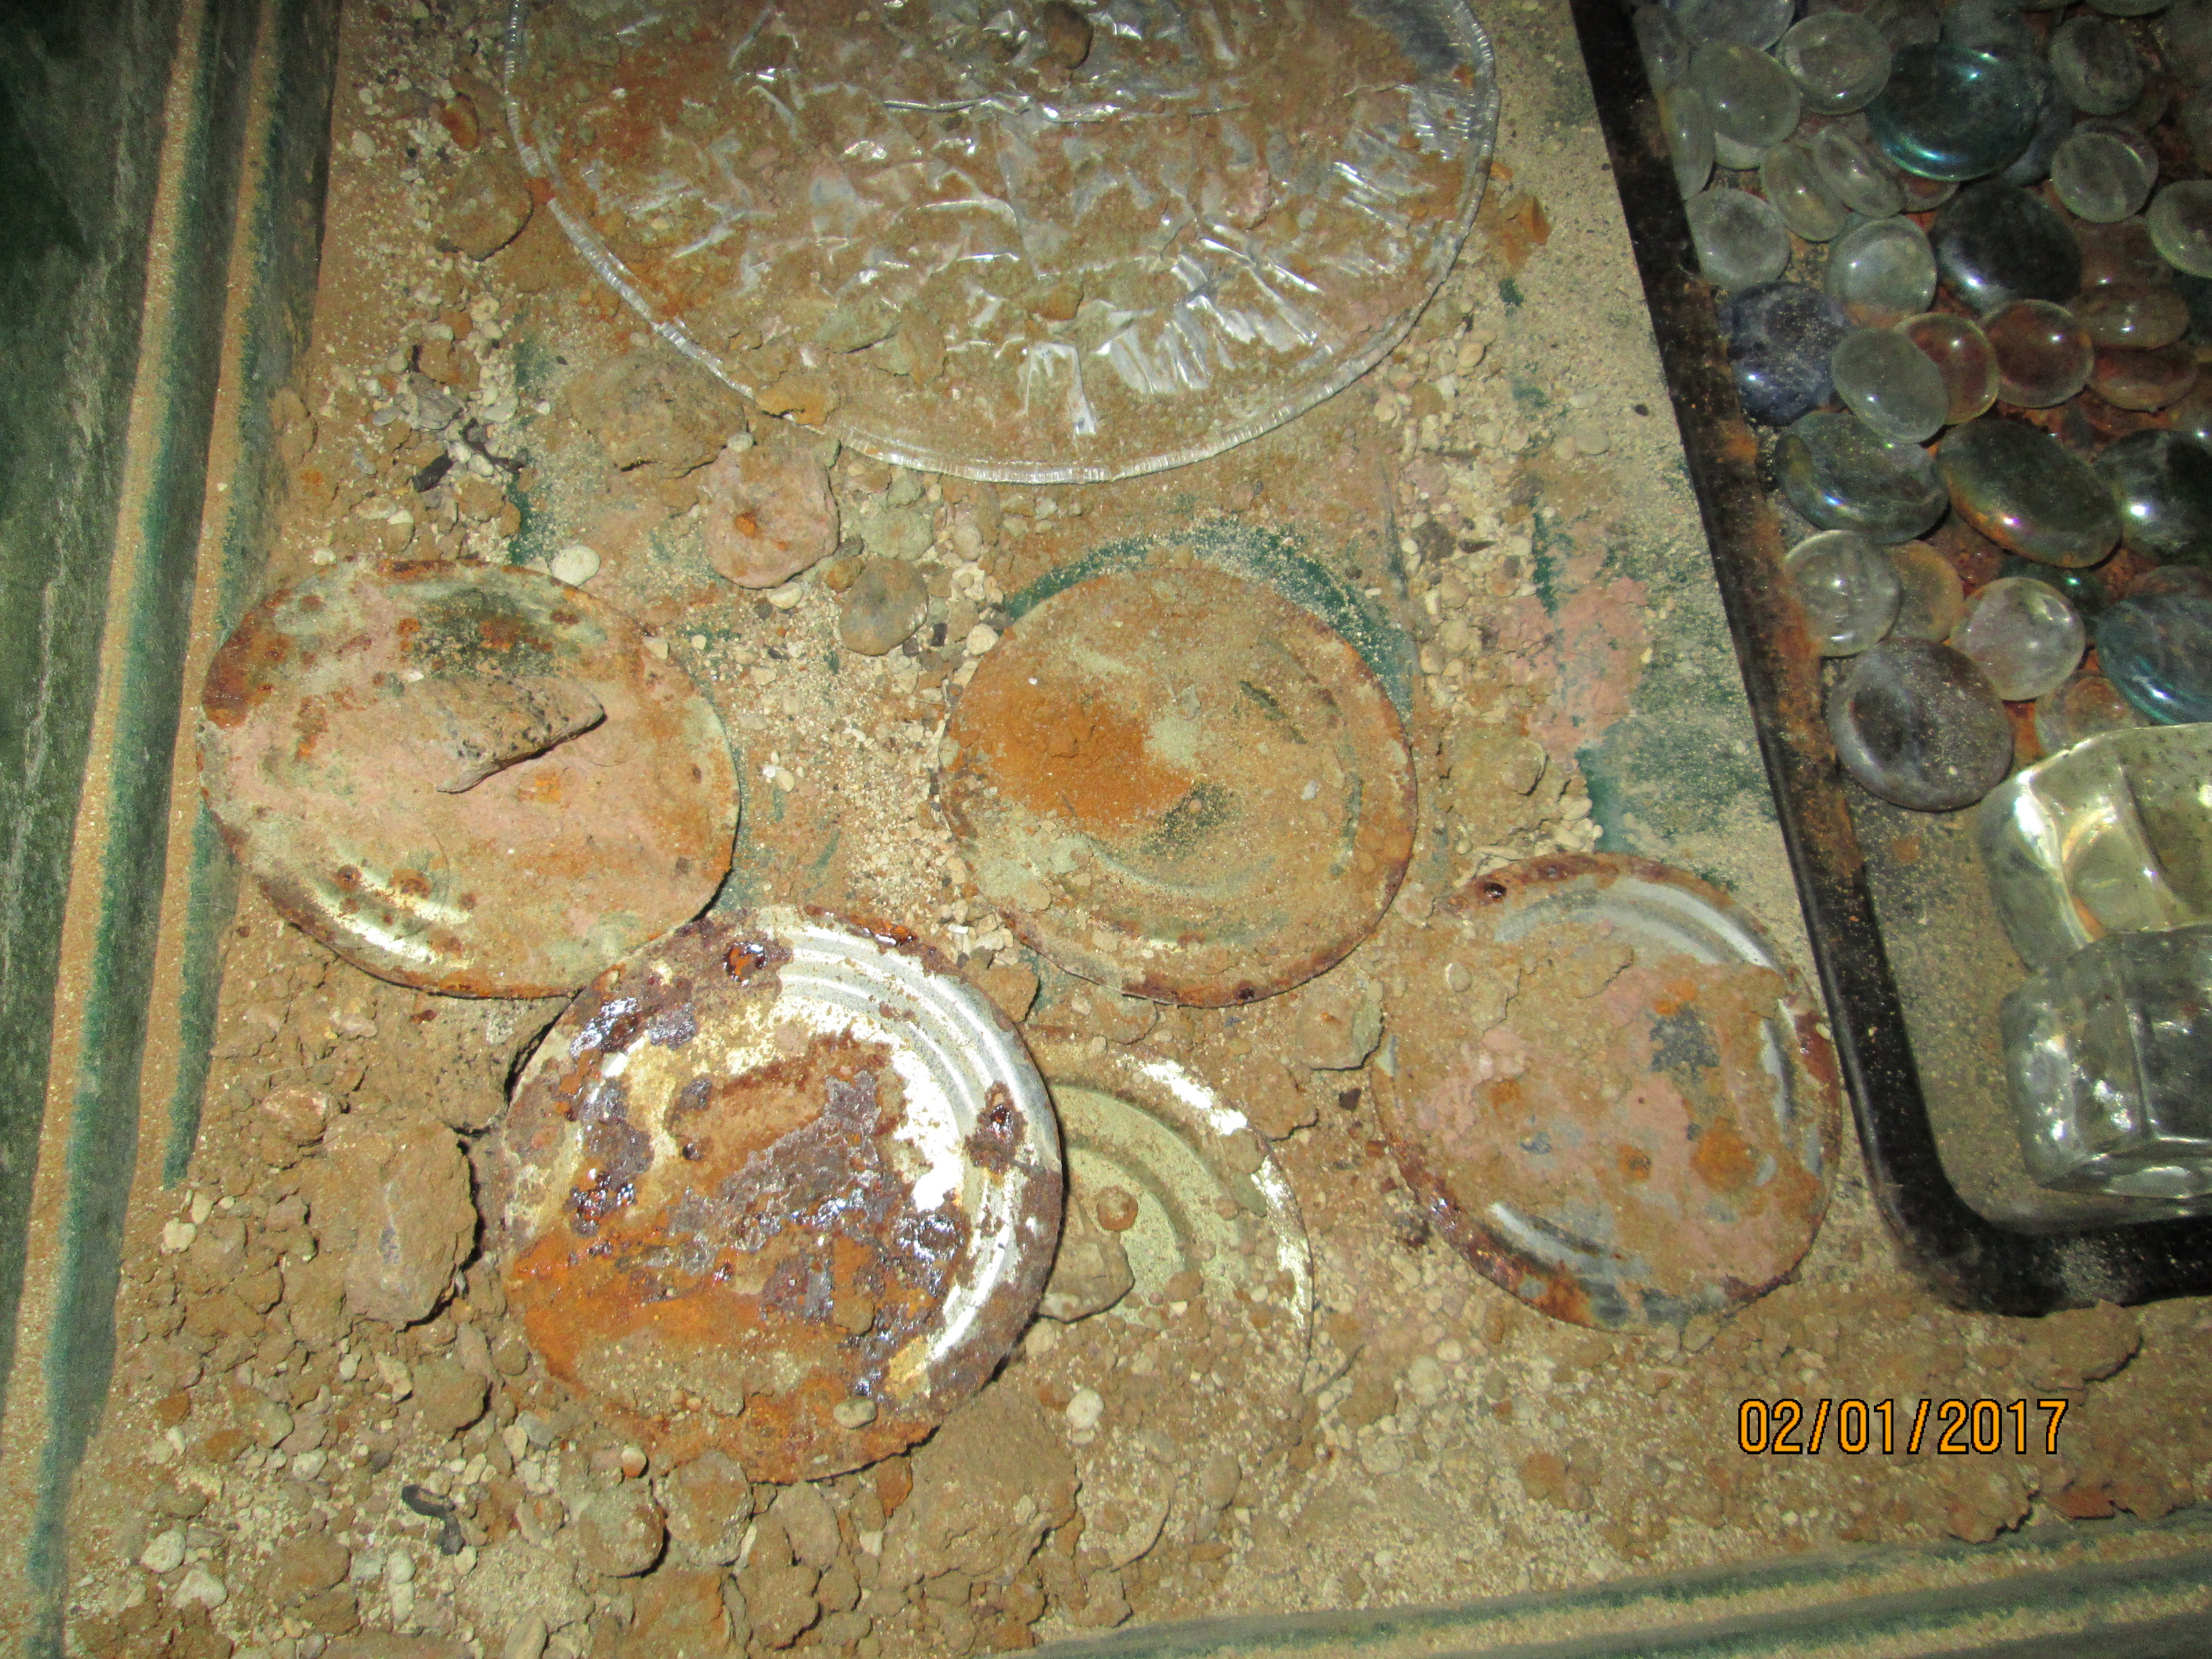
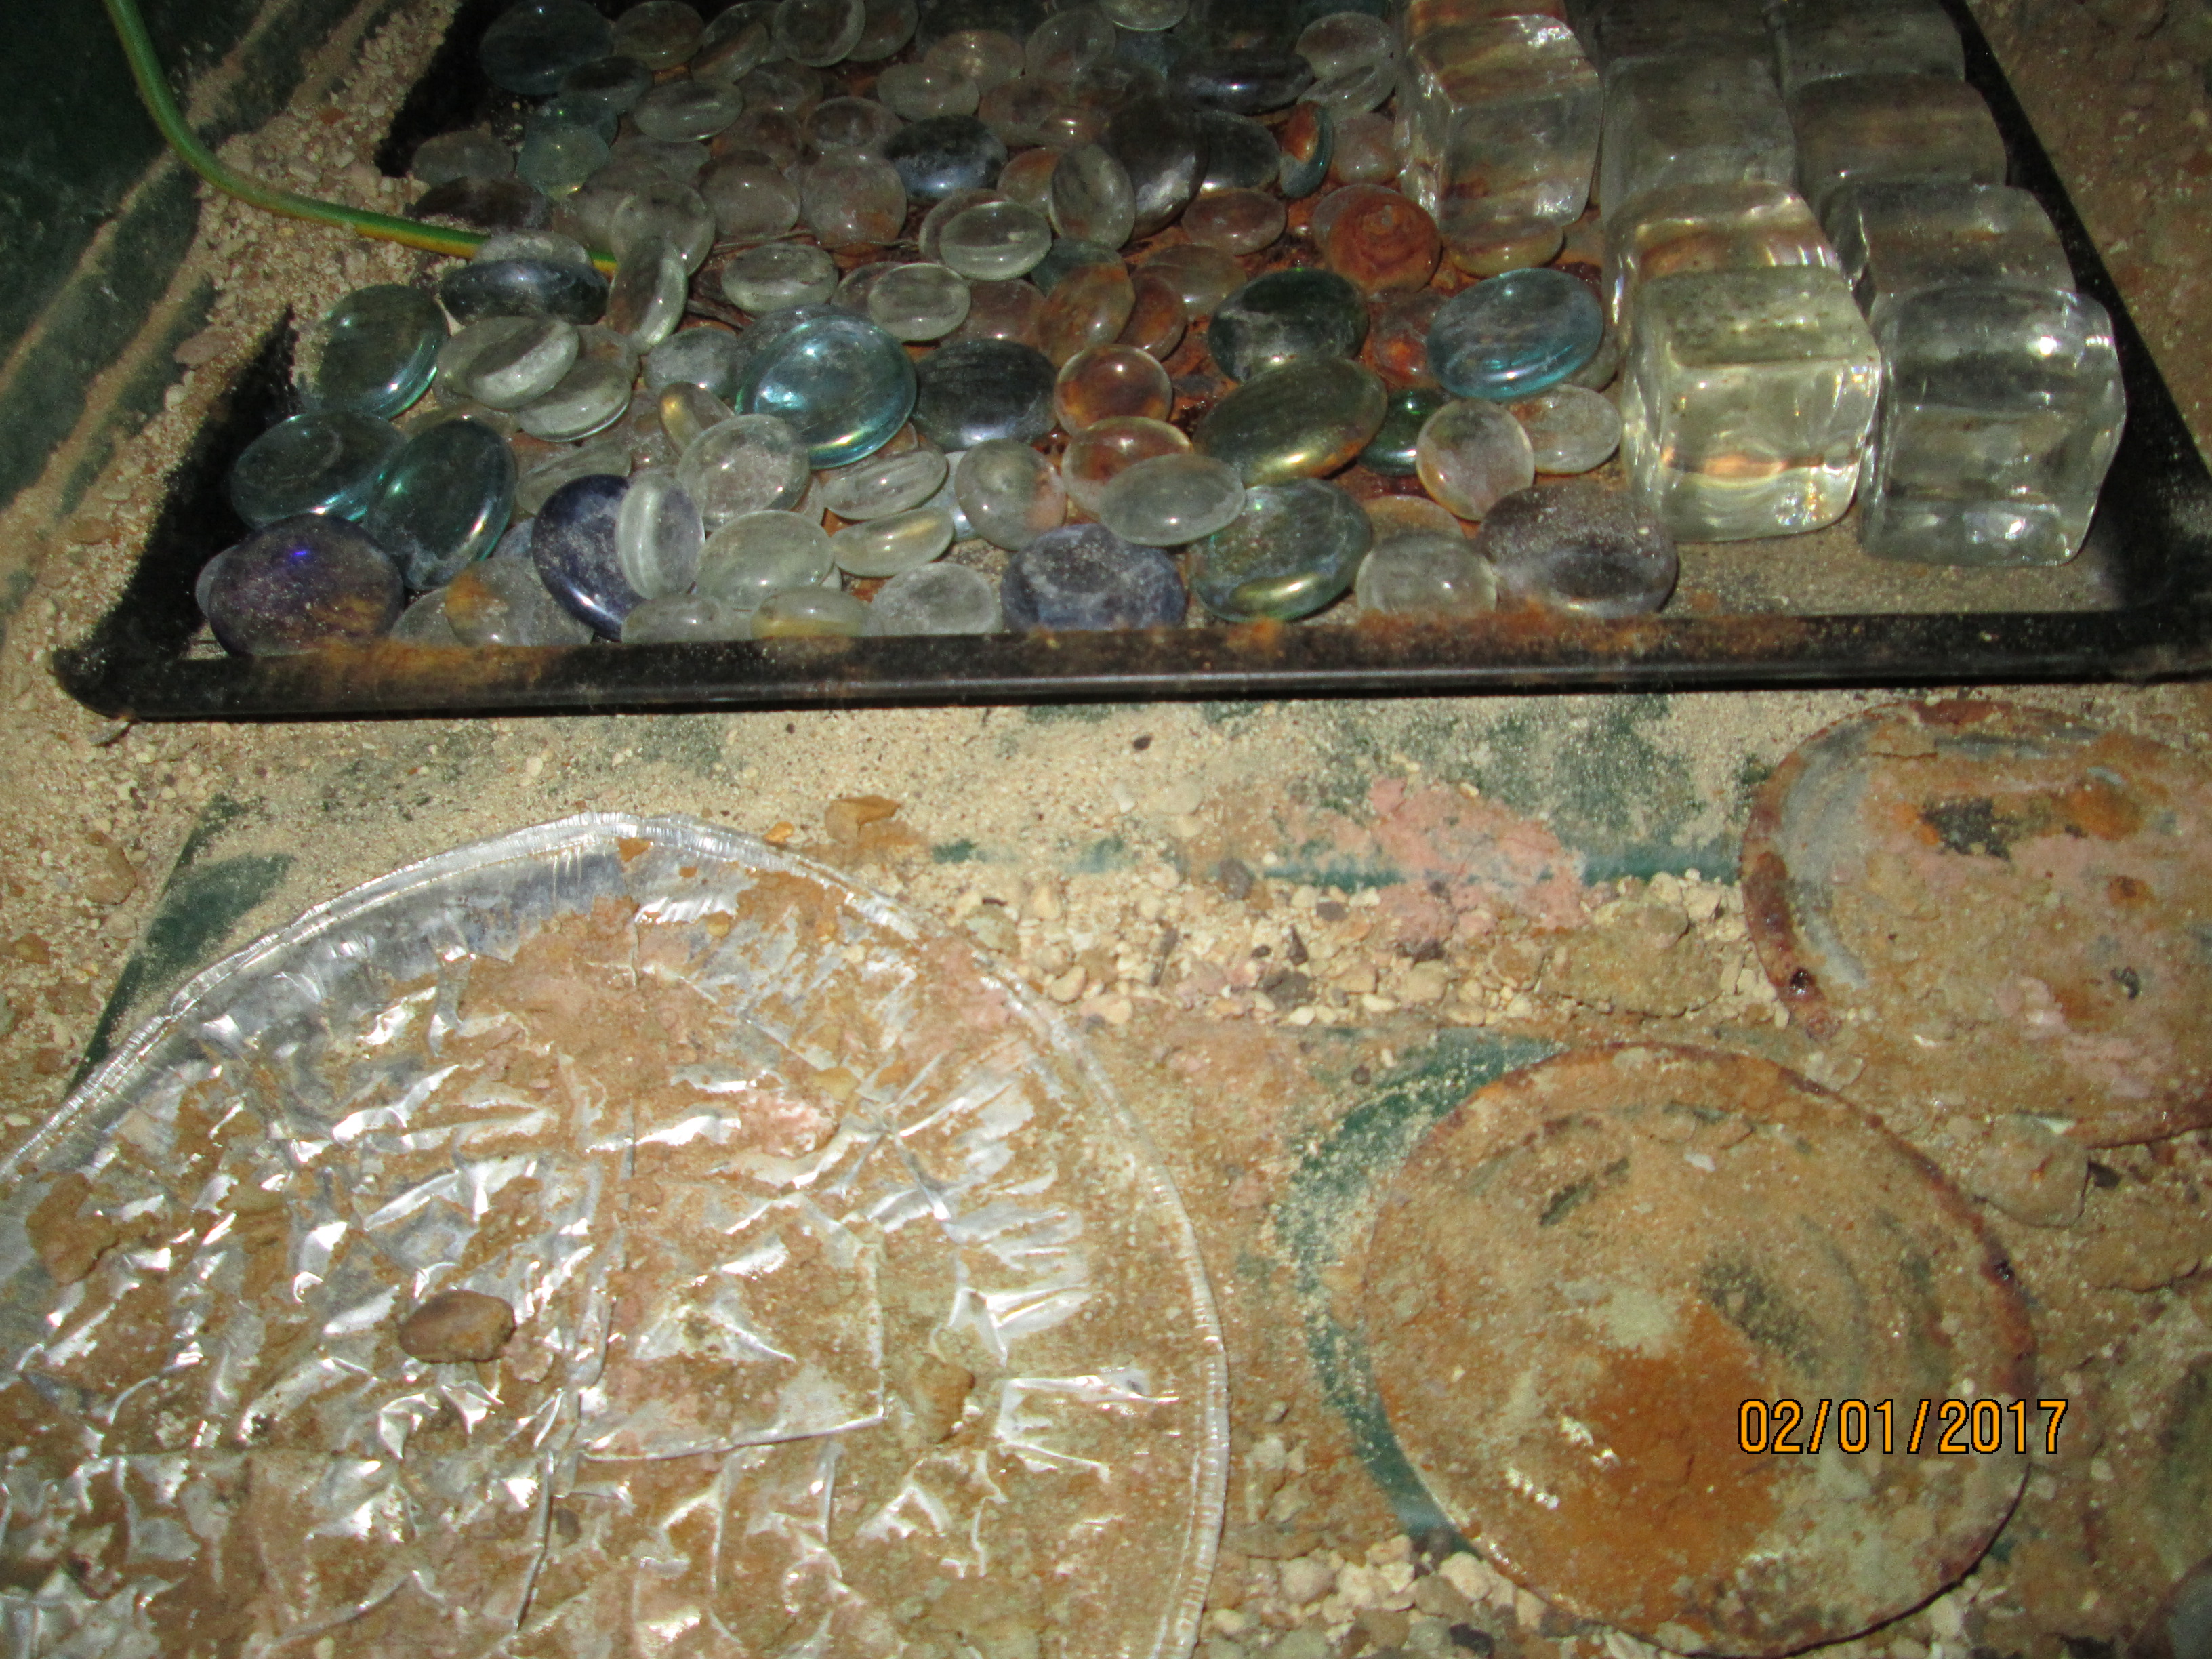
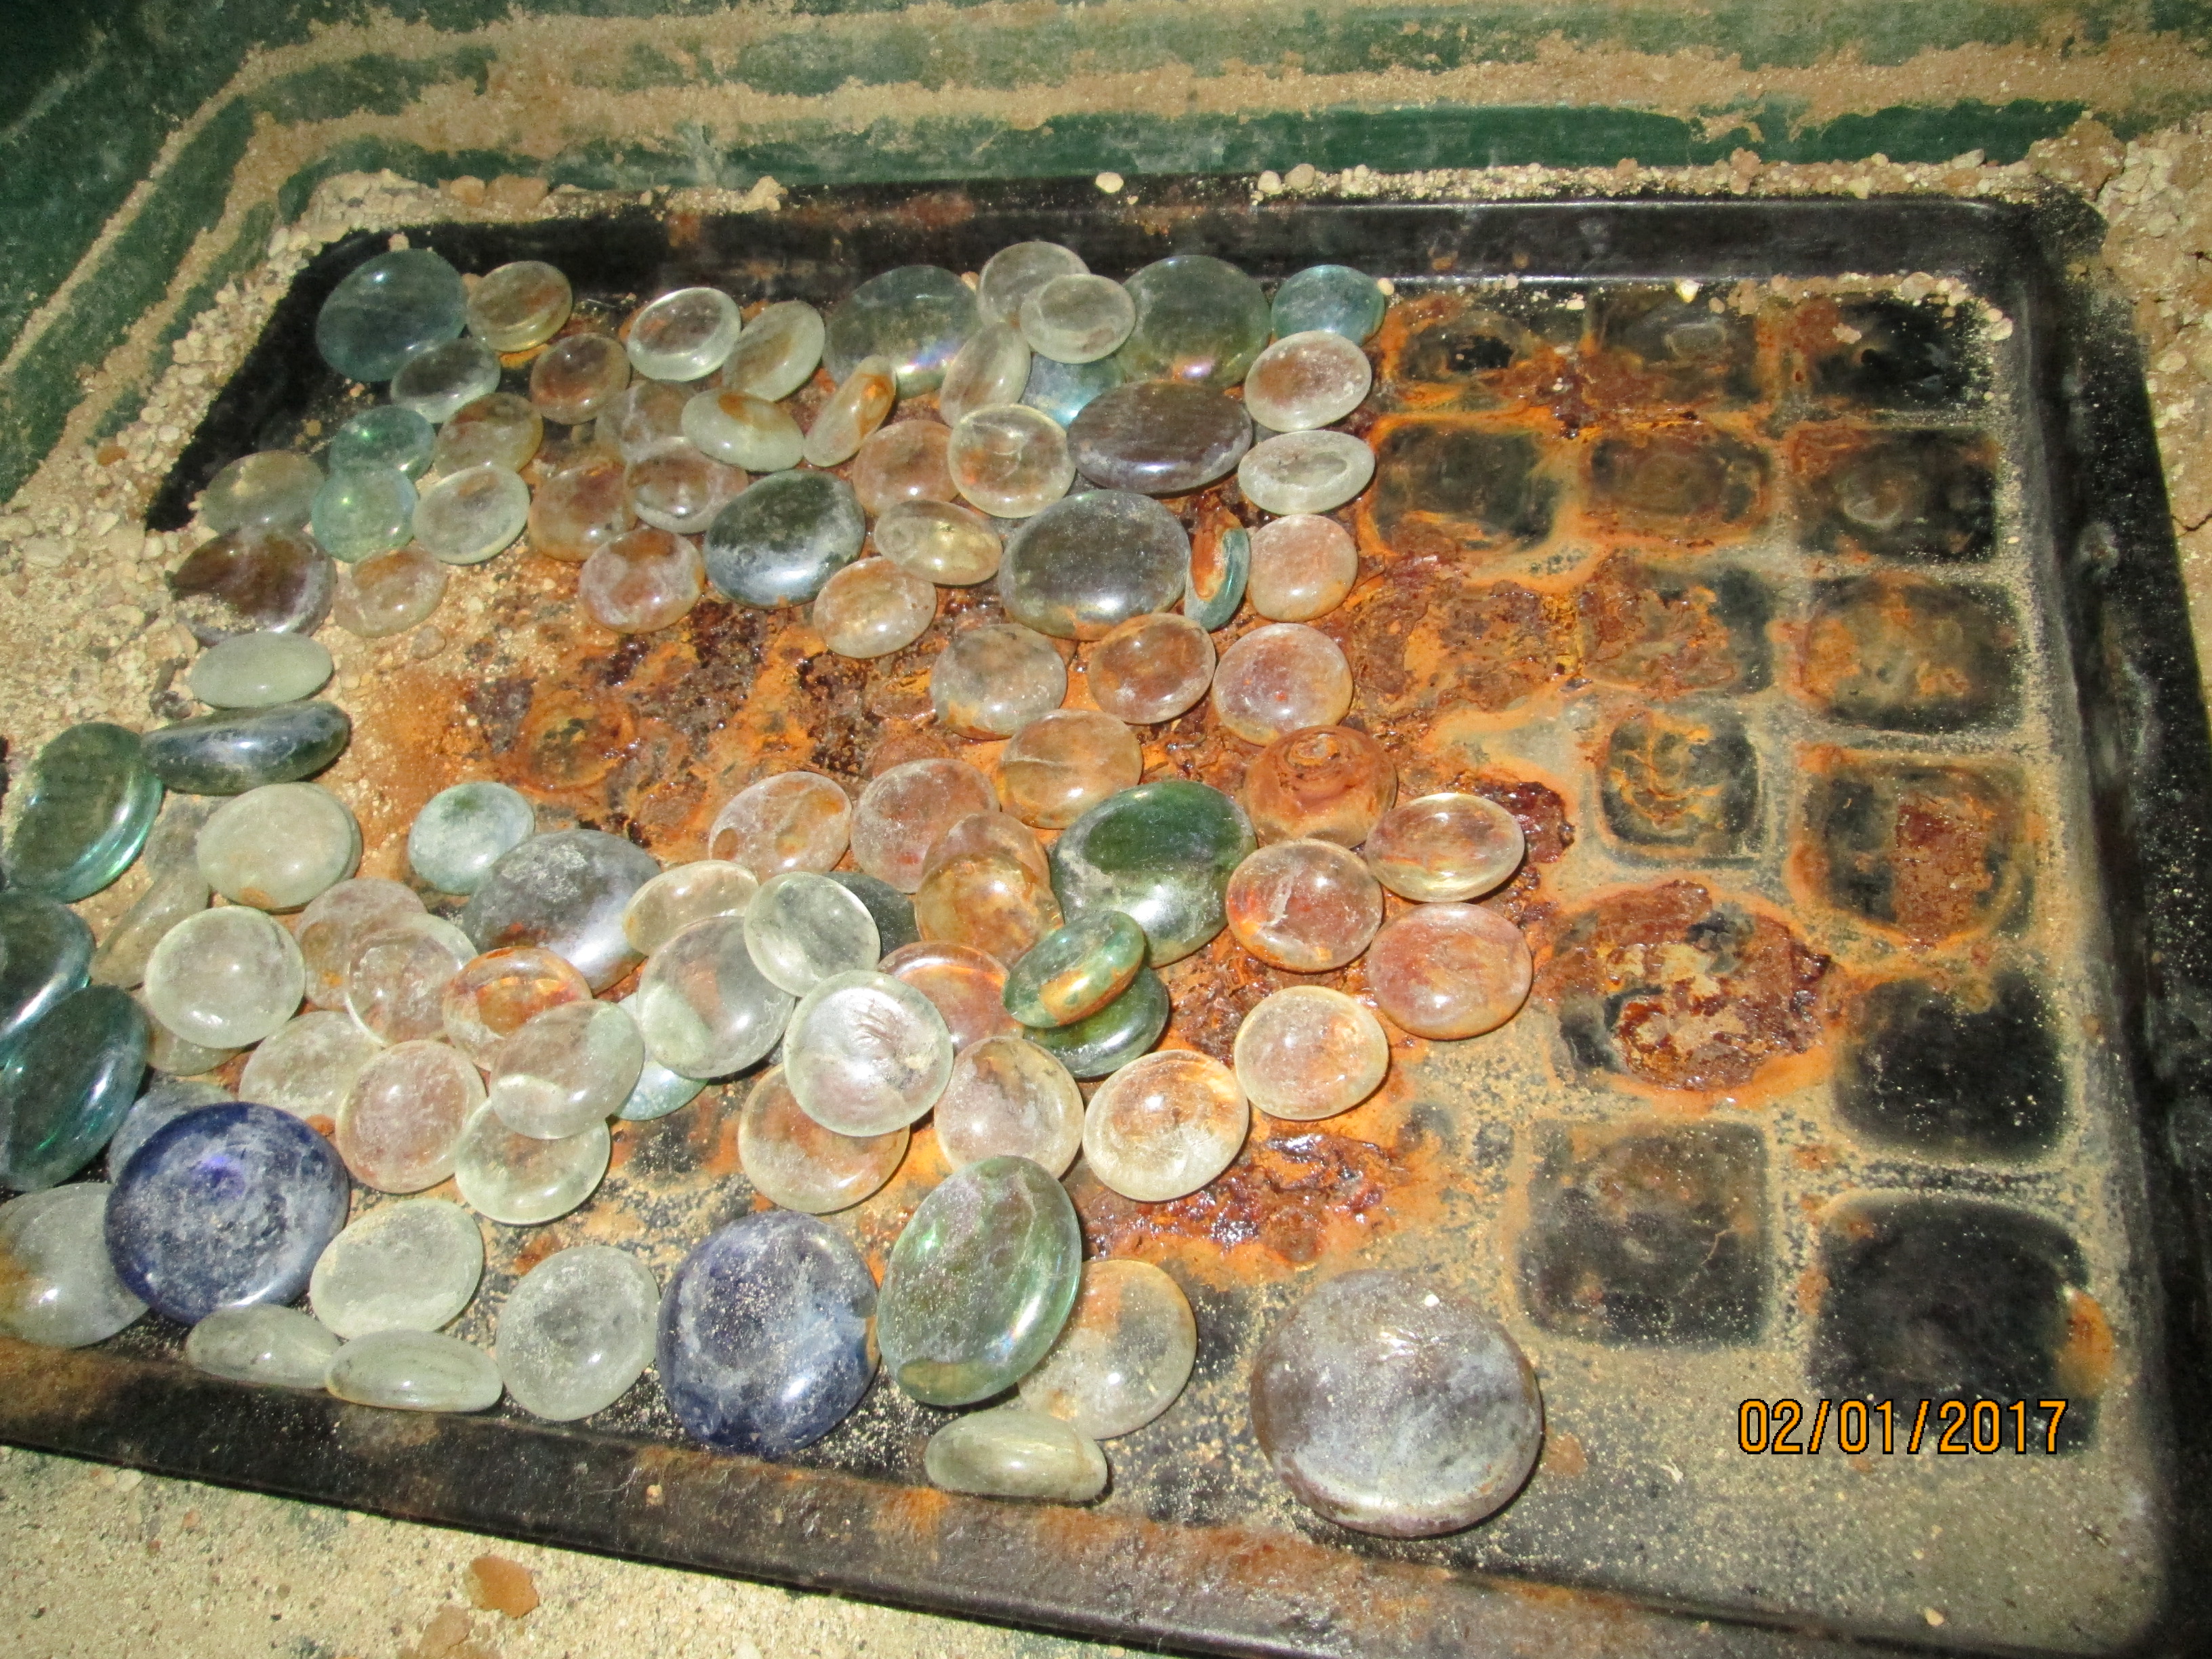
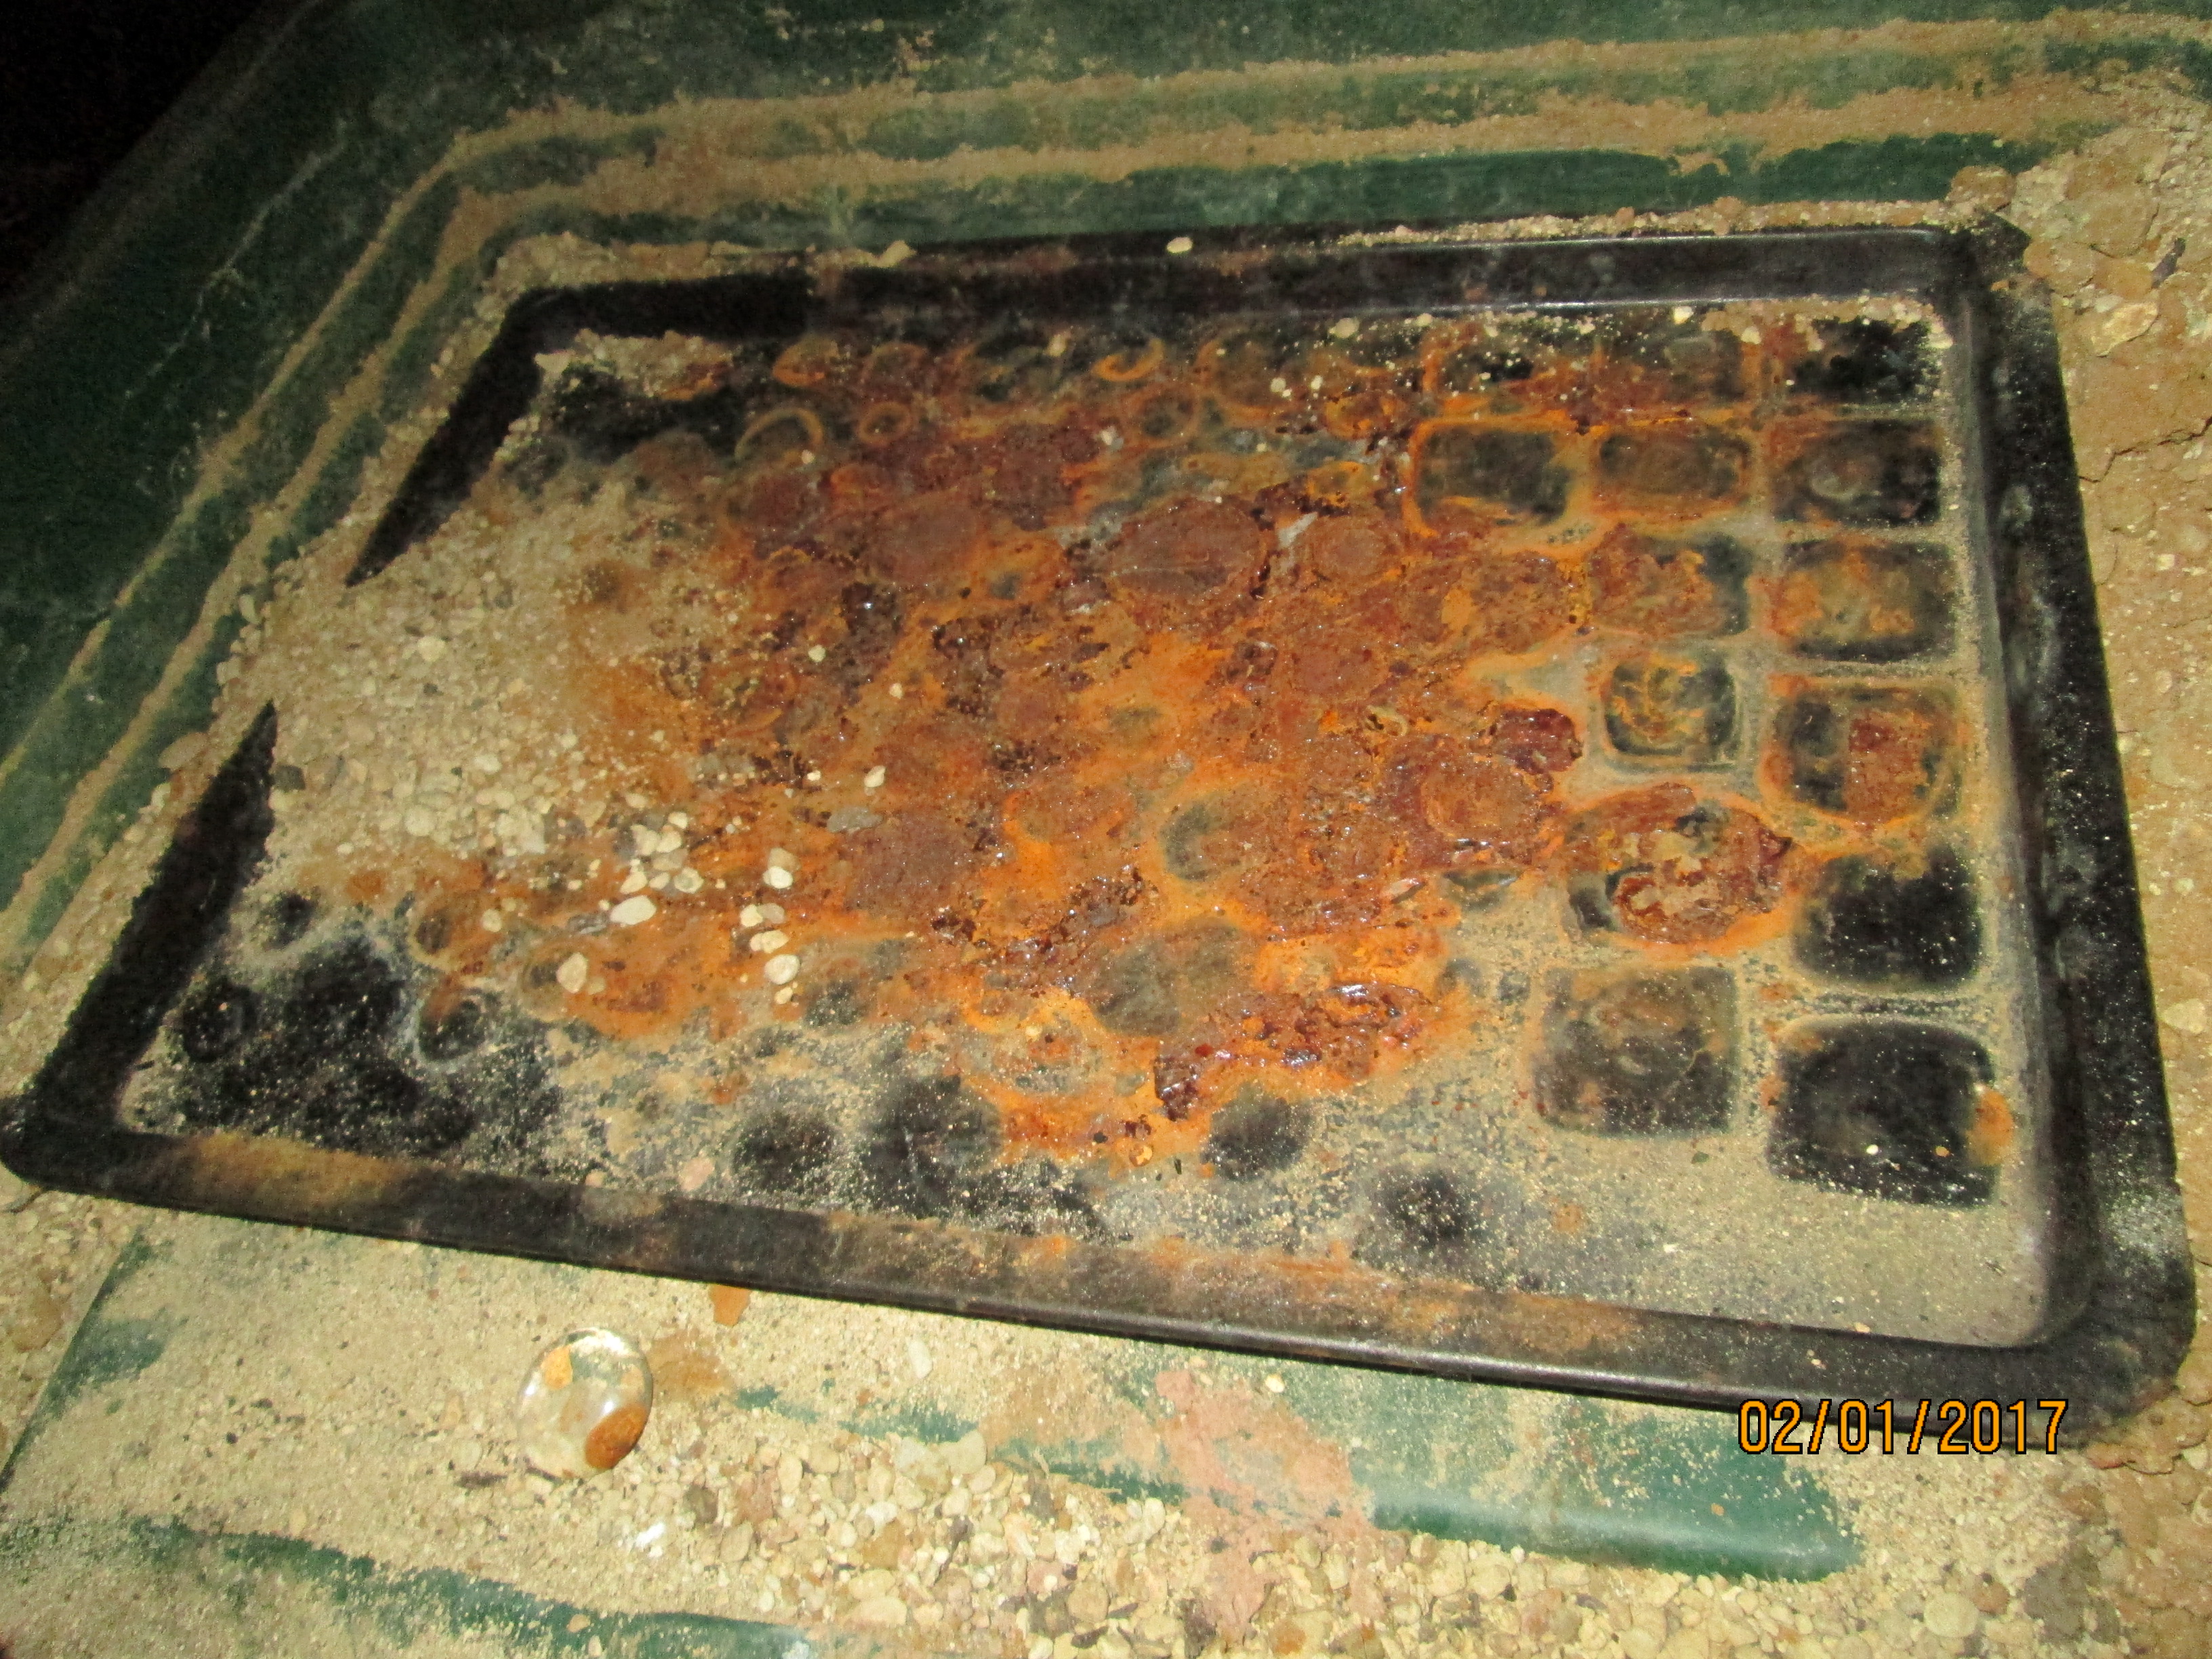
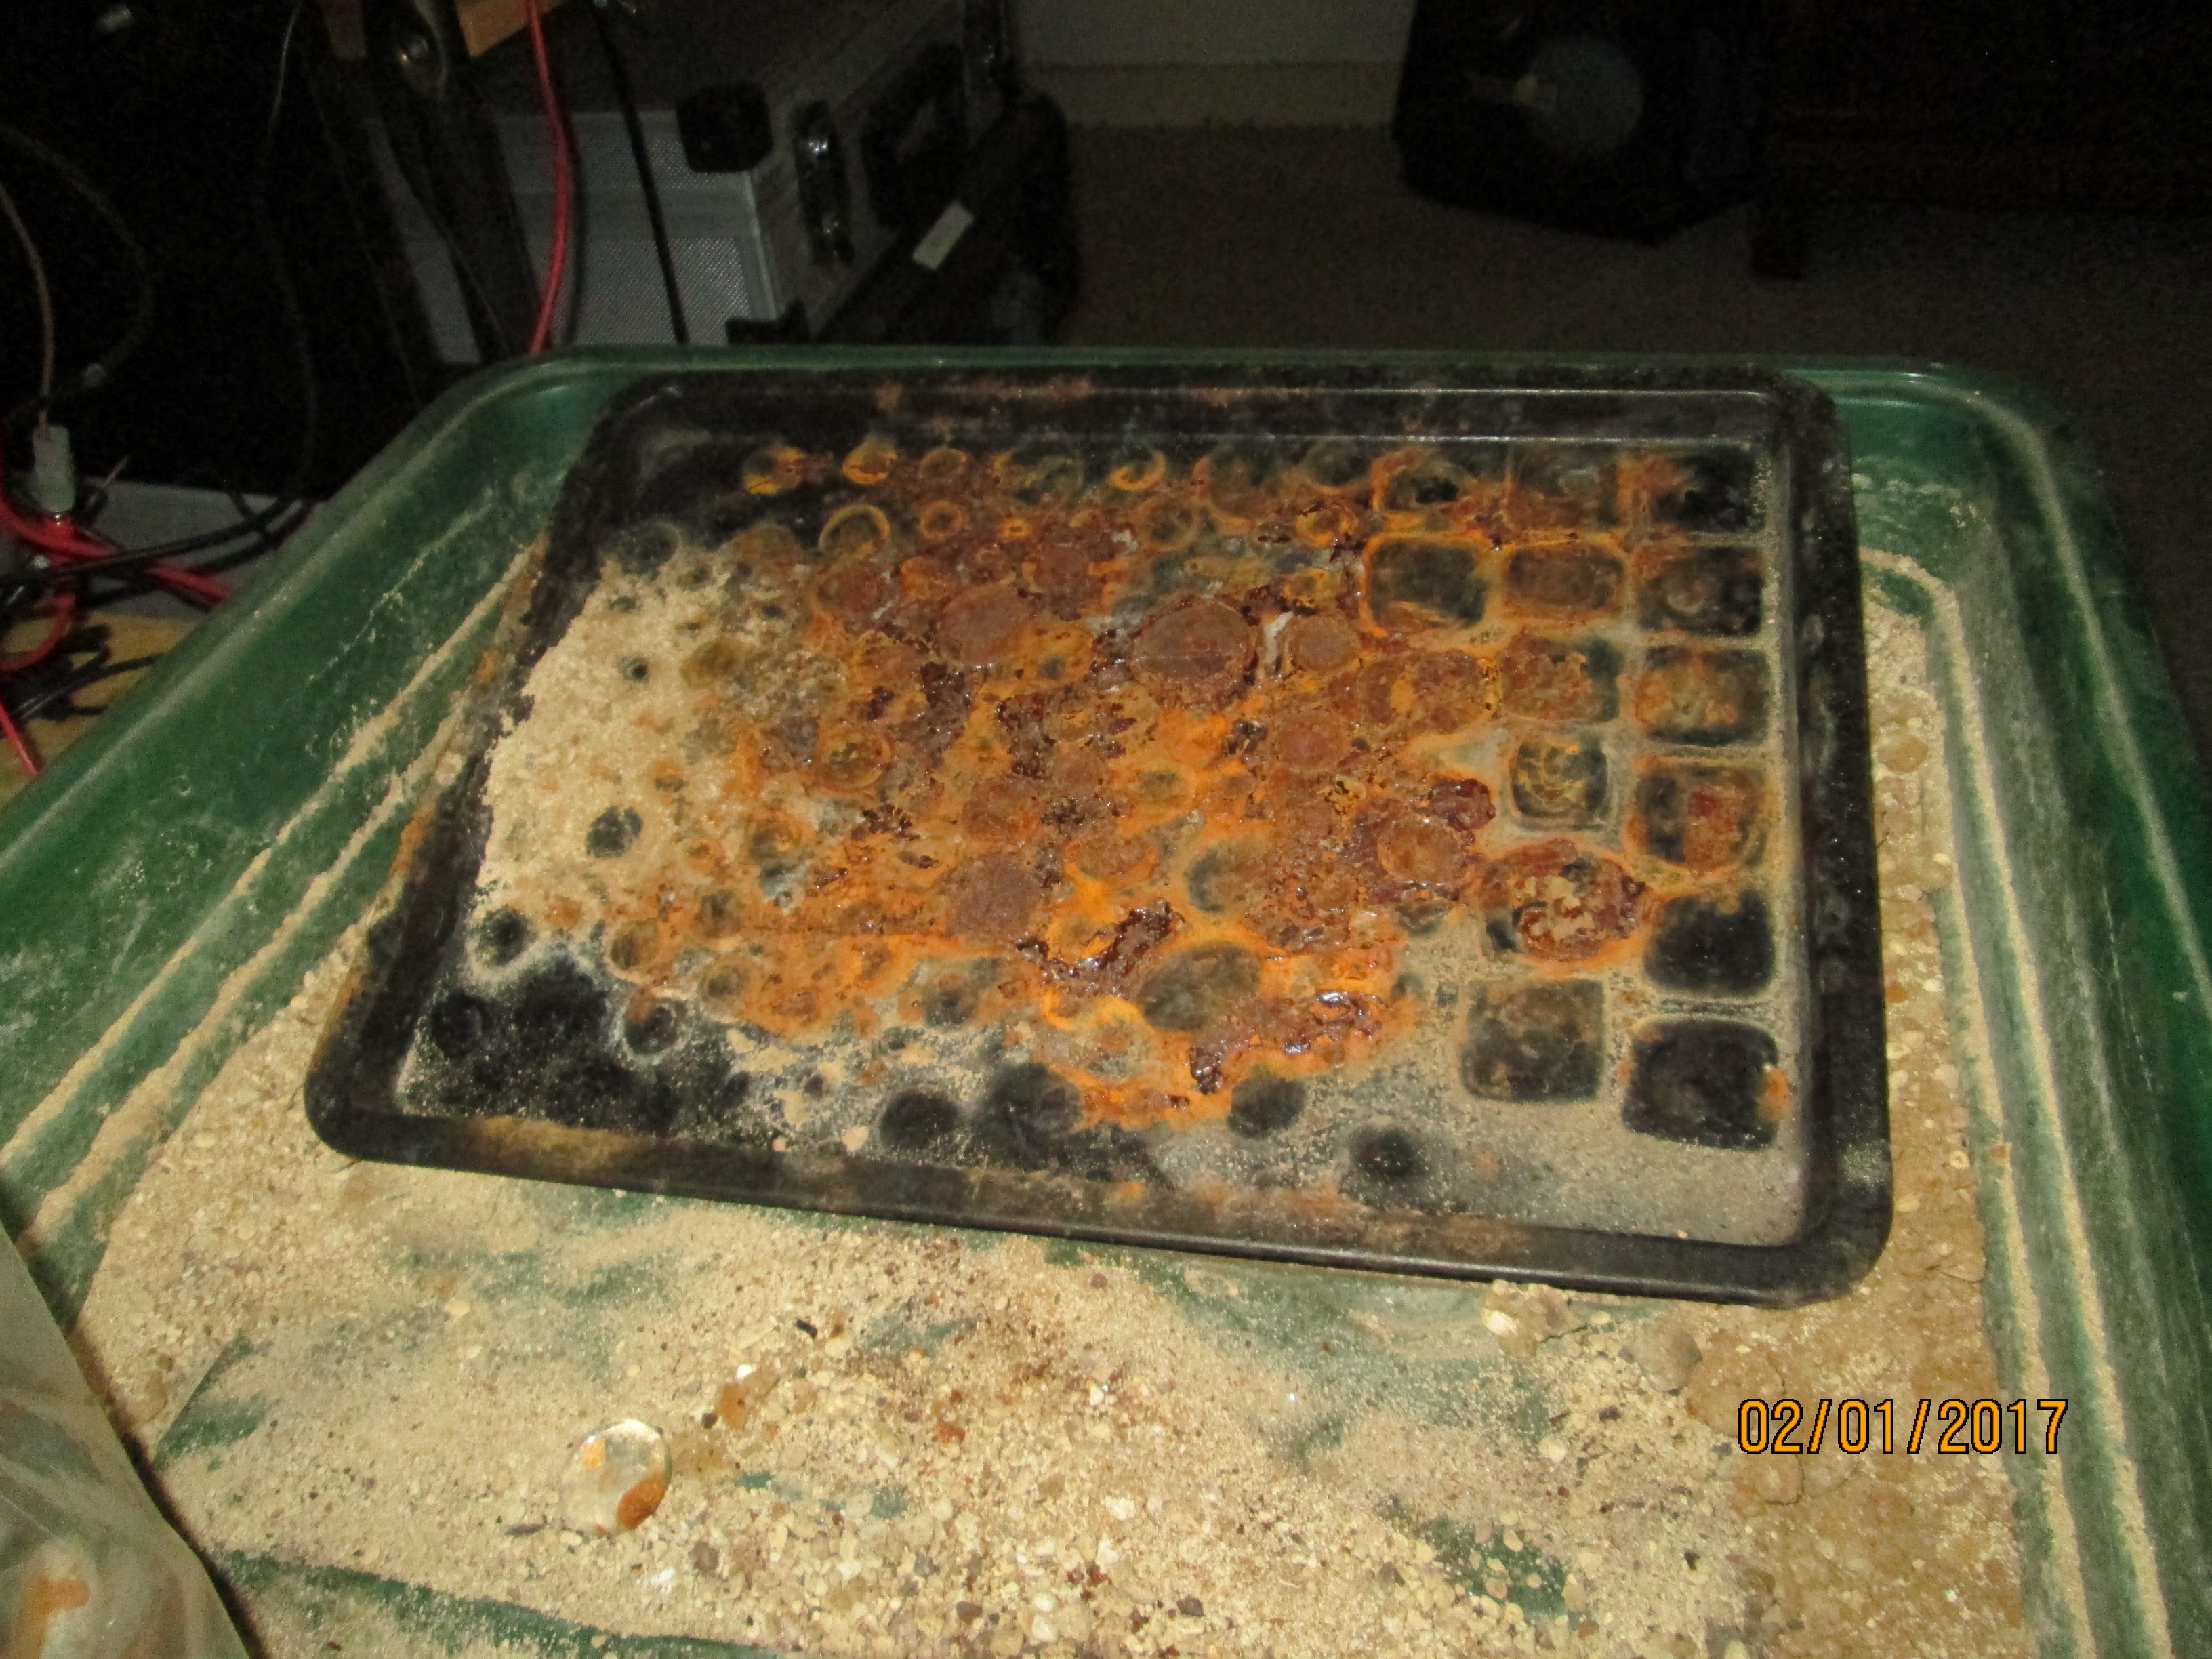
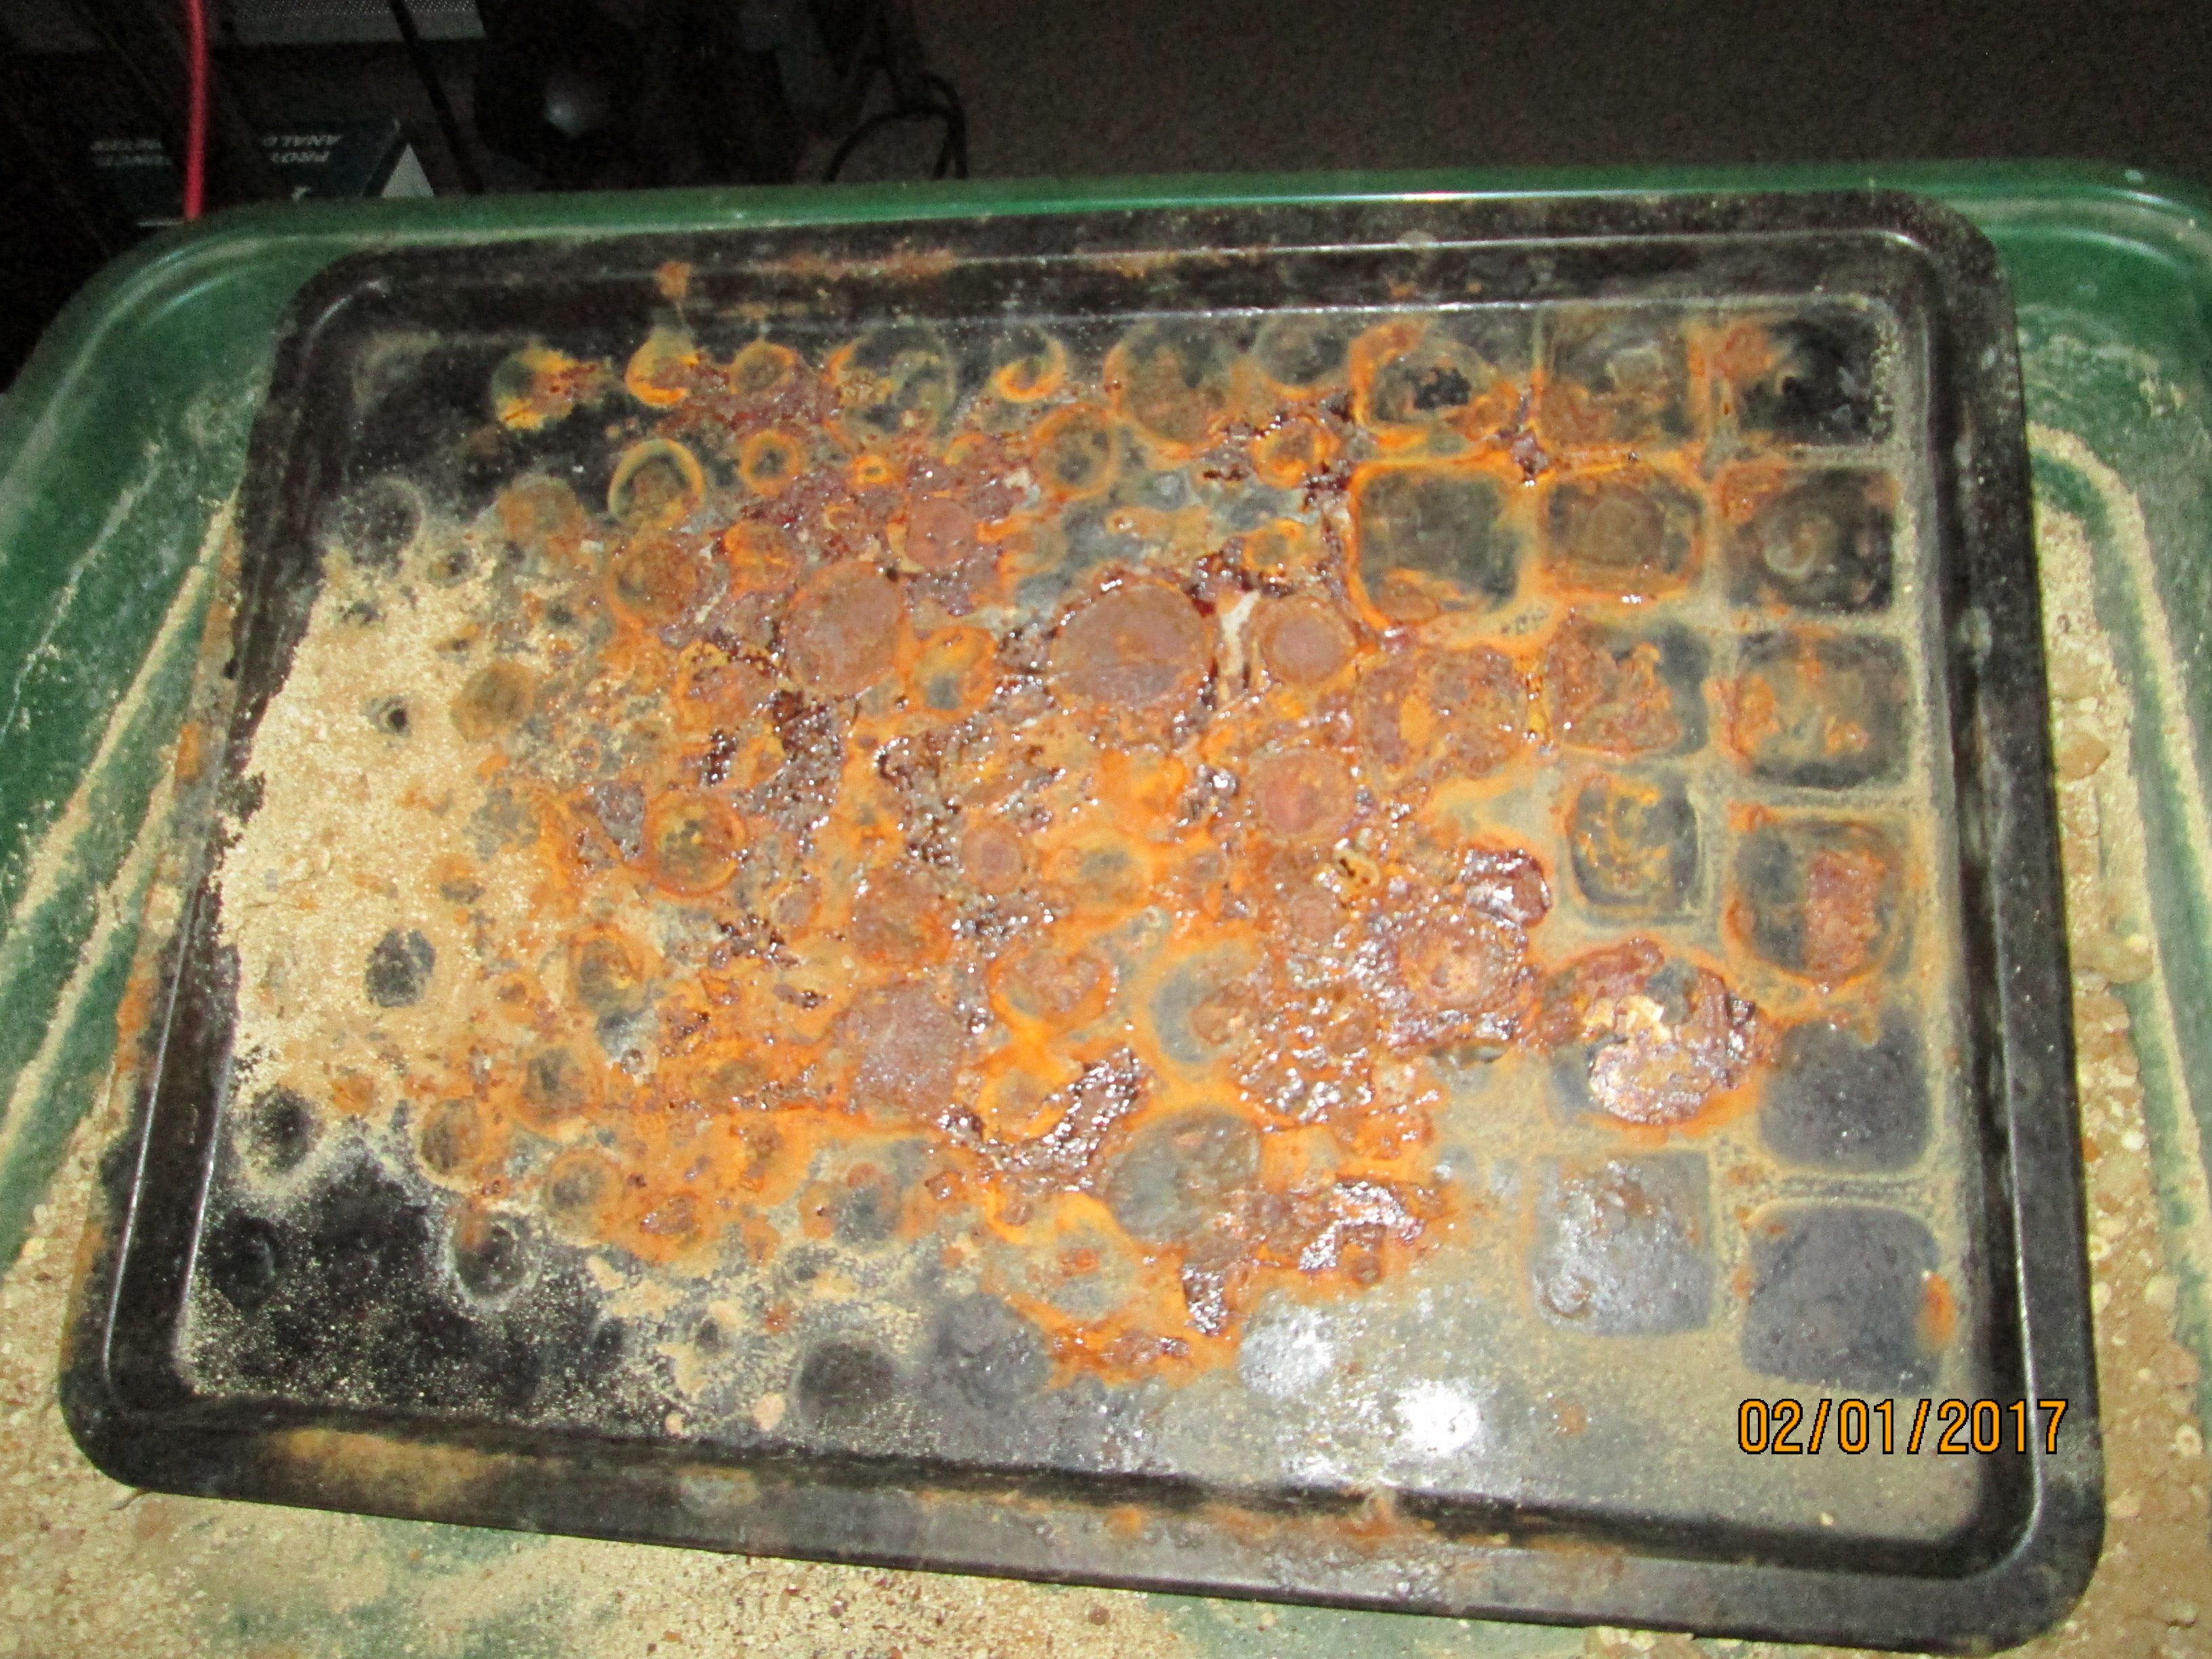
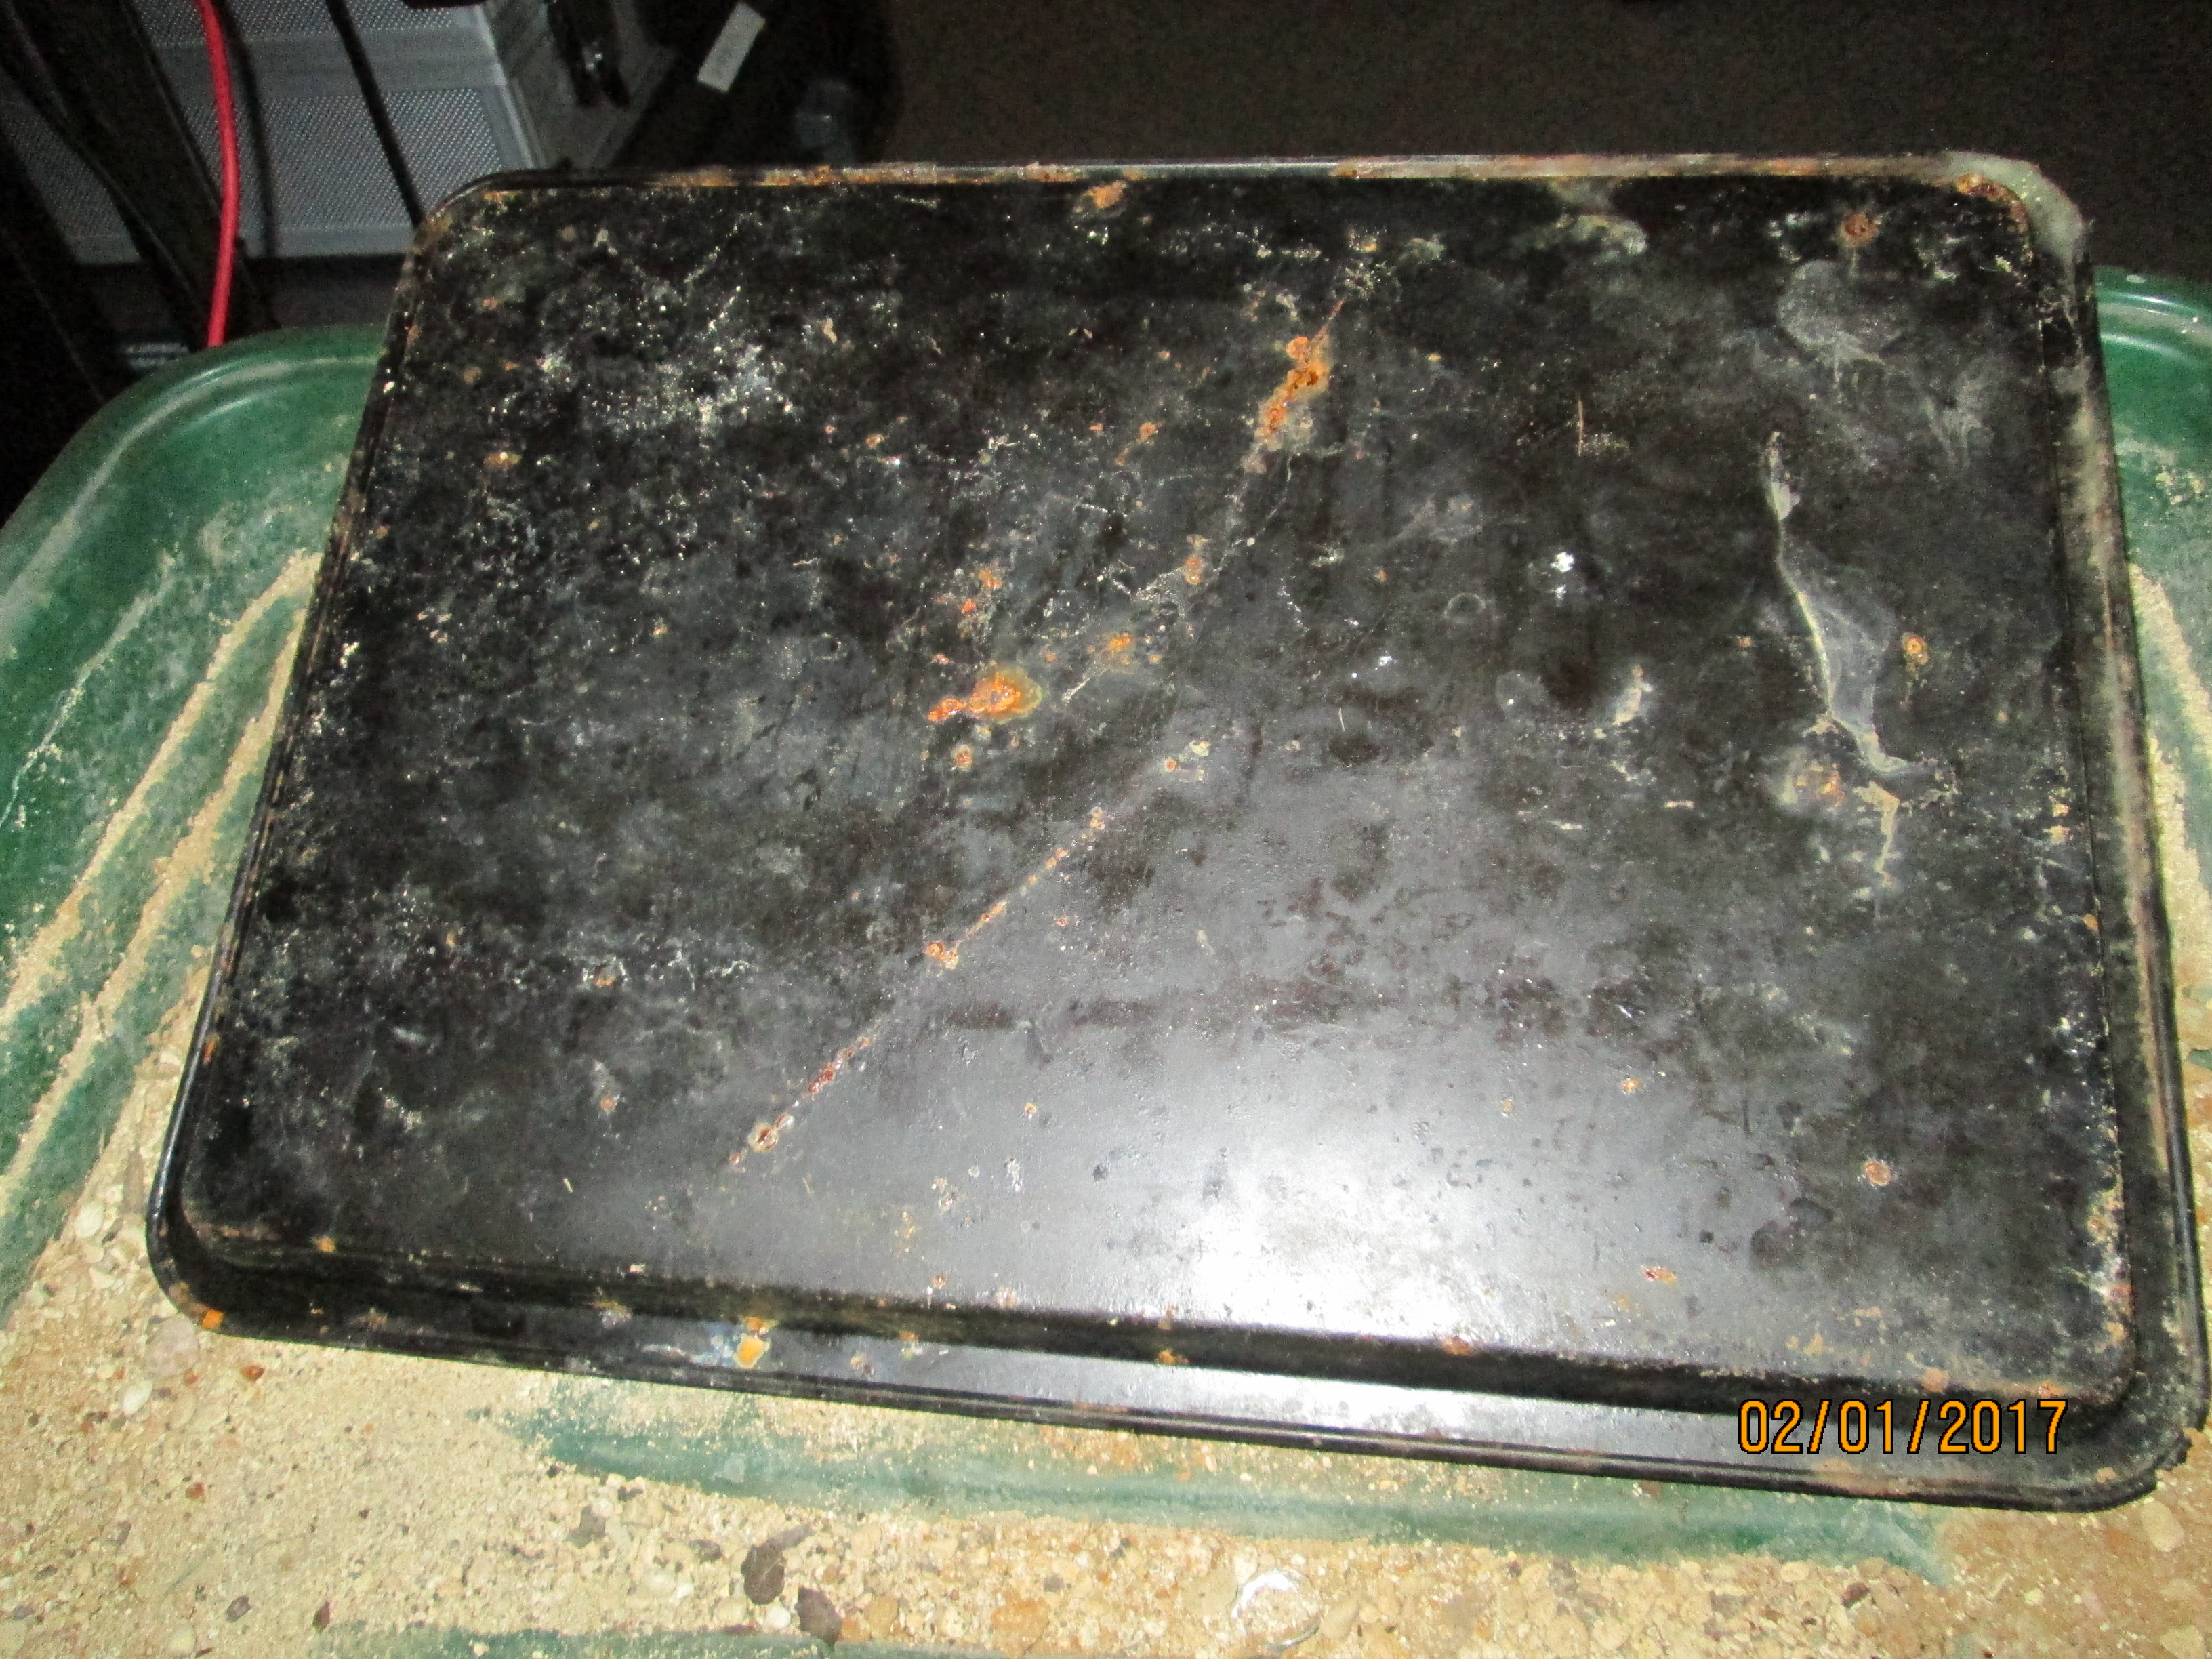
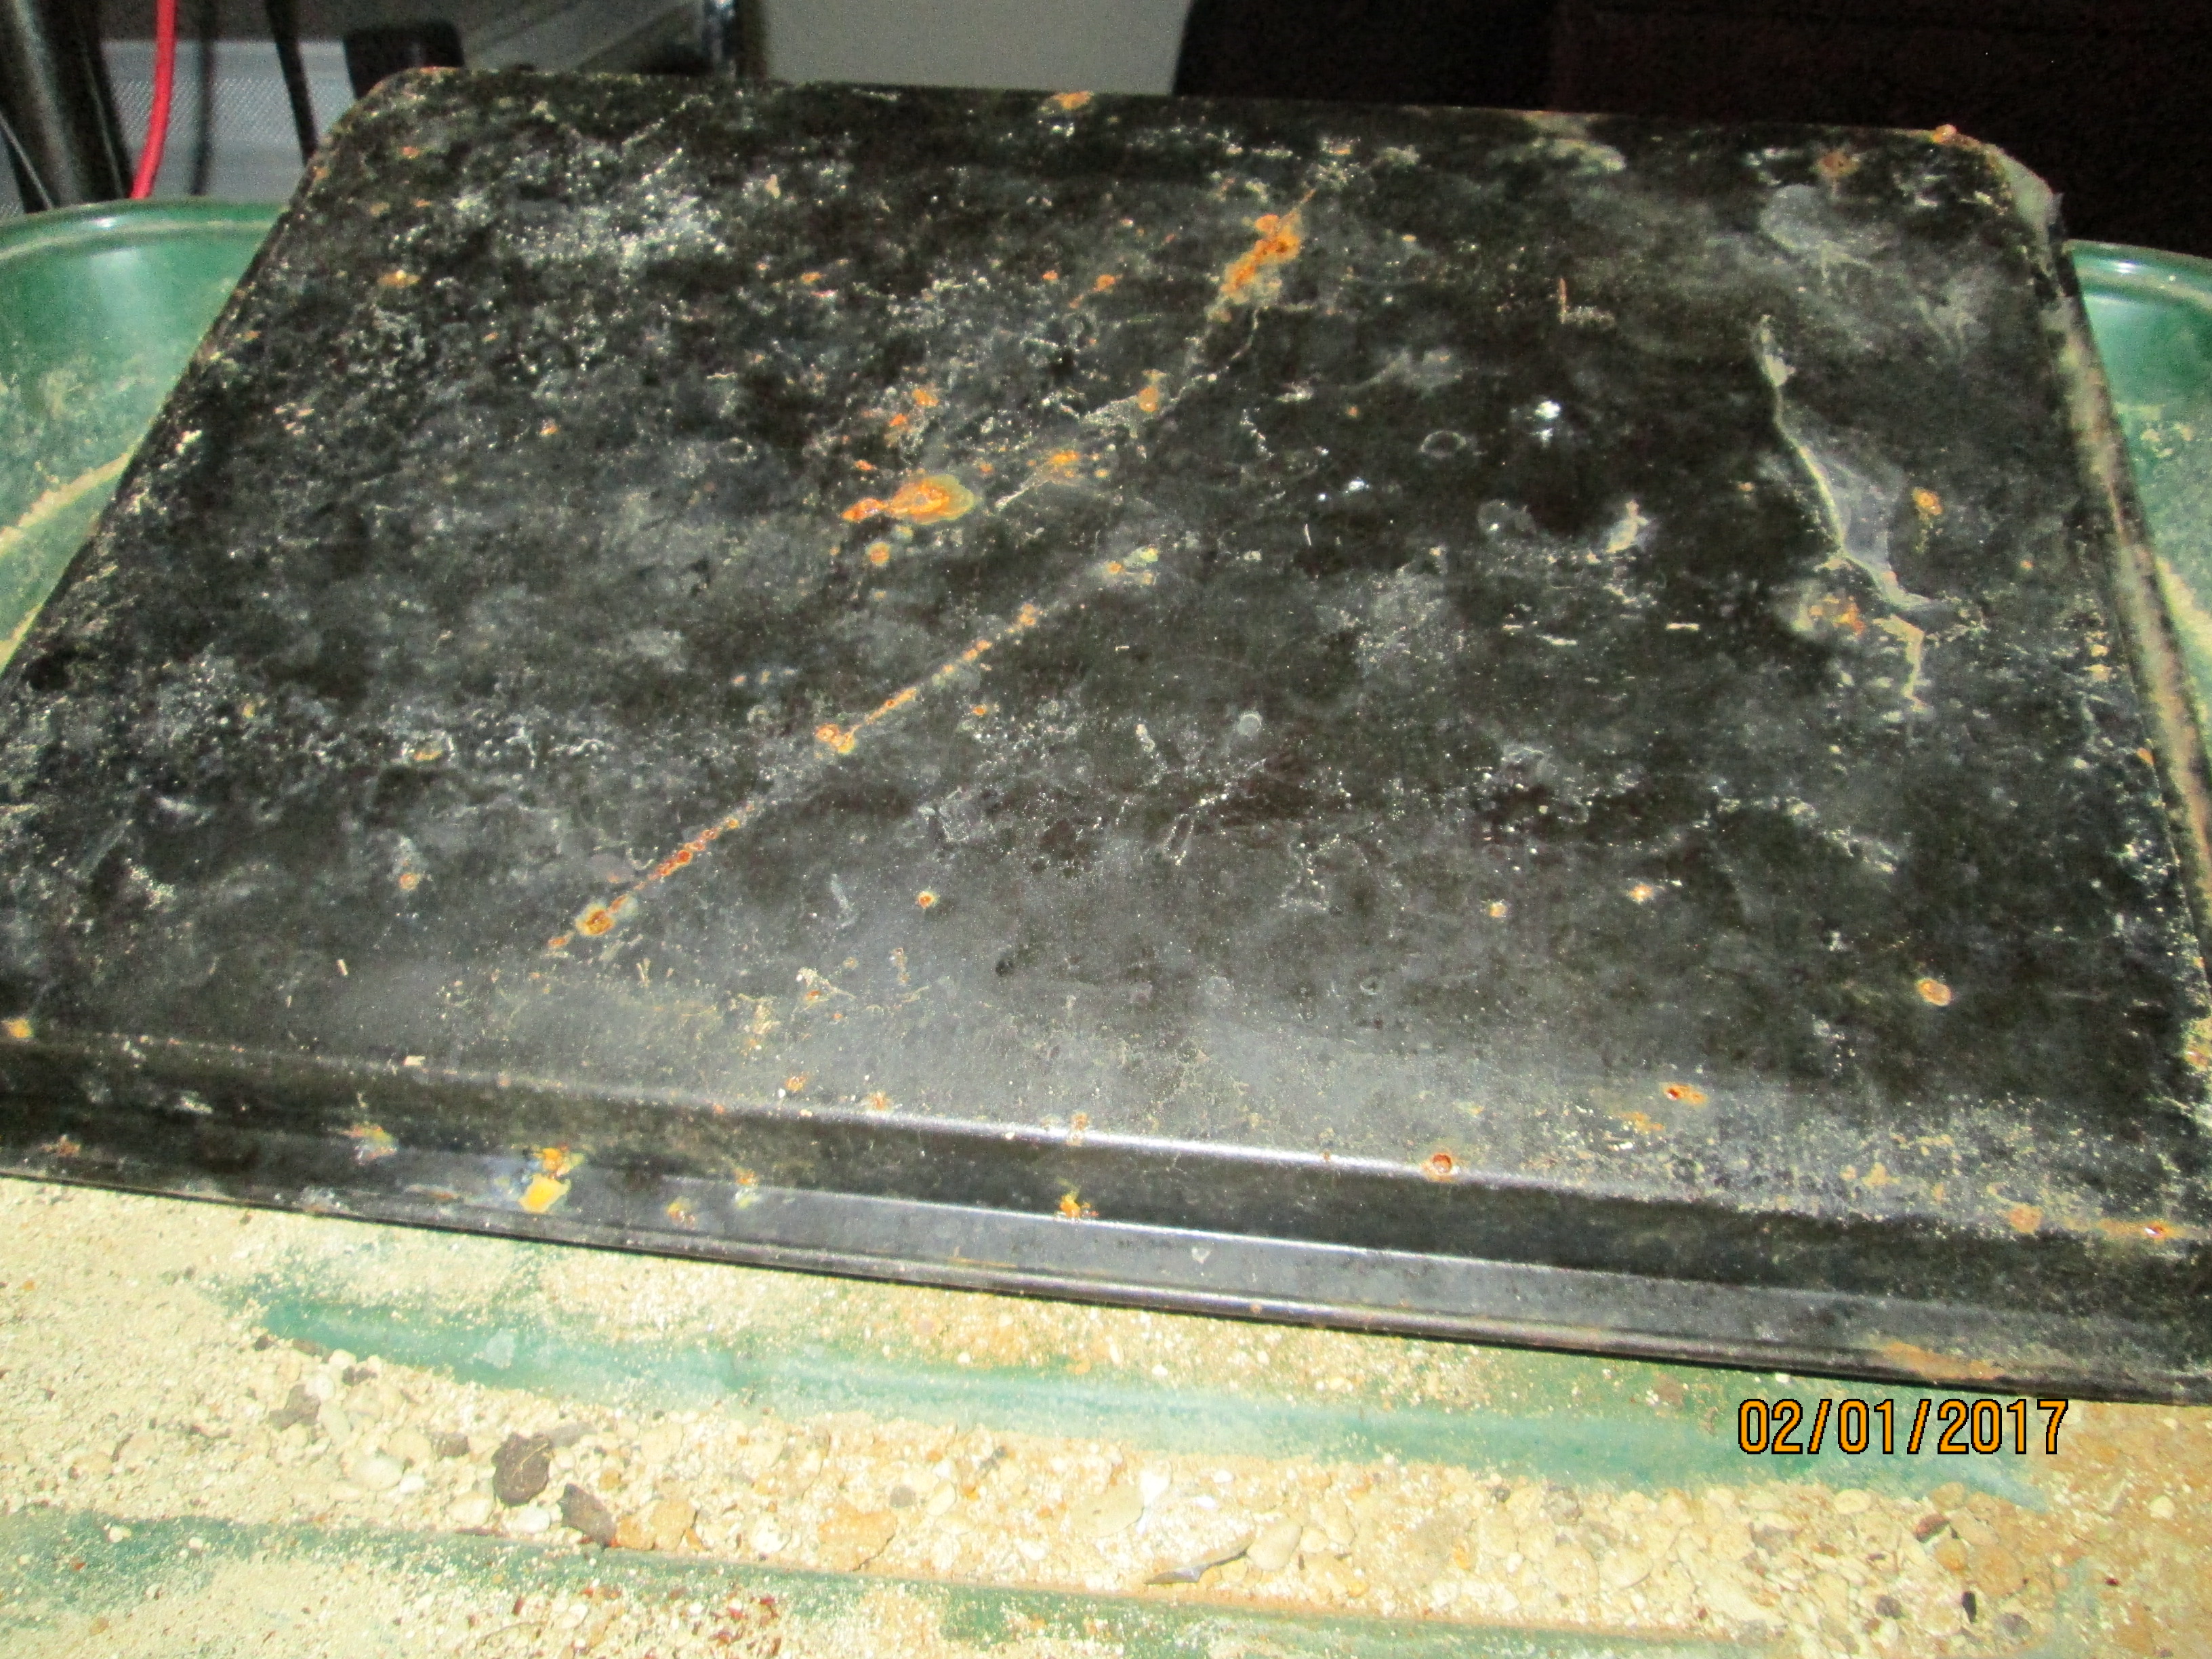
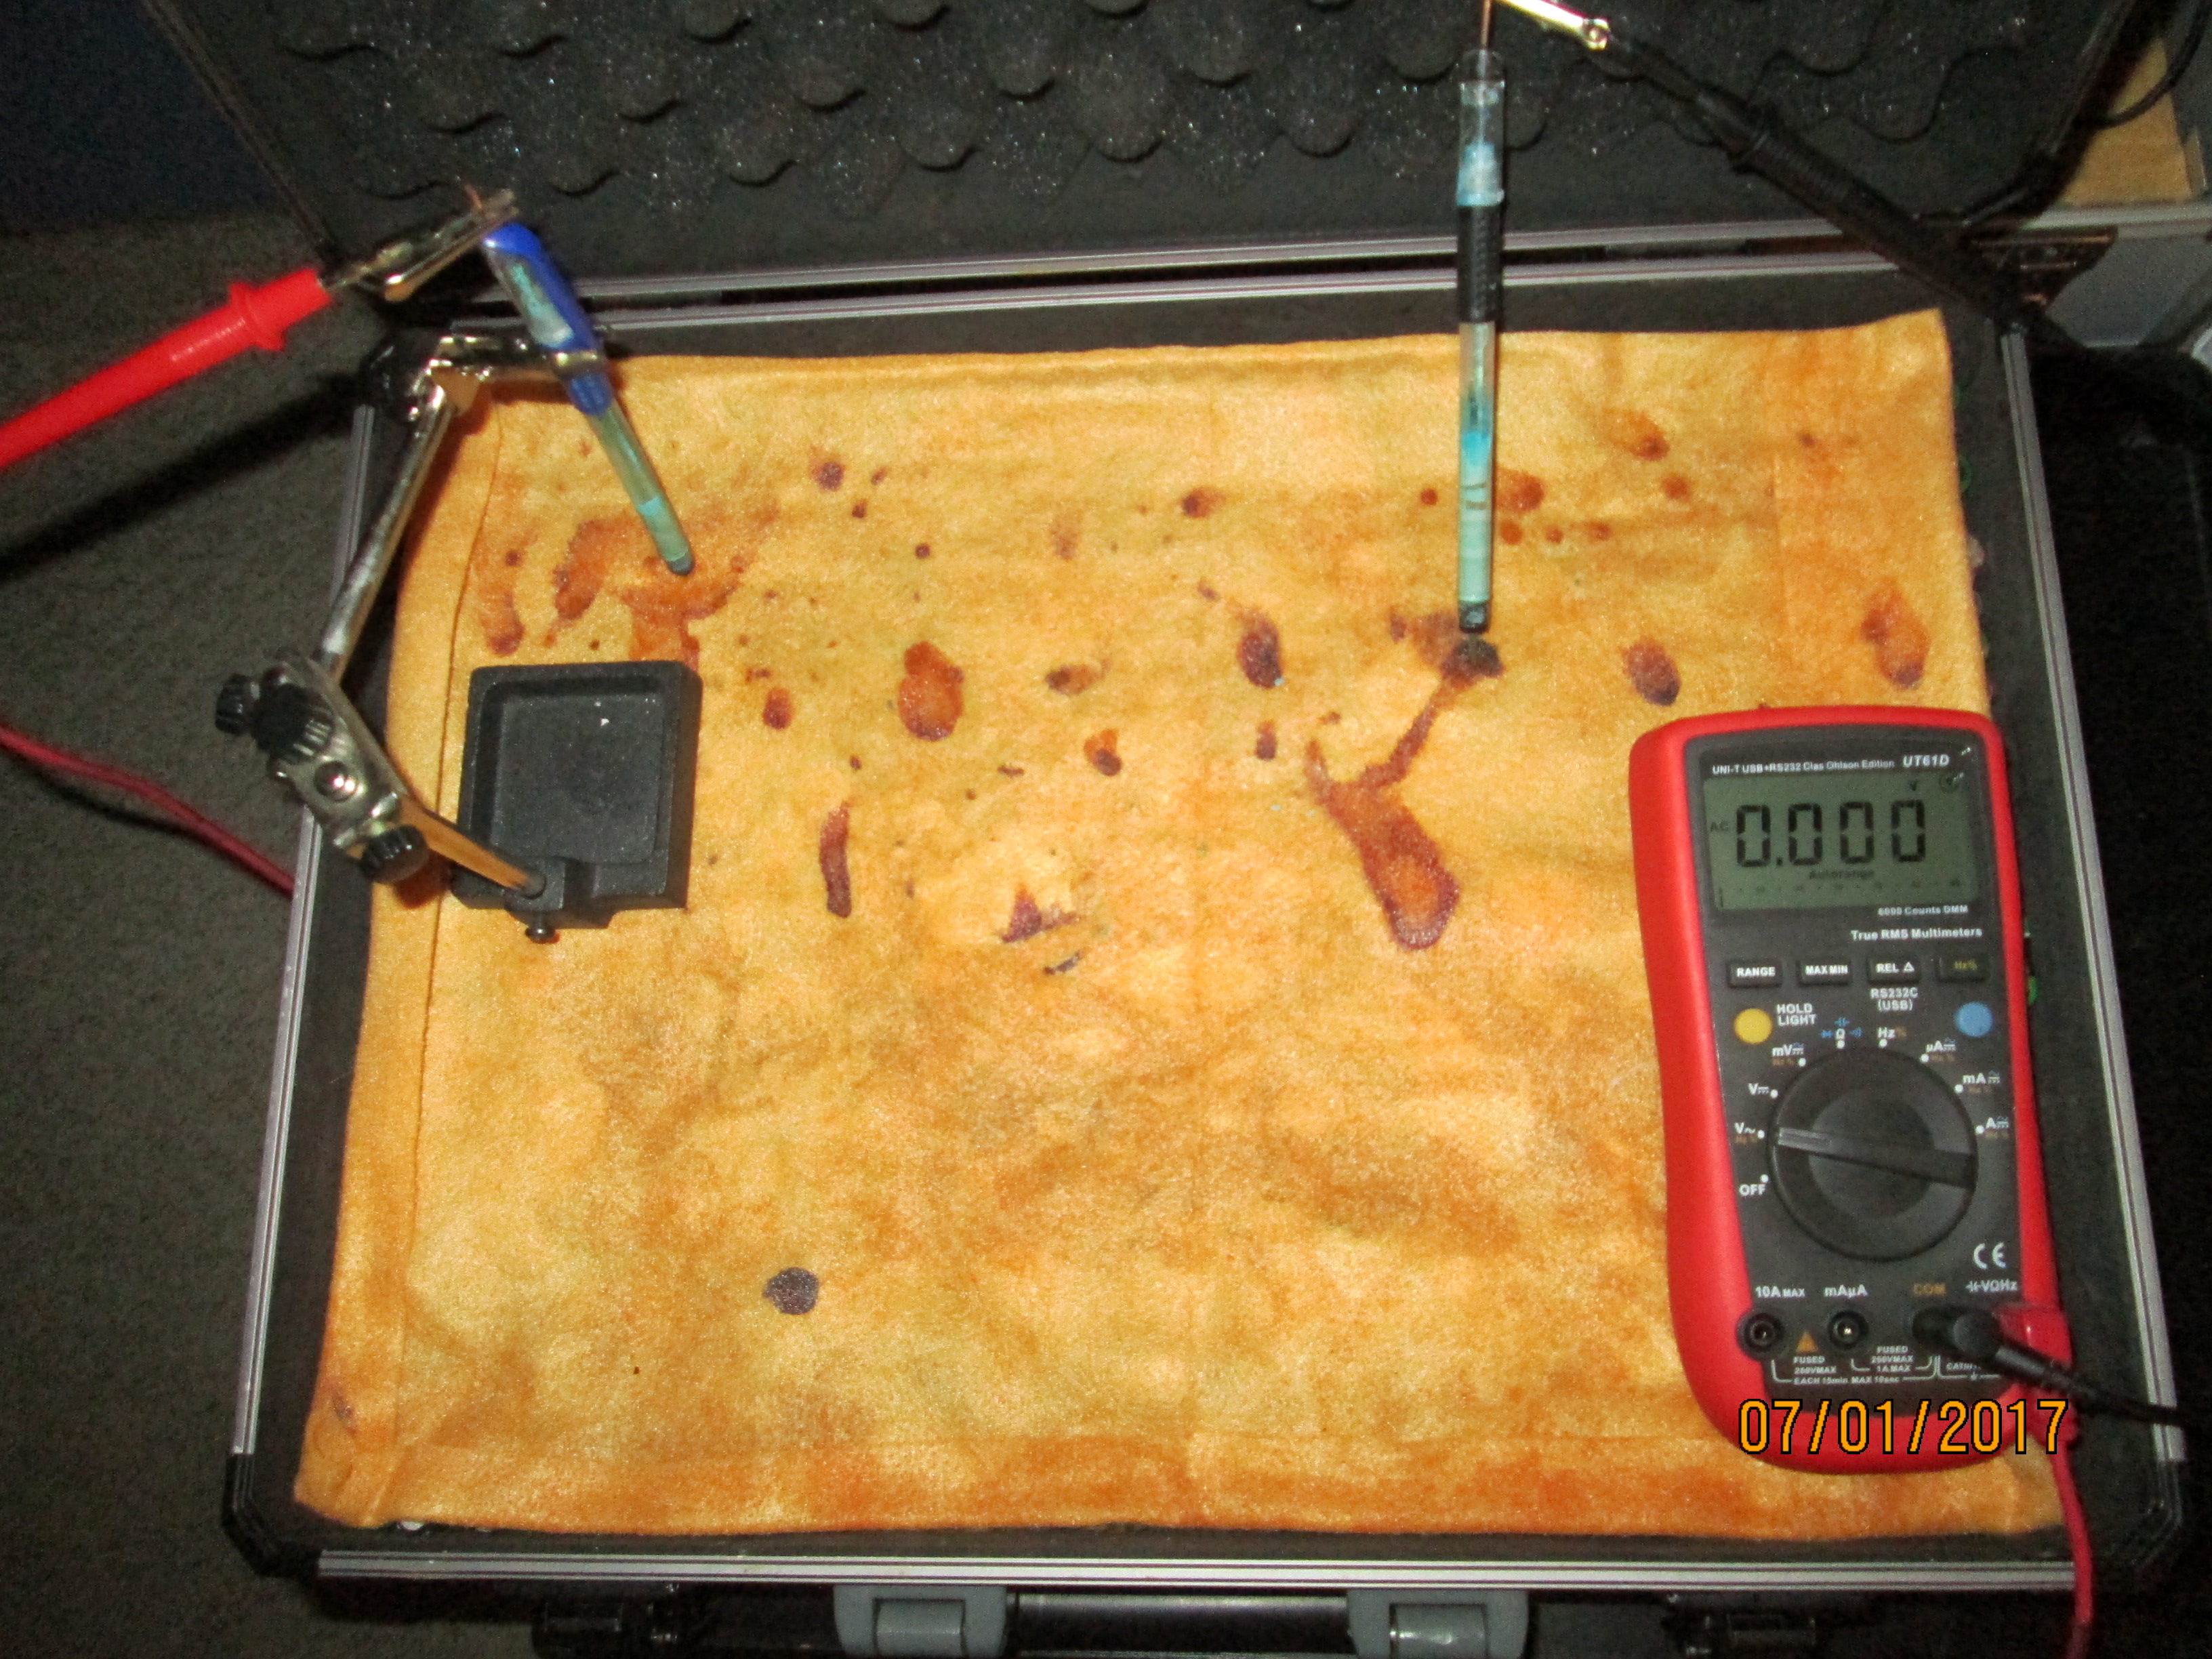
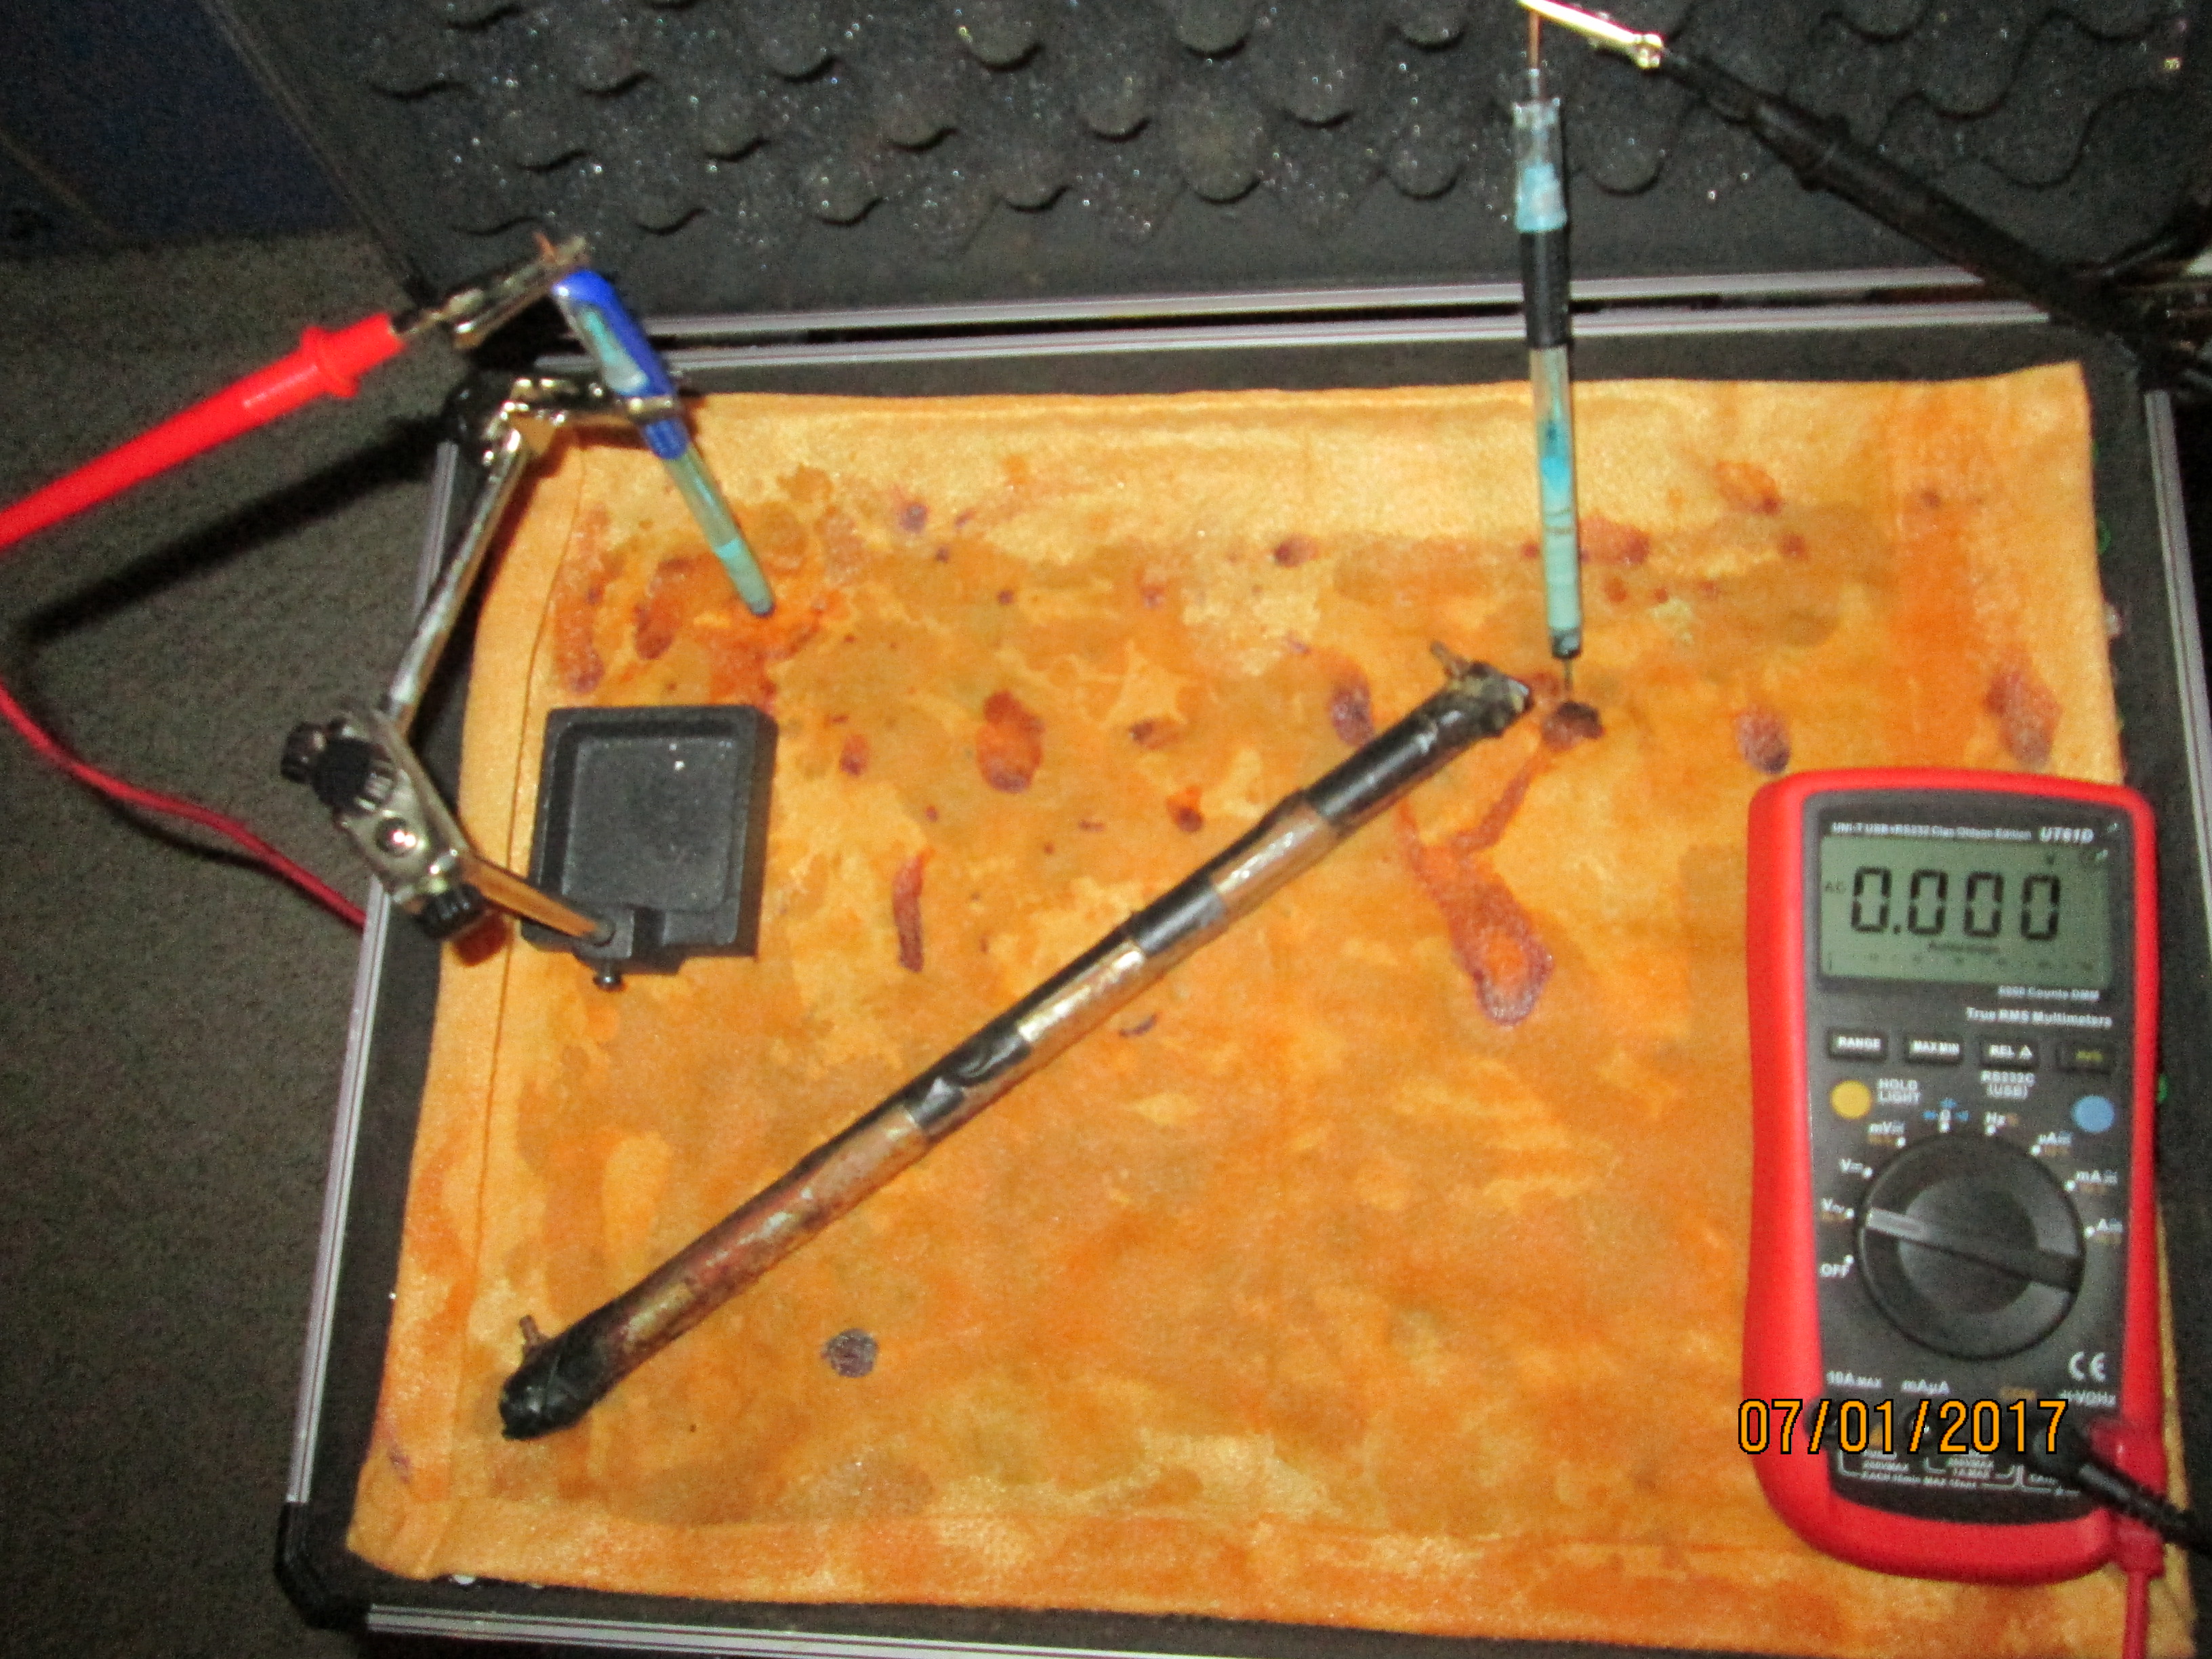
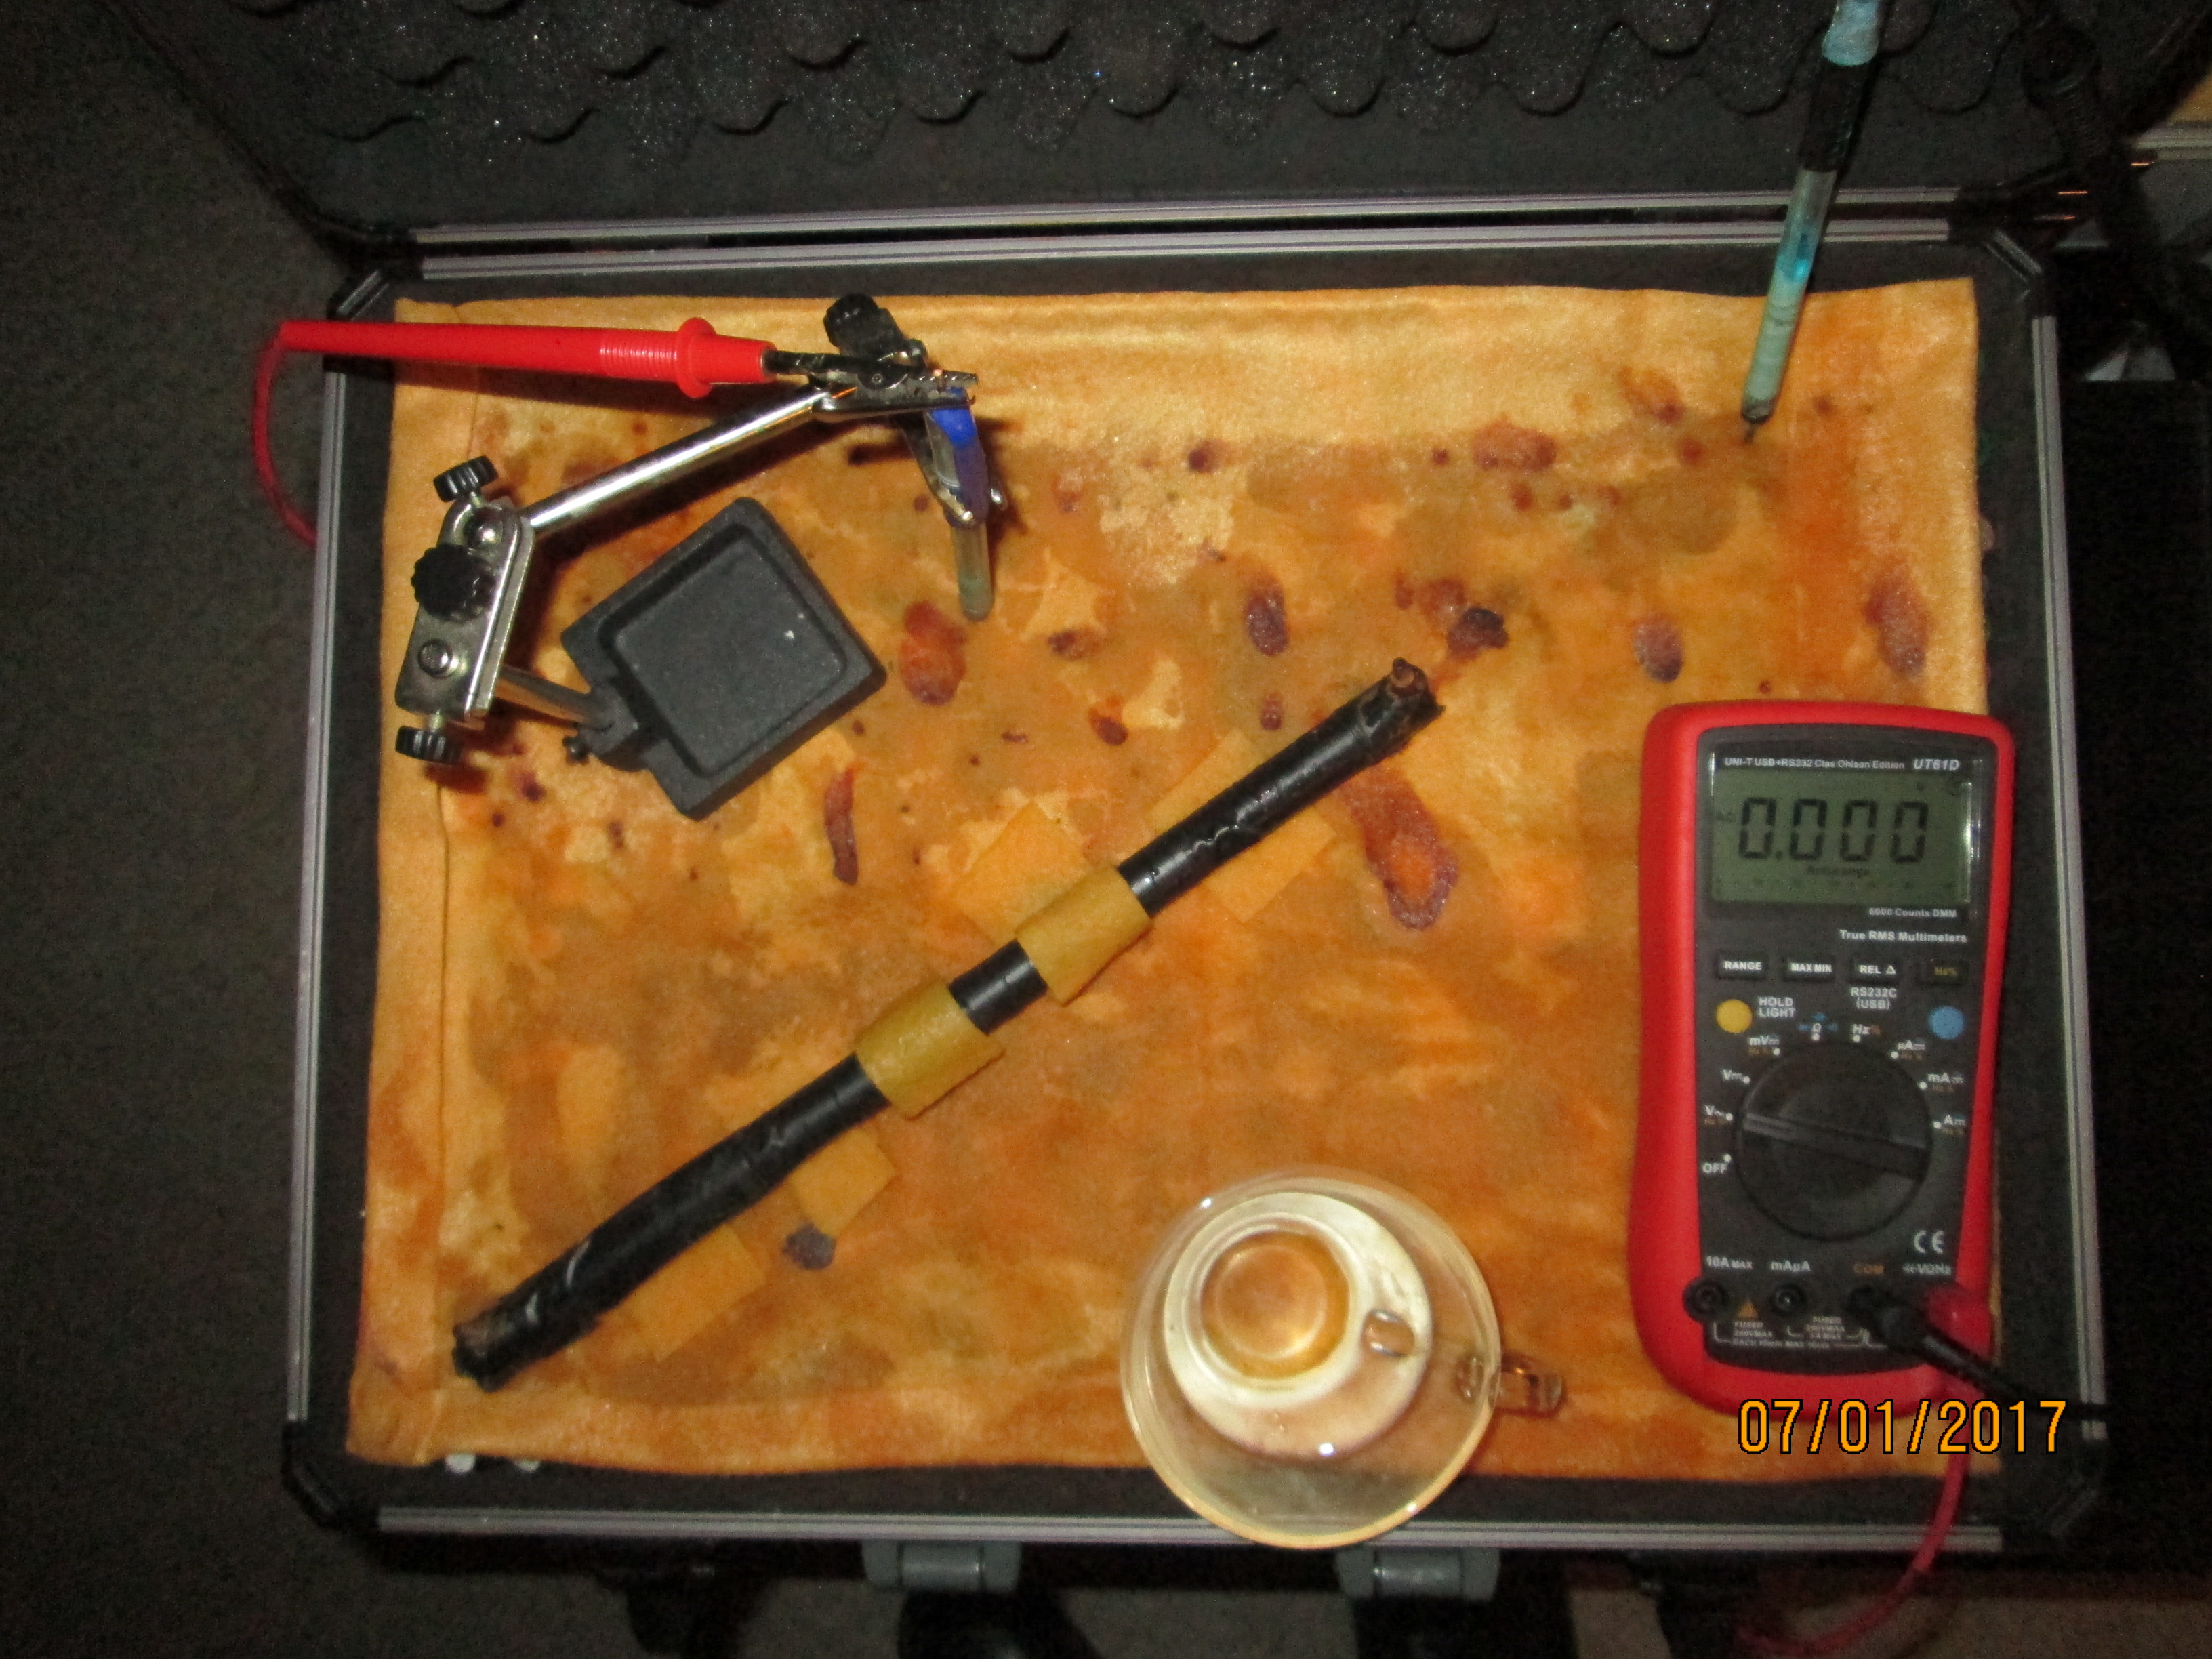
The following pictures are from experiments up until January 2017.
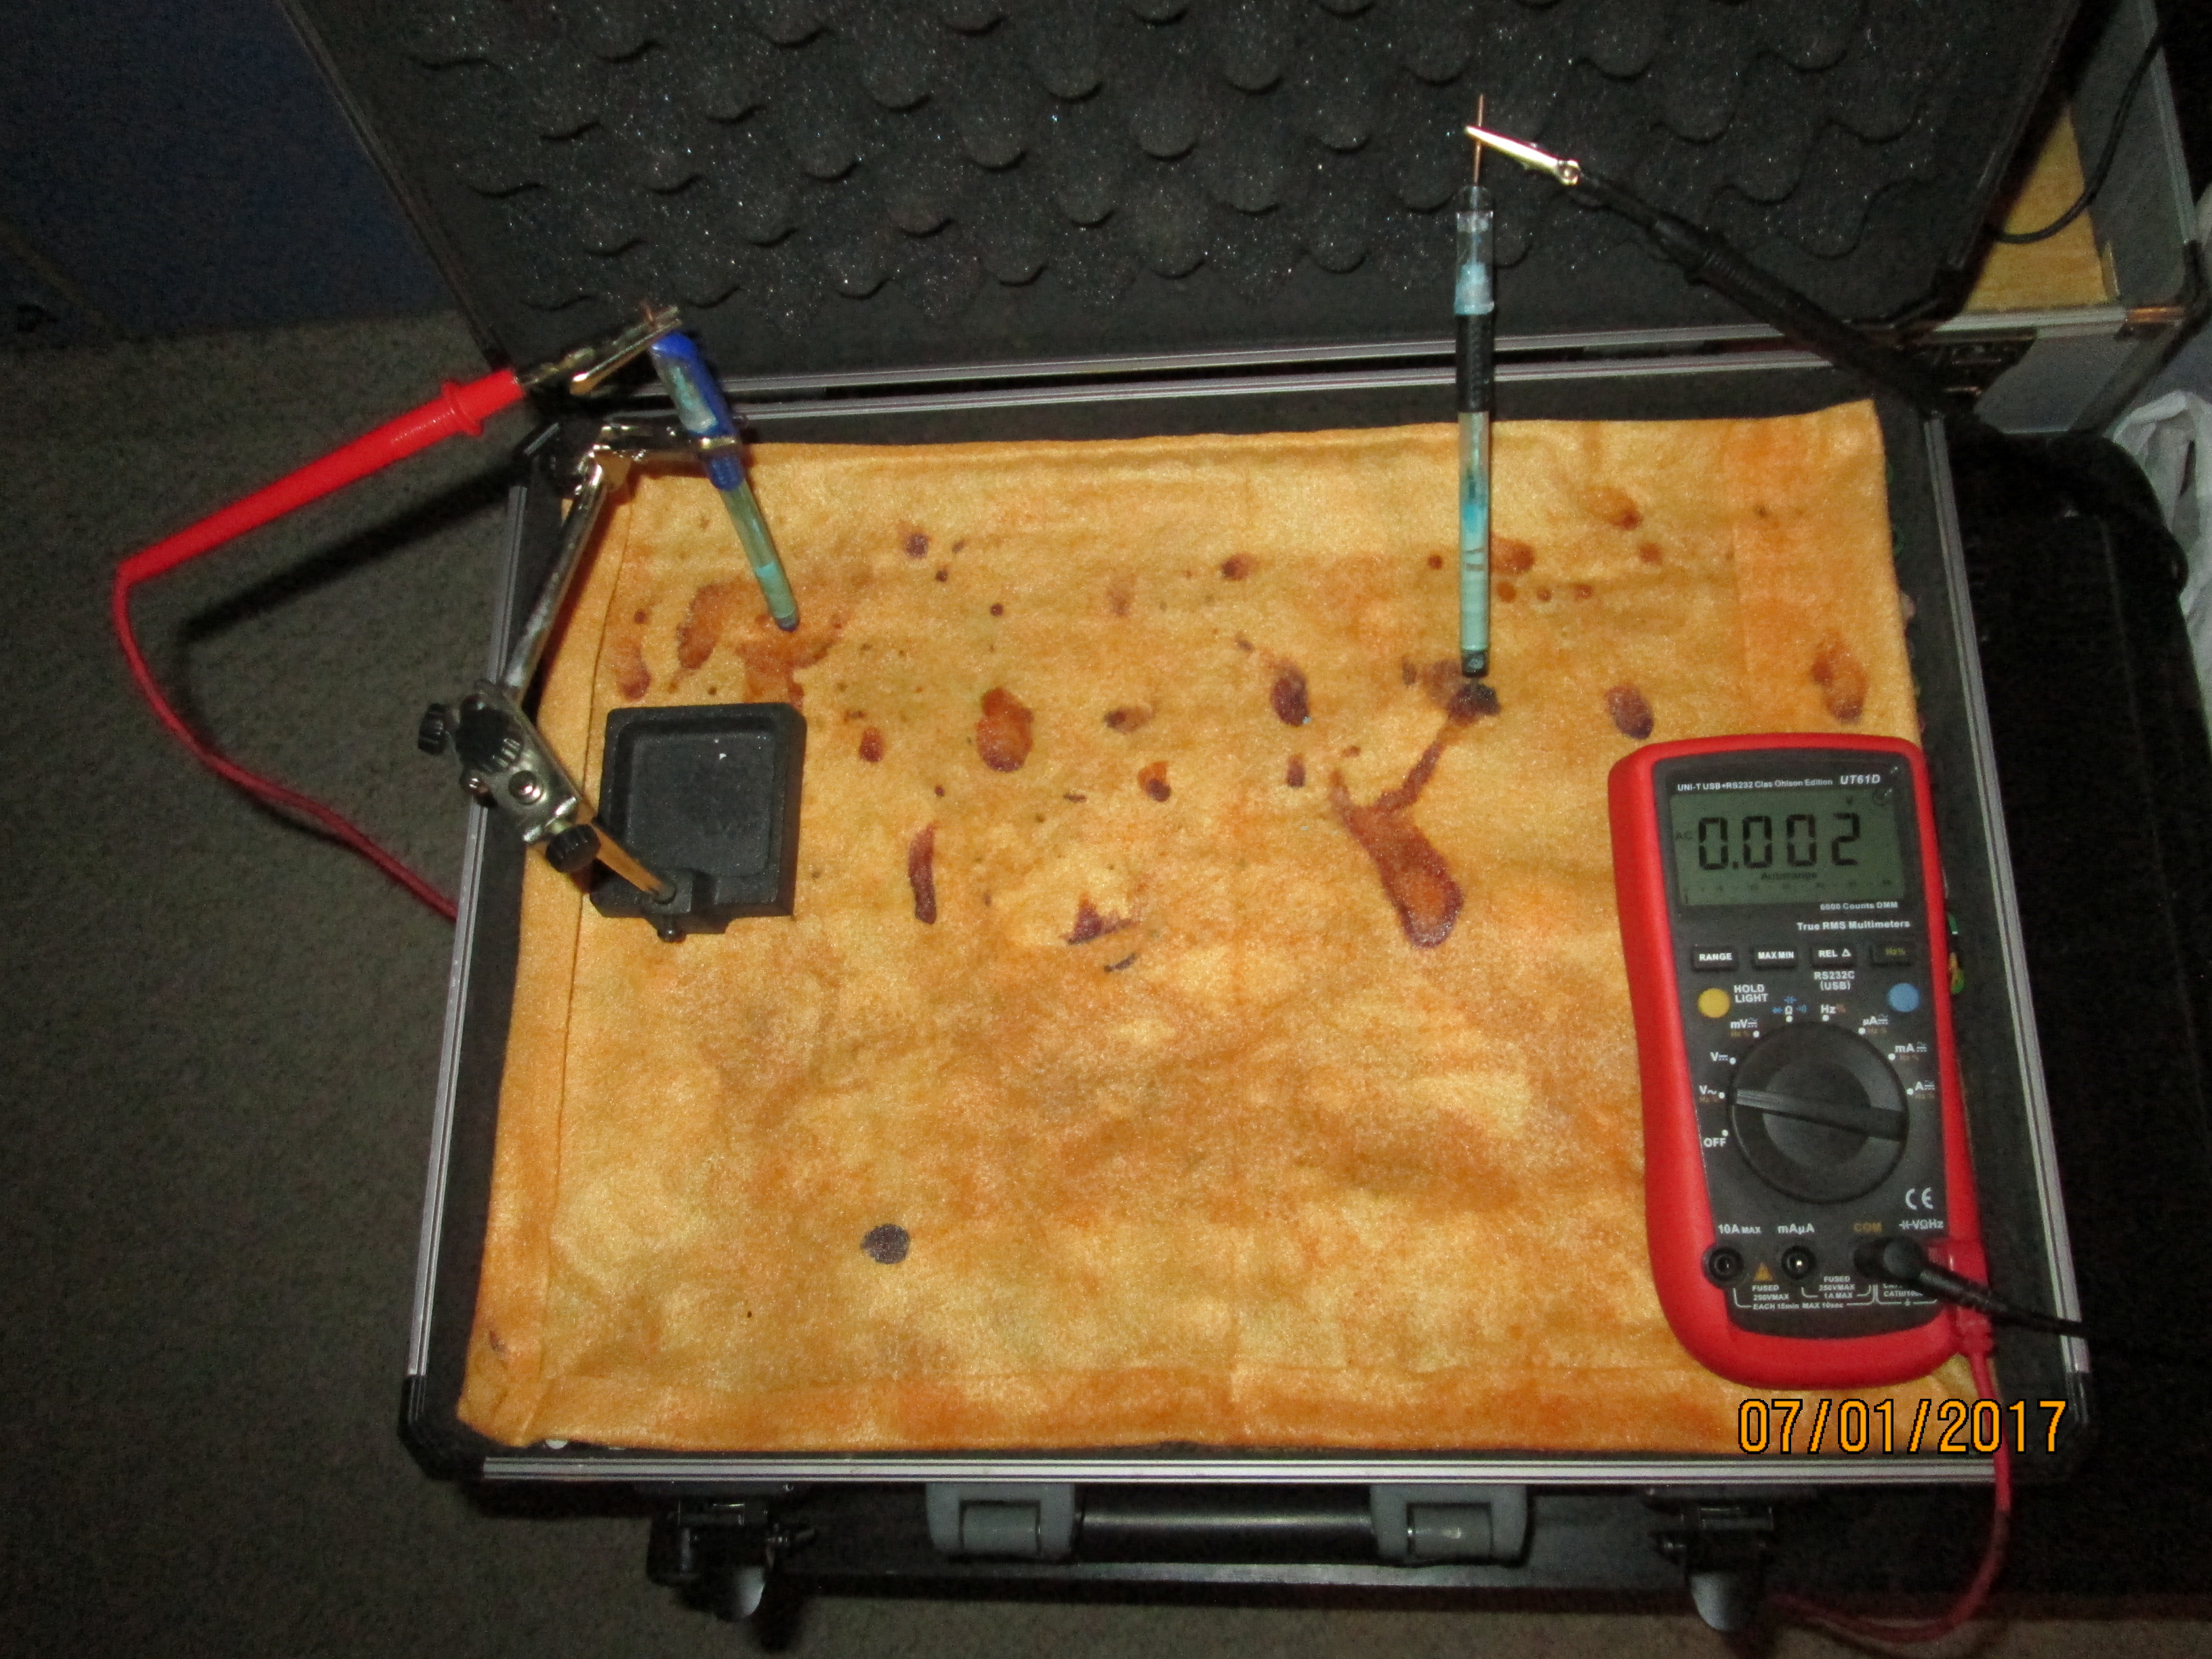
This is the testbed that I used for many of the experiments shown in the videos and other pictures.
This picture shows that the voltage between two electrodes reduces after introduction to zero. We can watch this happening on a data logger of oscilloscope and the possible explanation is that the meter itself is introdicing a path through which the equilibrium of the system is being maintained. This tends to corroborate the principles of my original DCVG survey in which I used a low resistance ammeter because high resistance voltmeters were not available at that time.
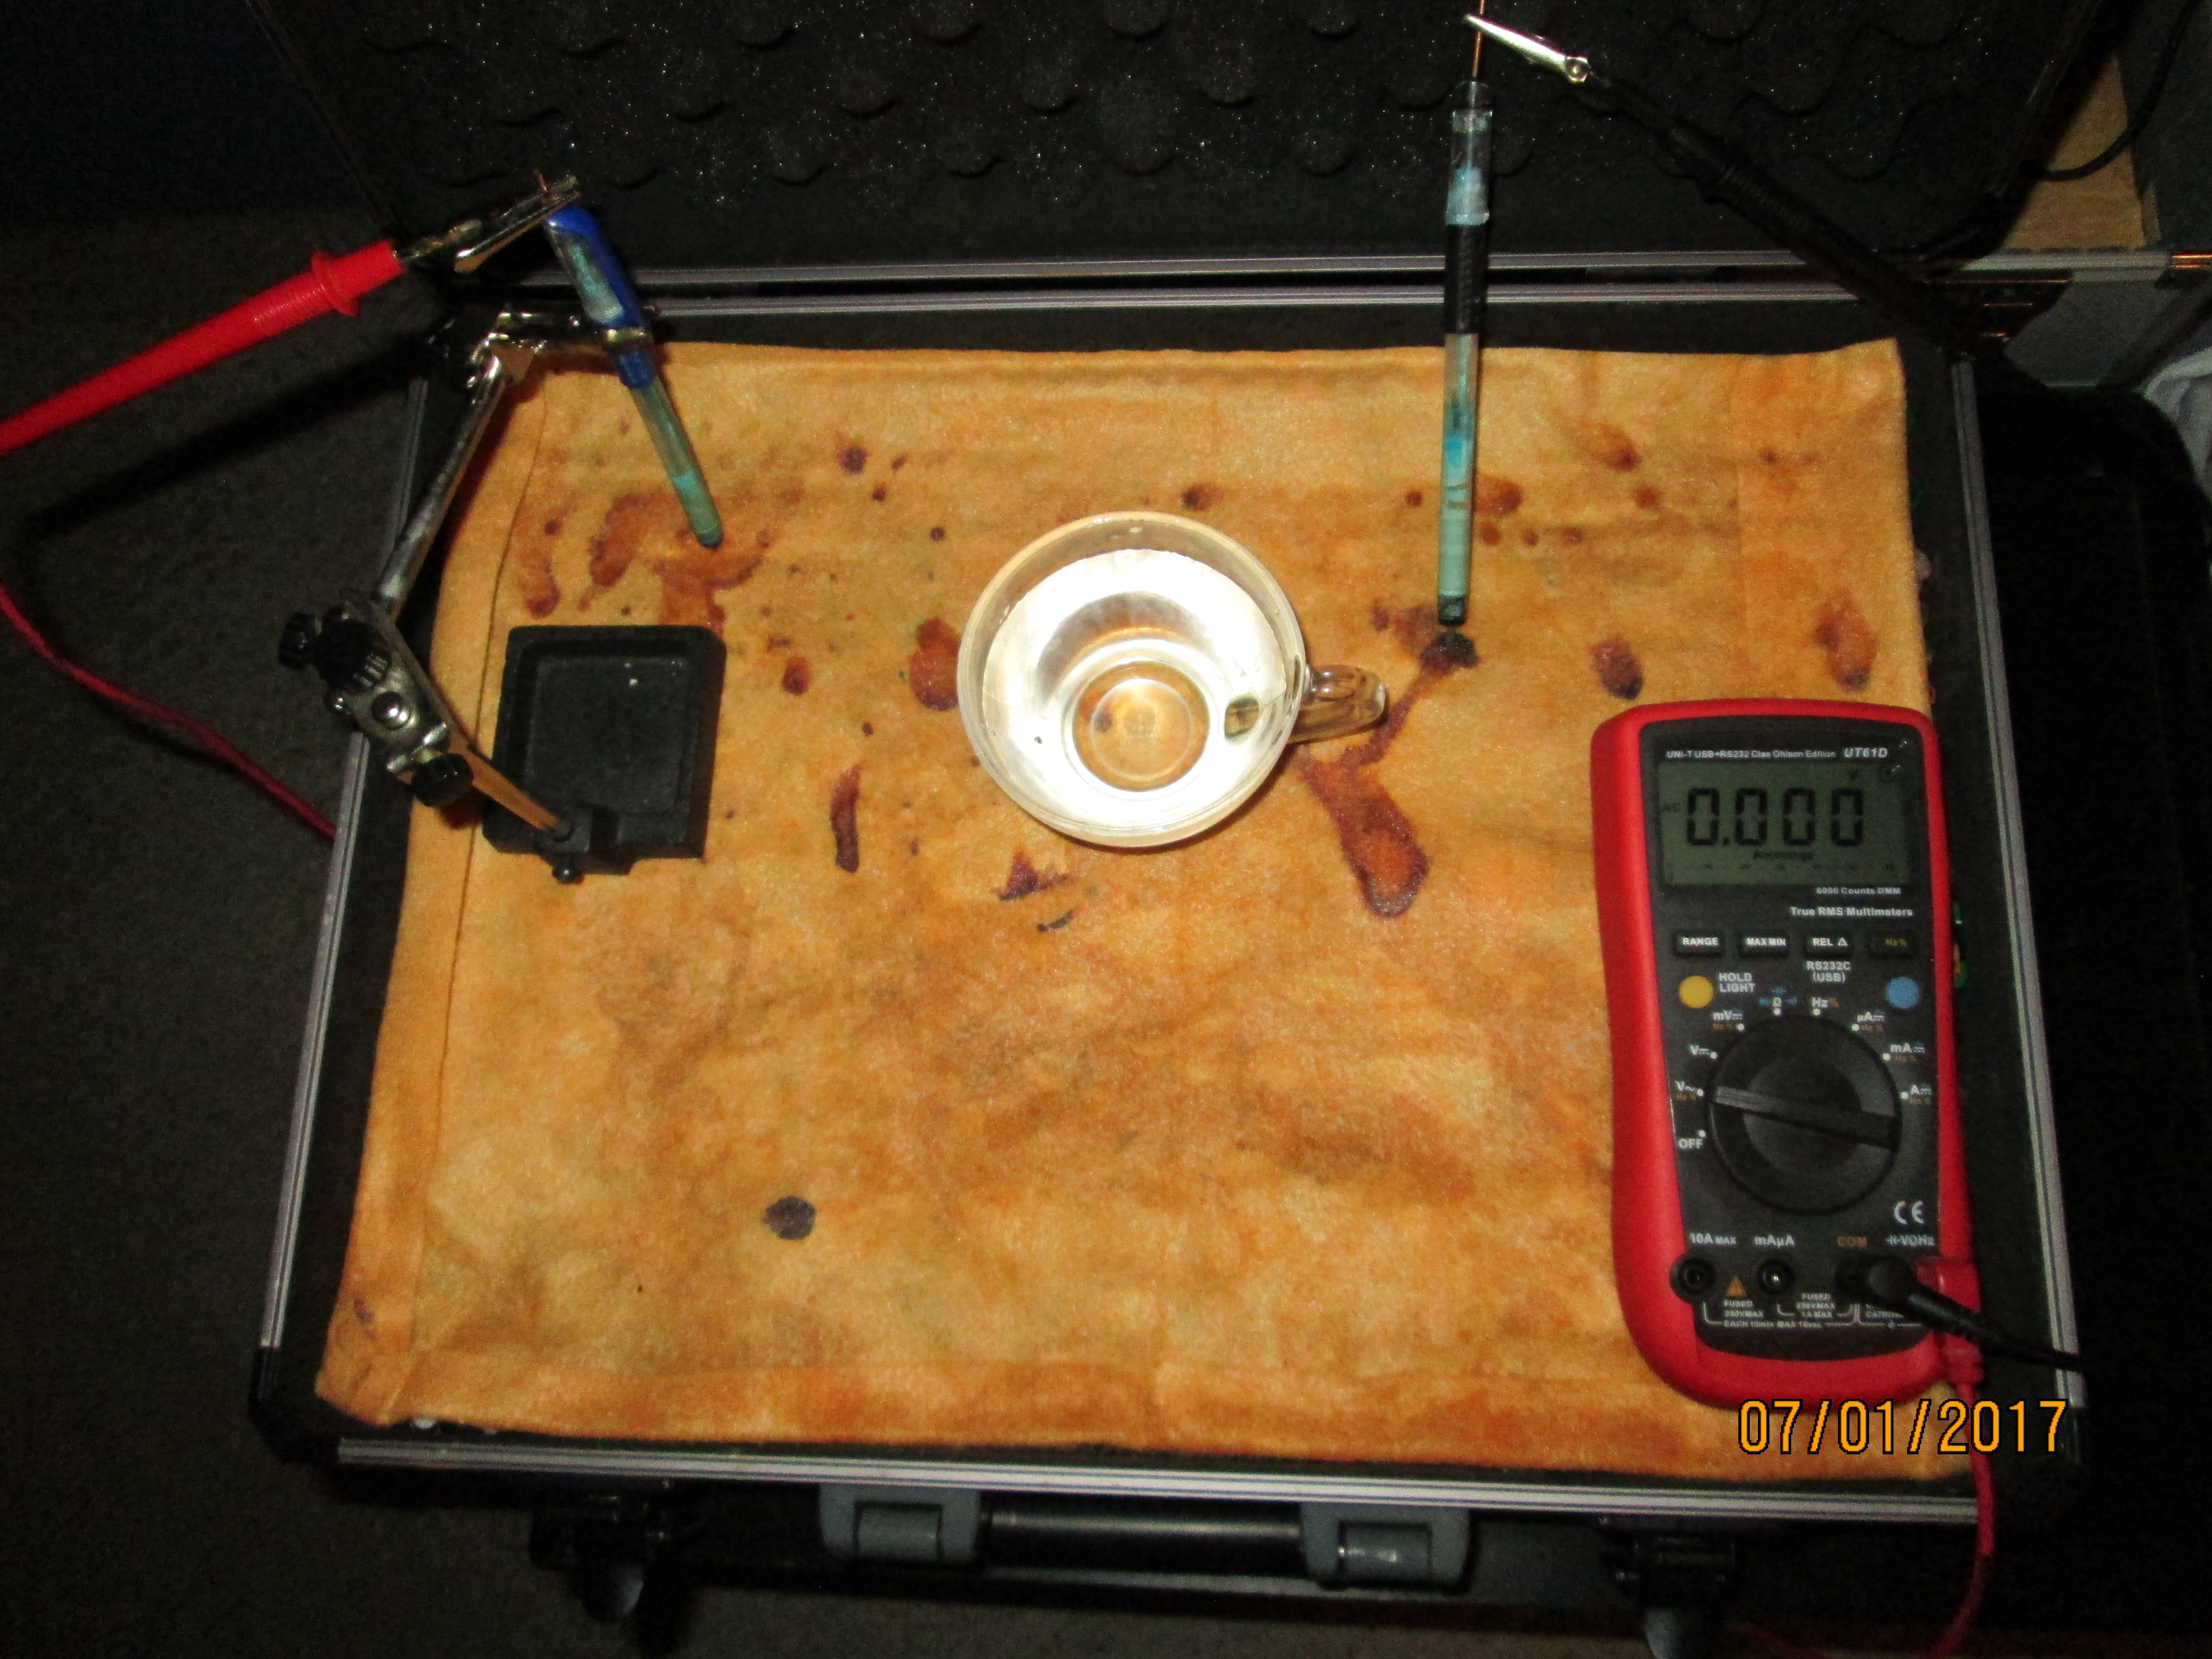
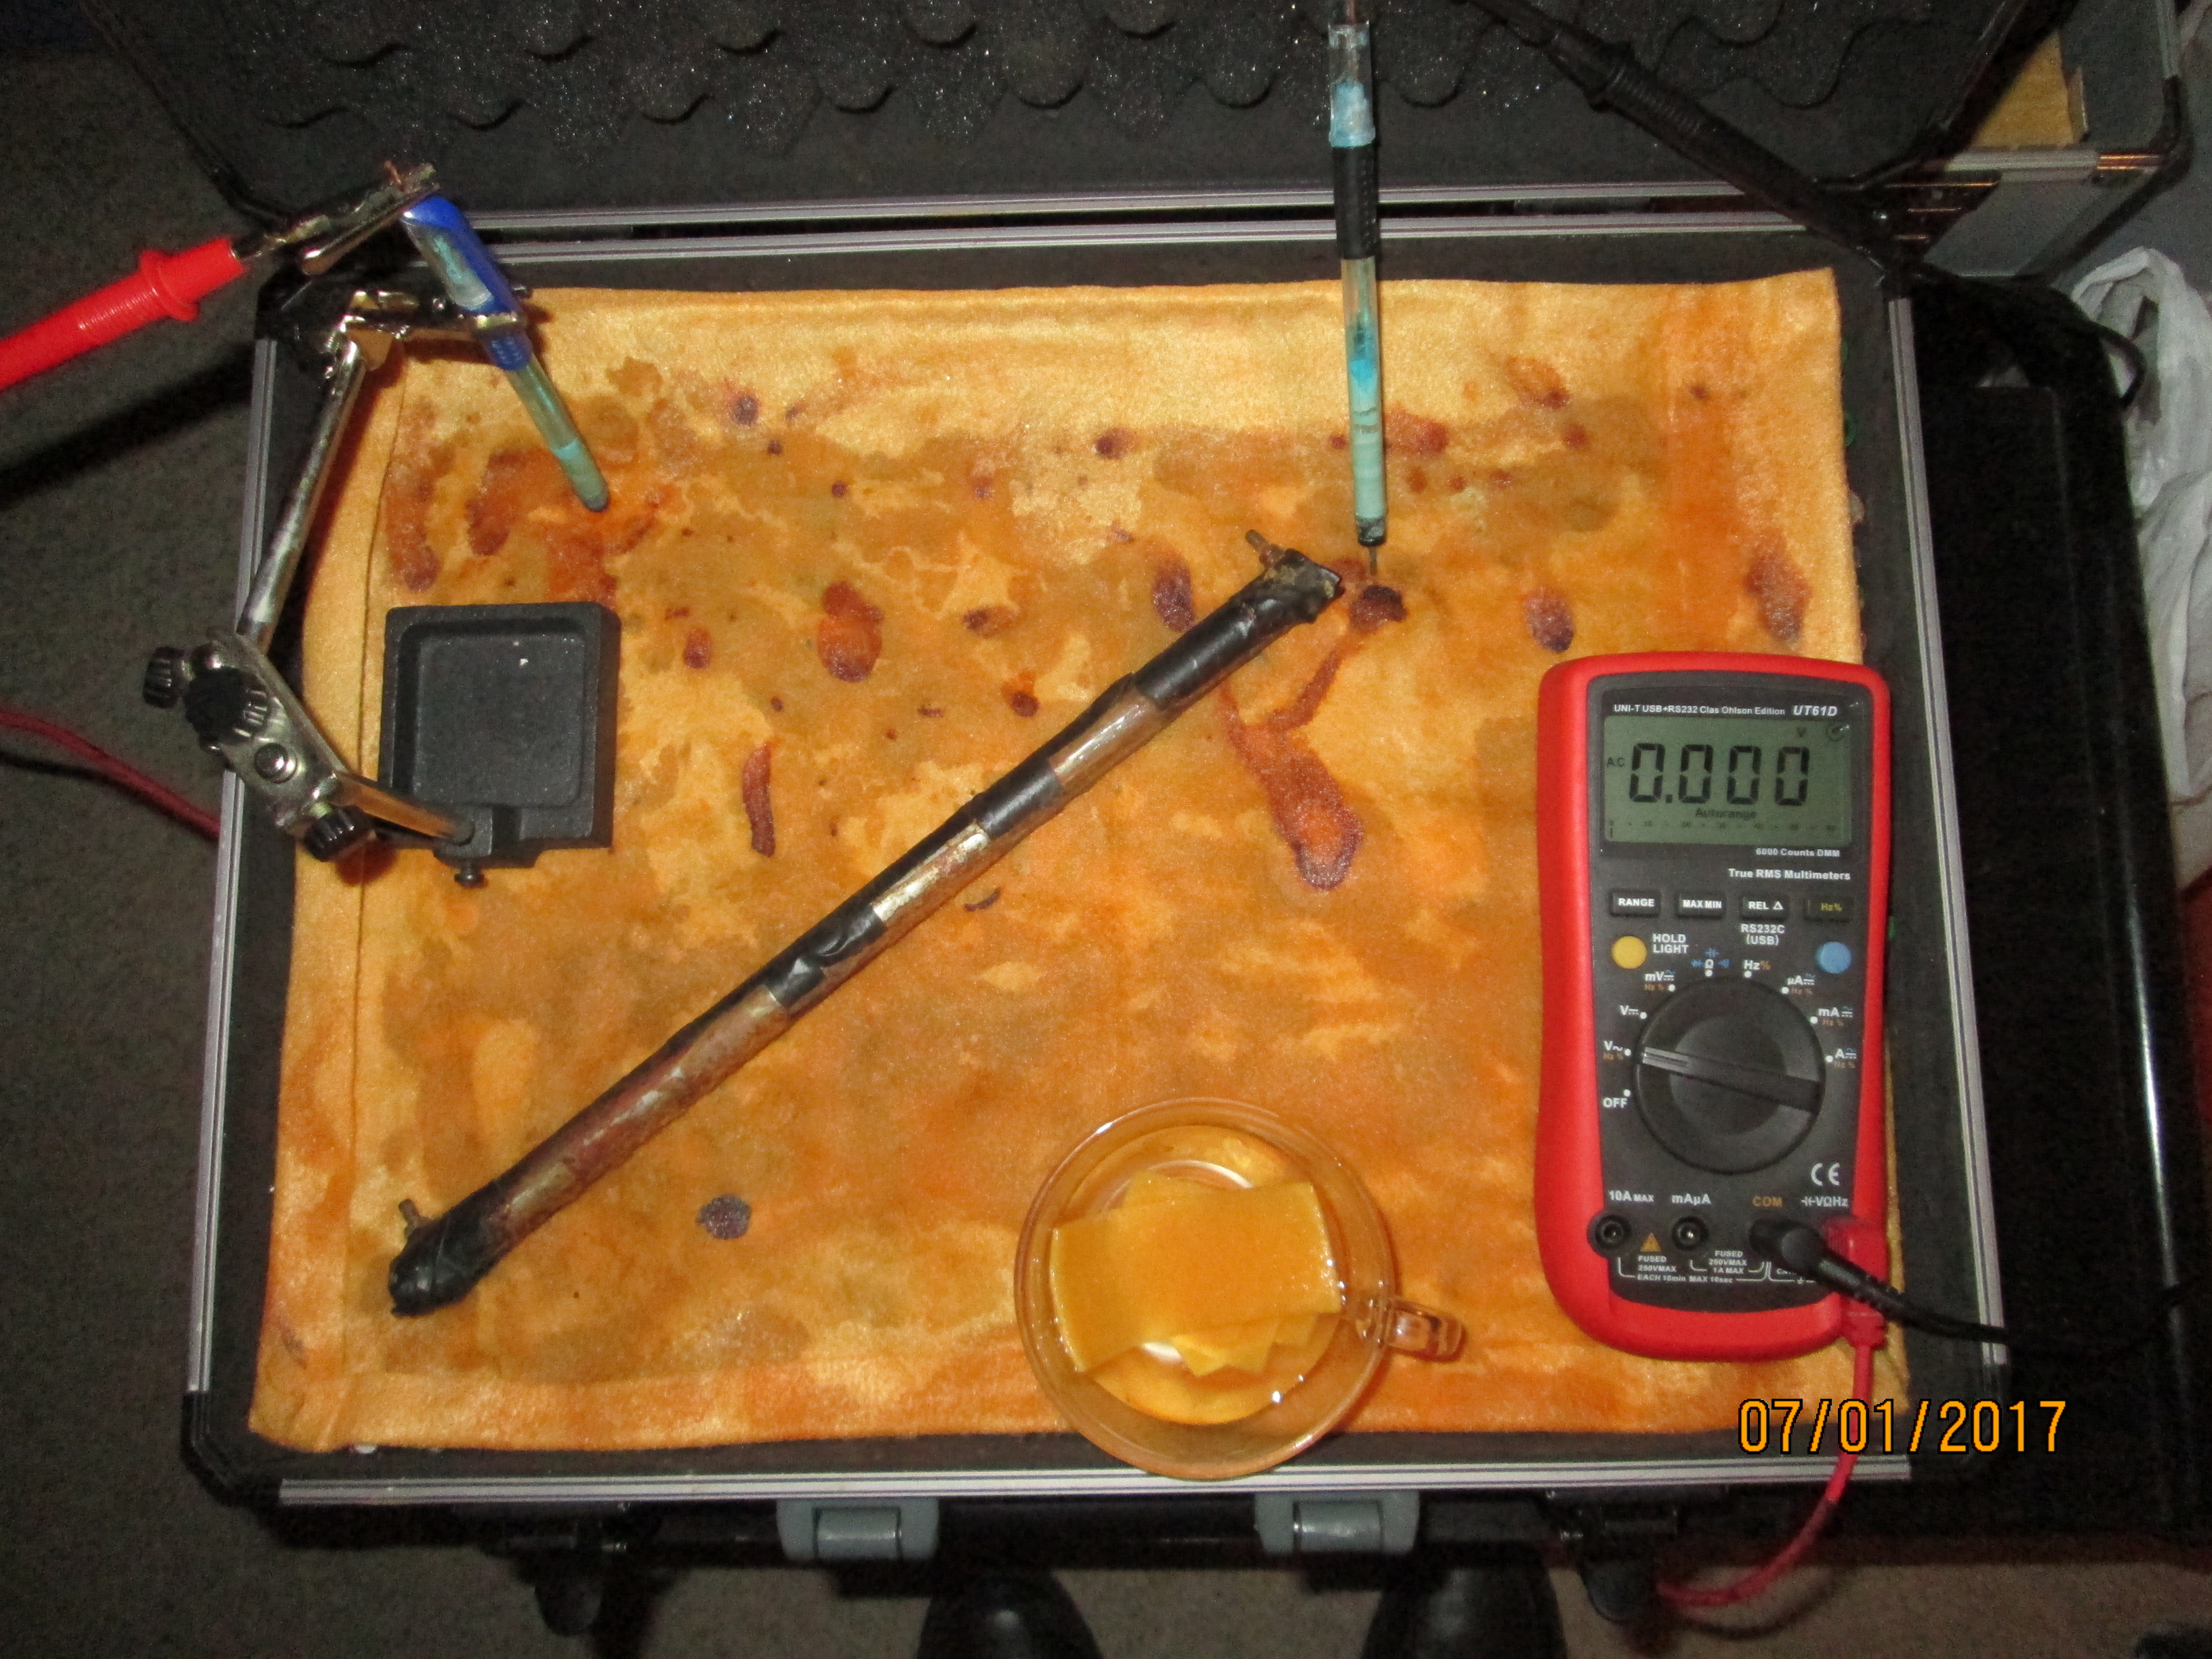
In this next picture you can see that the reading os zero at whic point it rested and did not reverse polarity.
I therefore tried adding some tap water and this did not change the reading.
I soaked the whole of the absorbant cloth but the reading did not change.
I added yet more water wih no change in the meter reading.
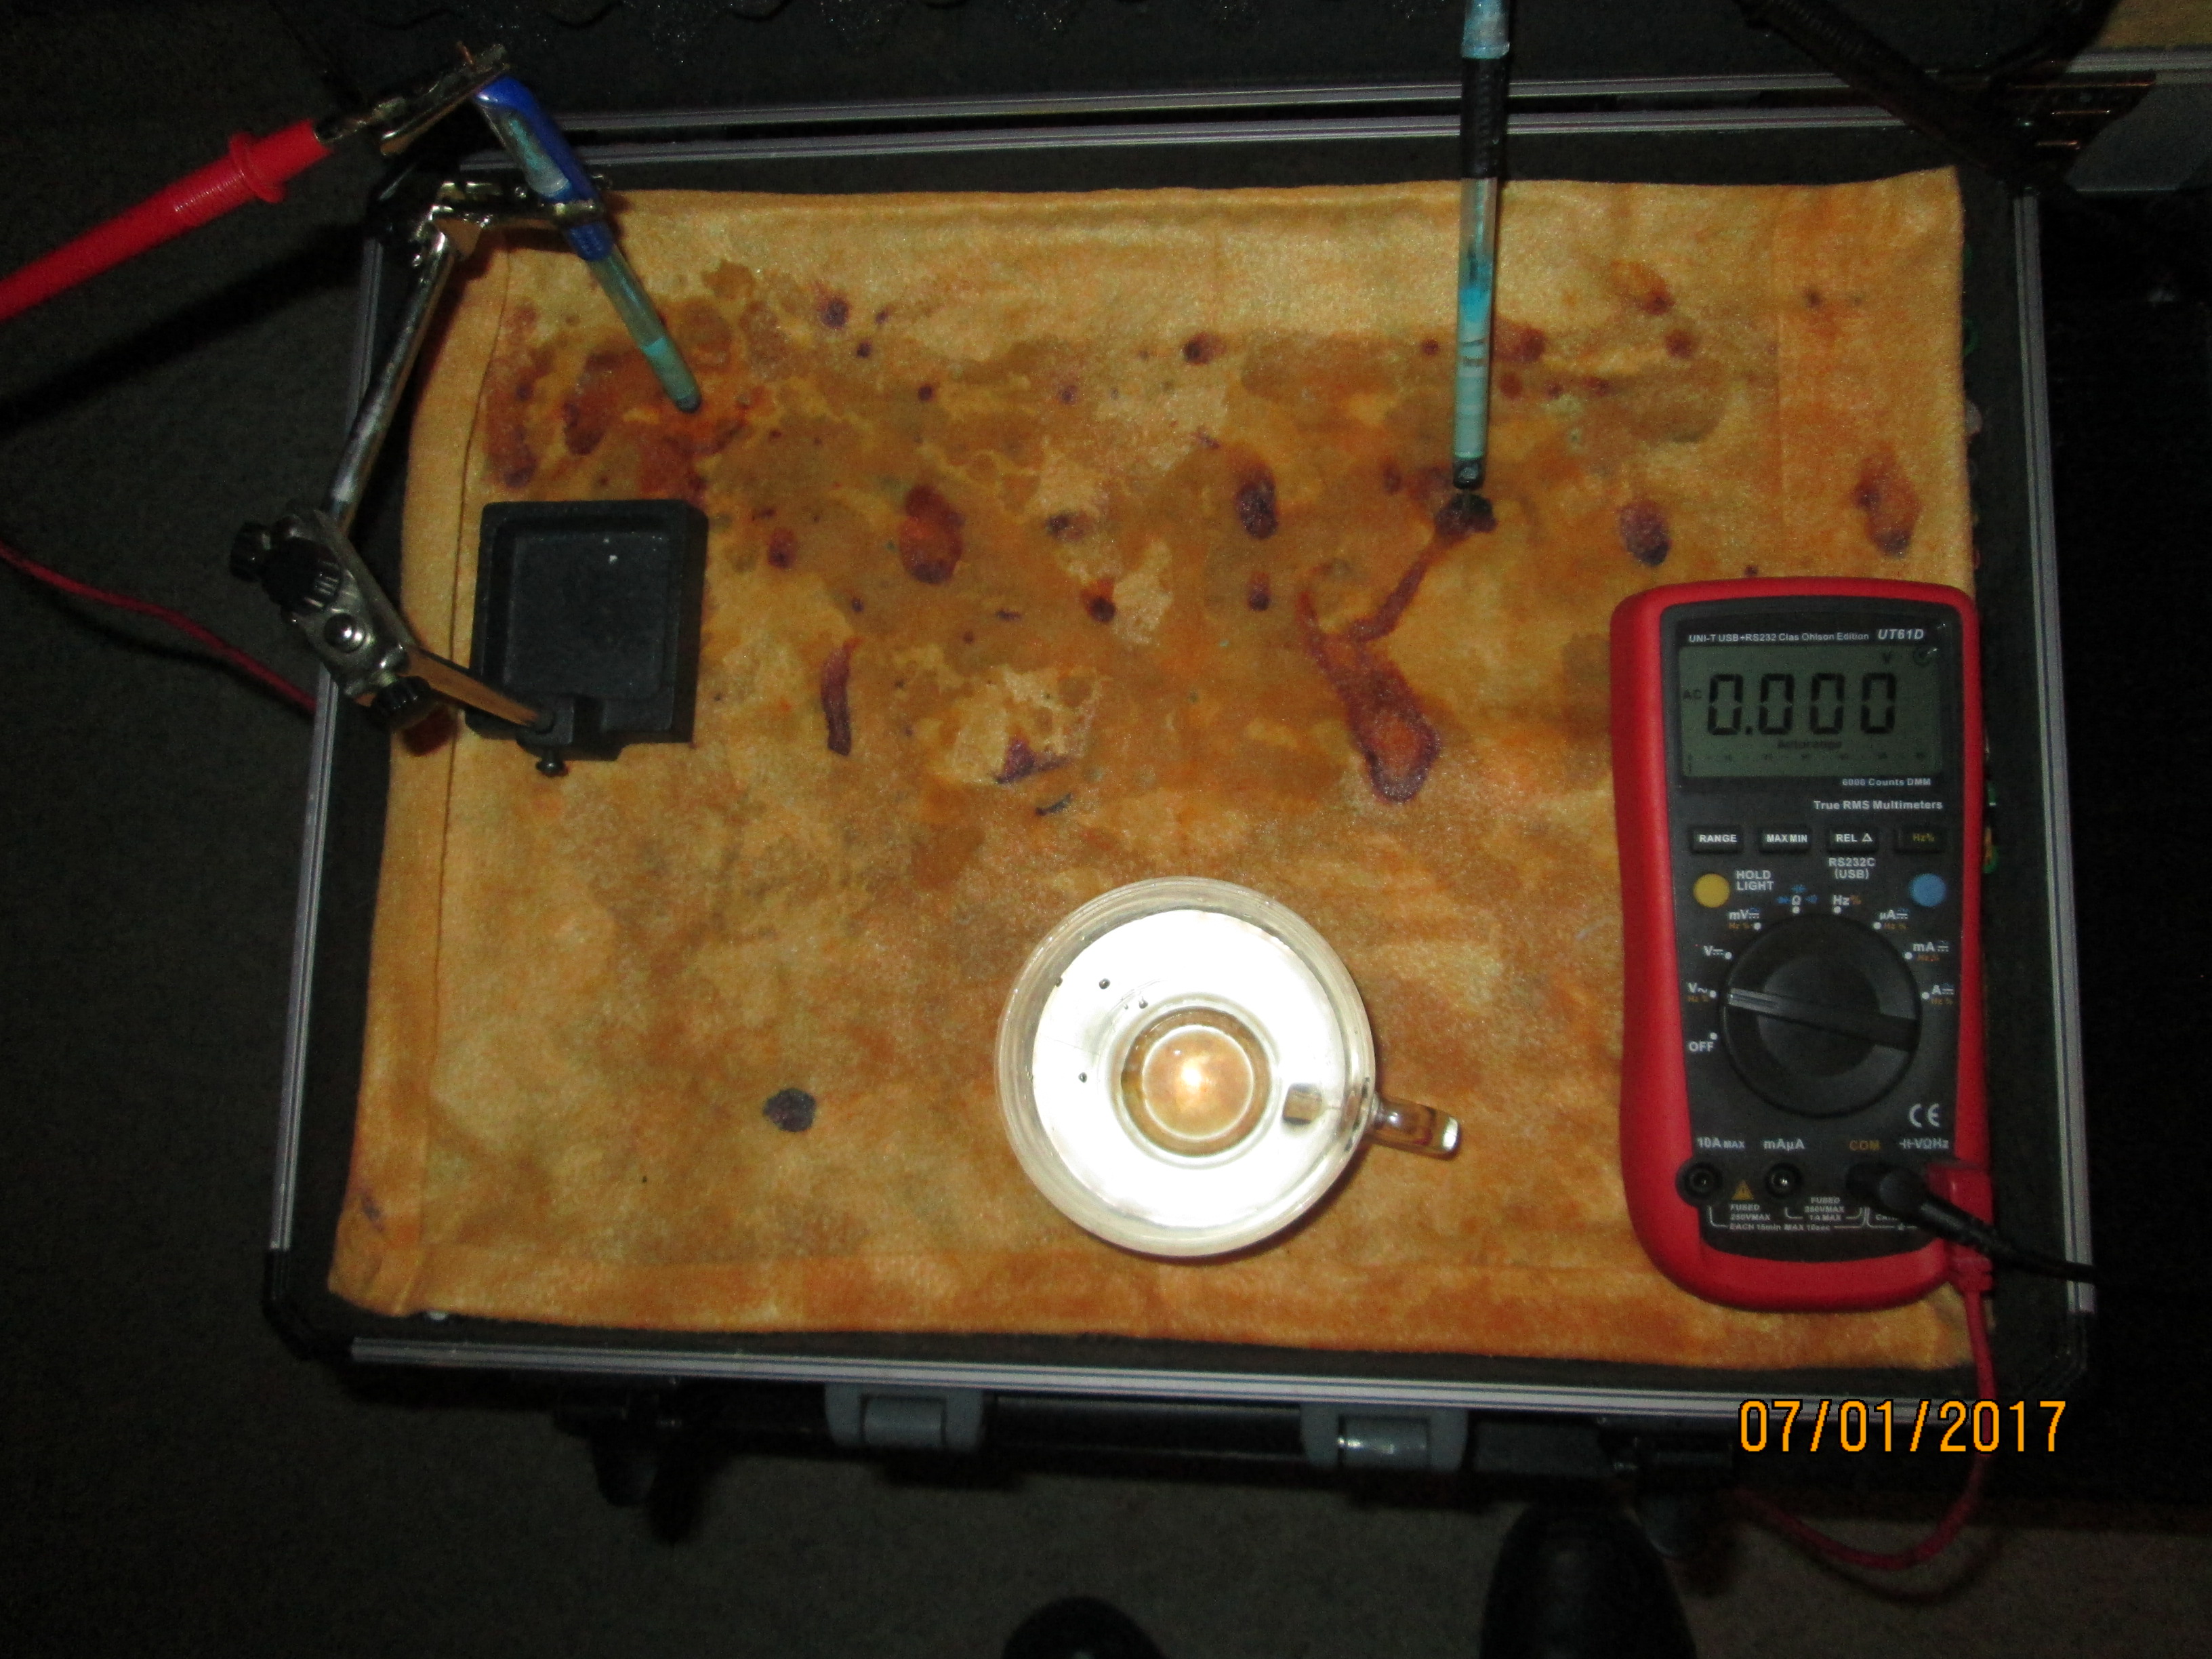
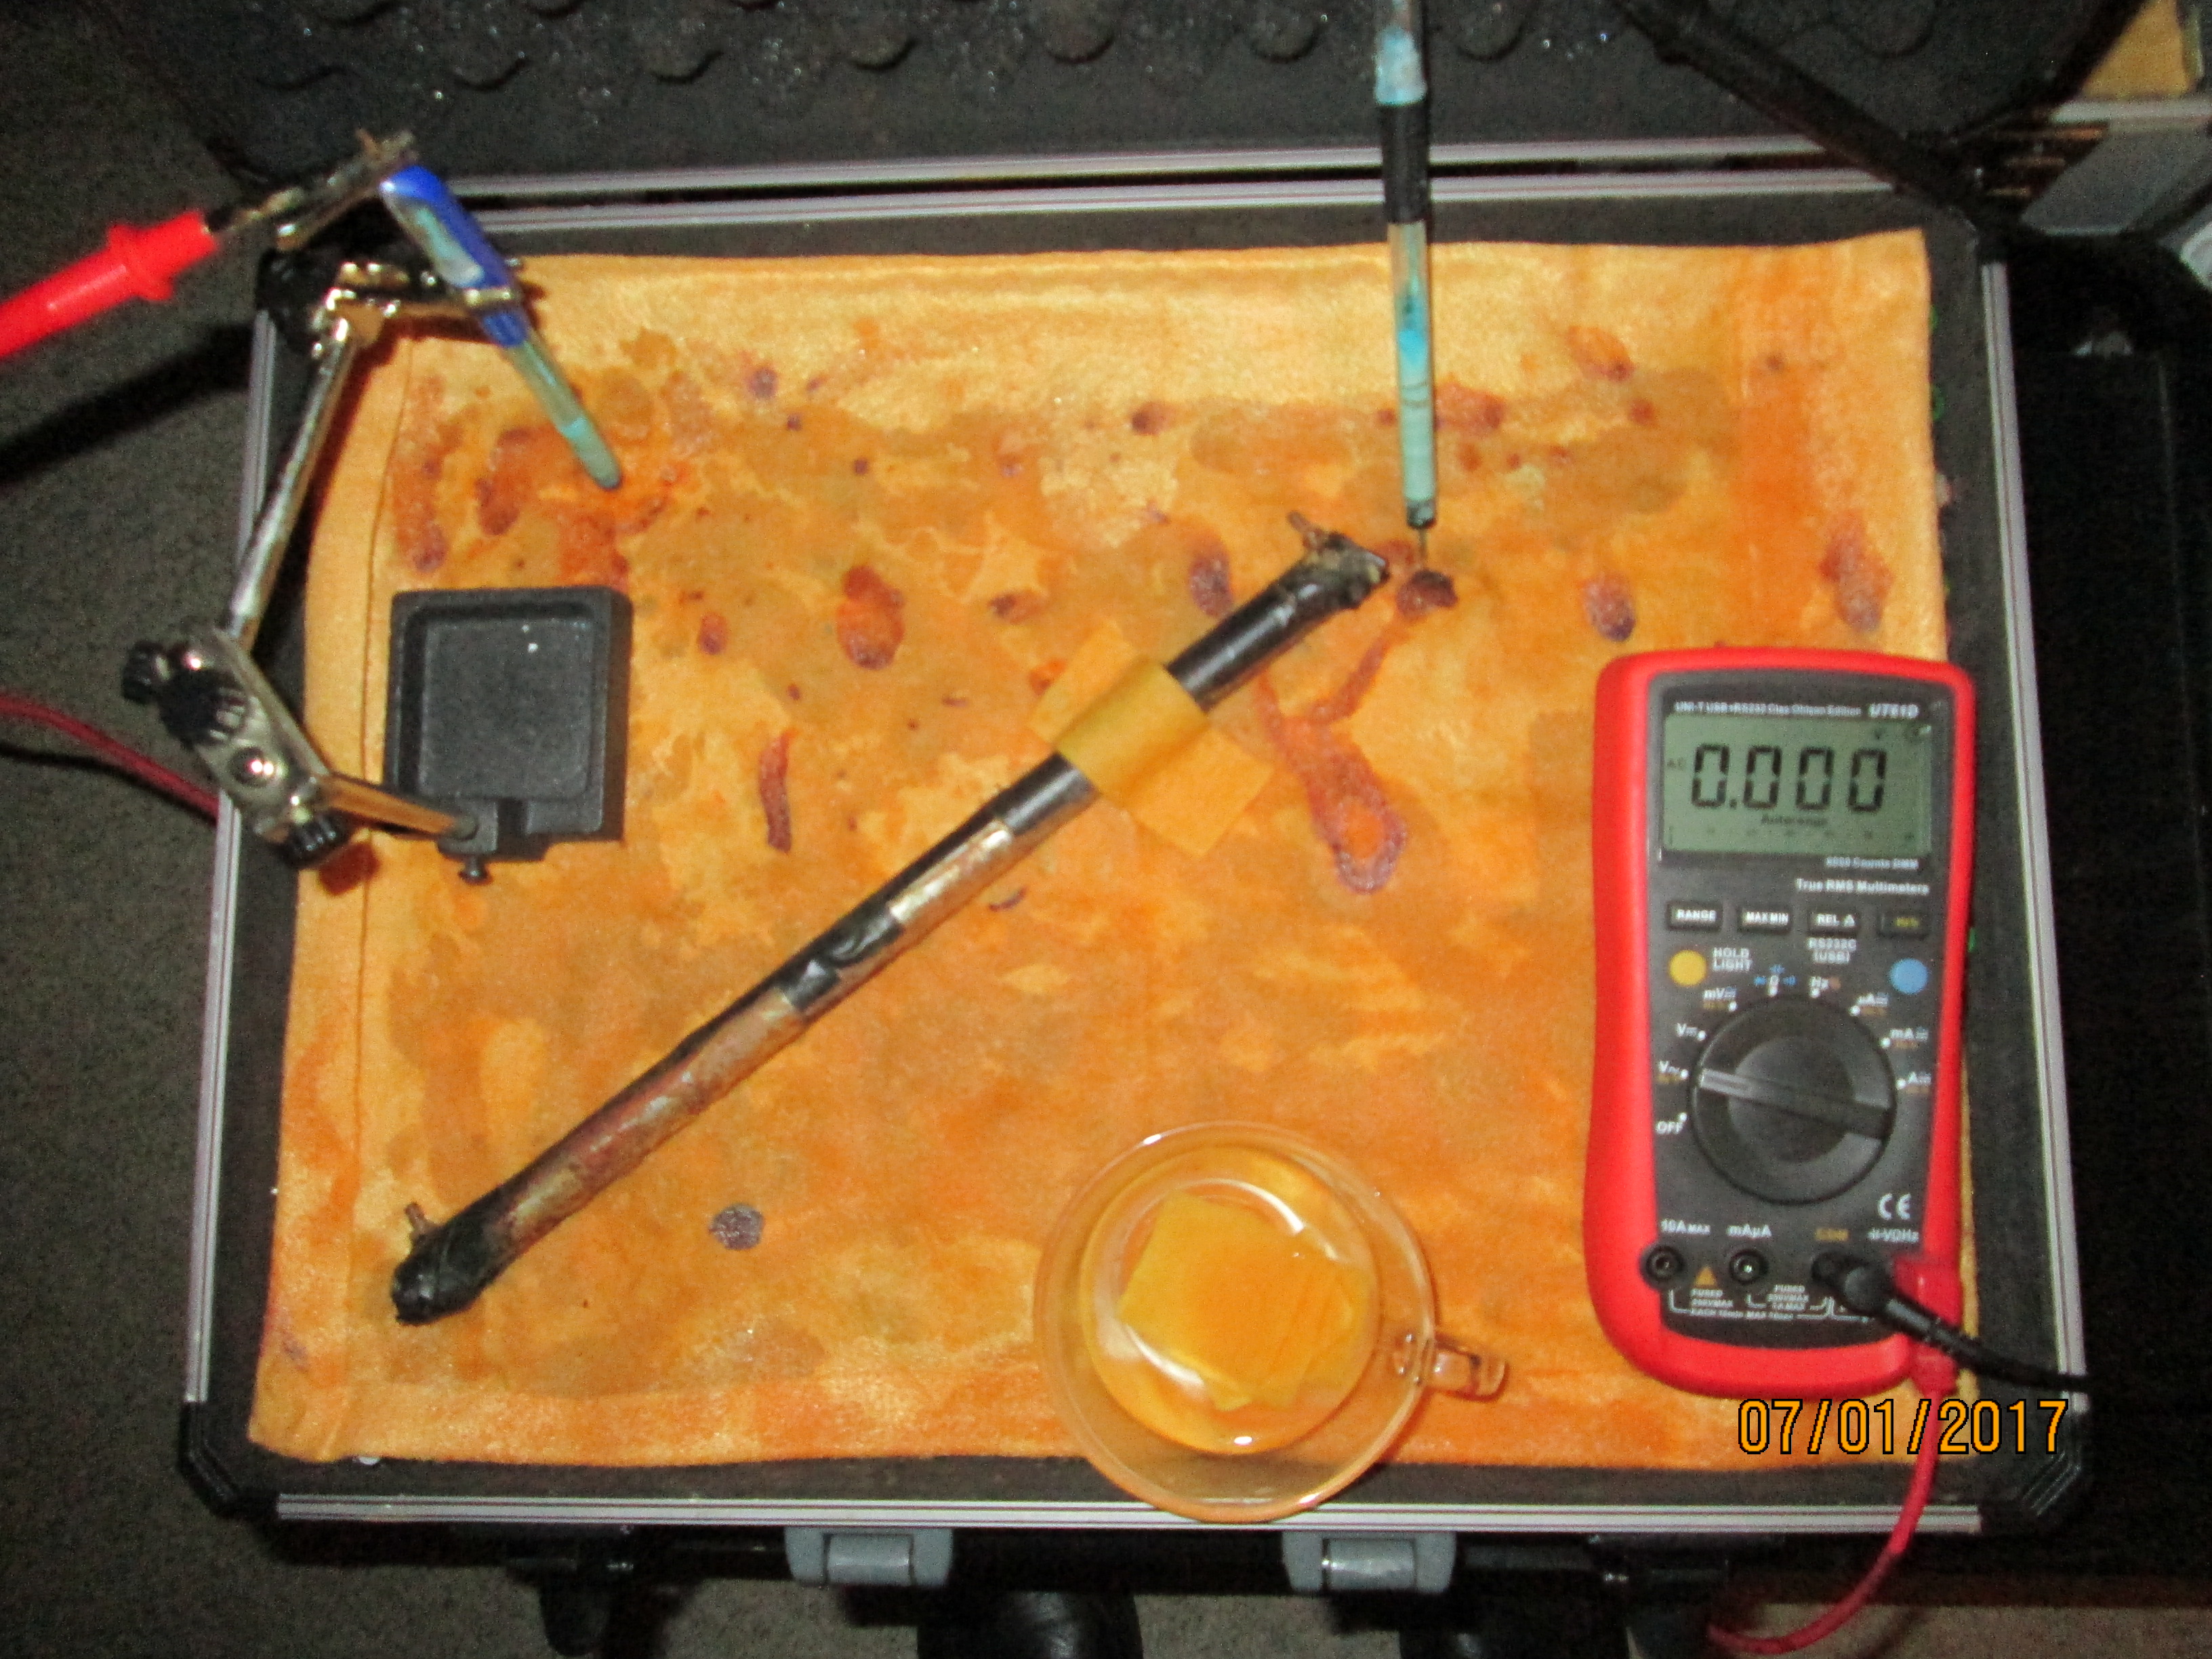
I moved the position od one of the electrodes and a new voltage appeared but decreased in a few seconds.
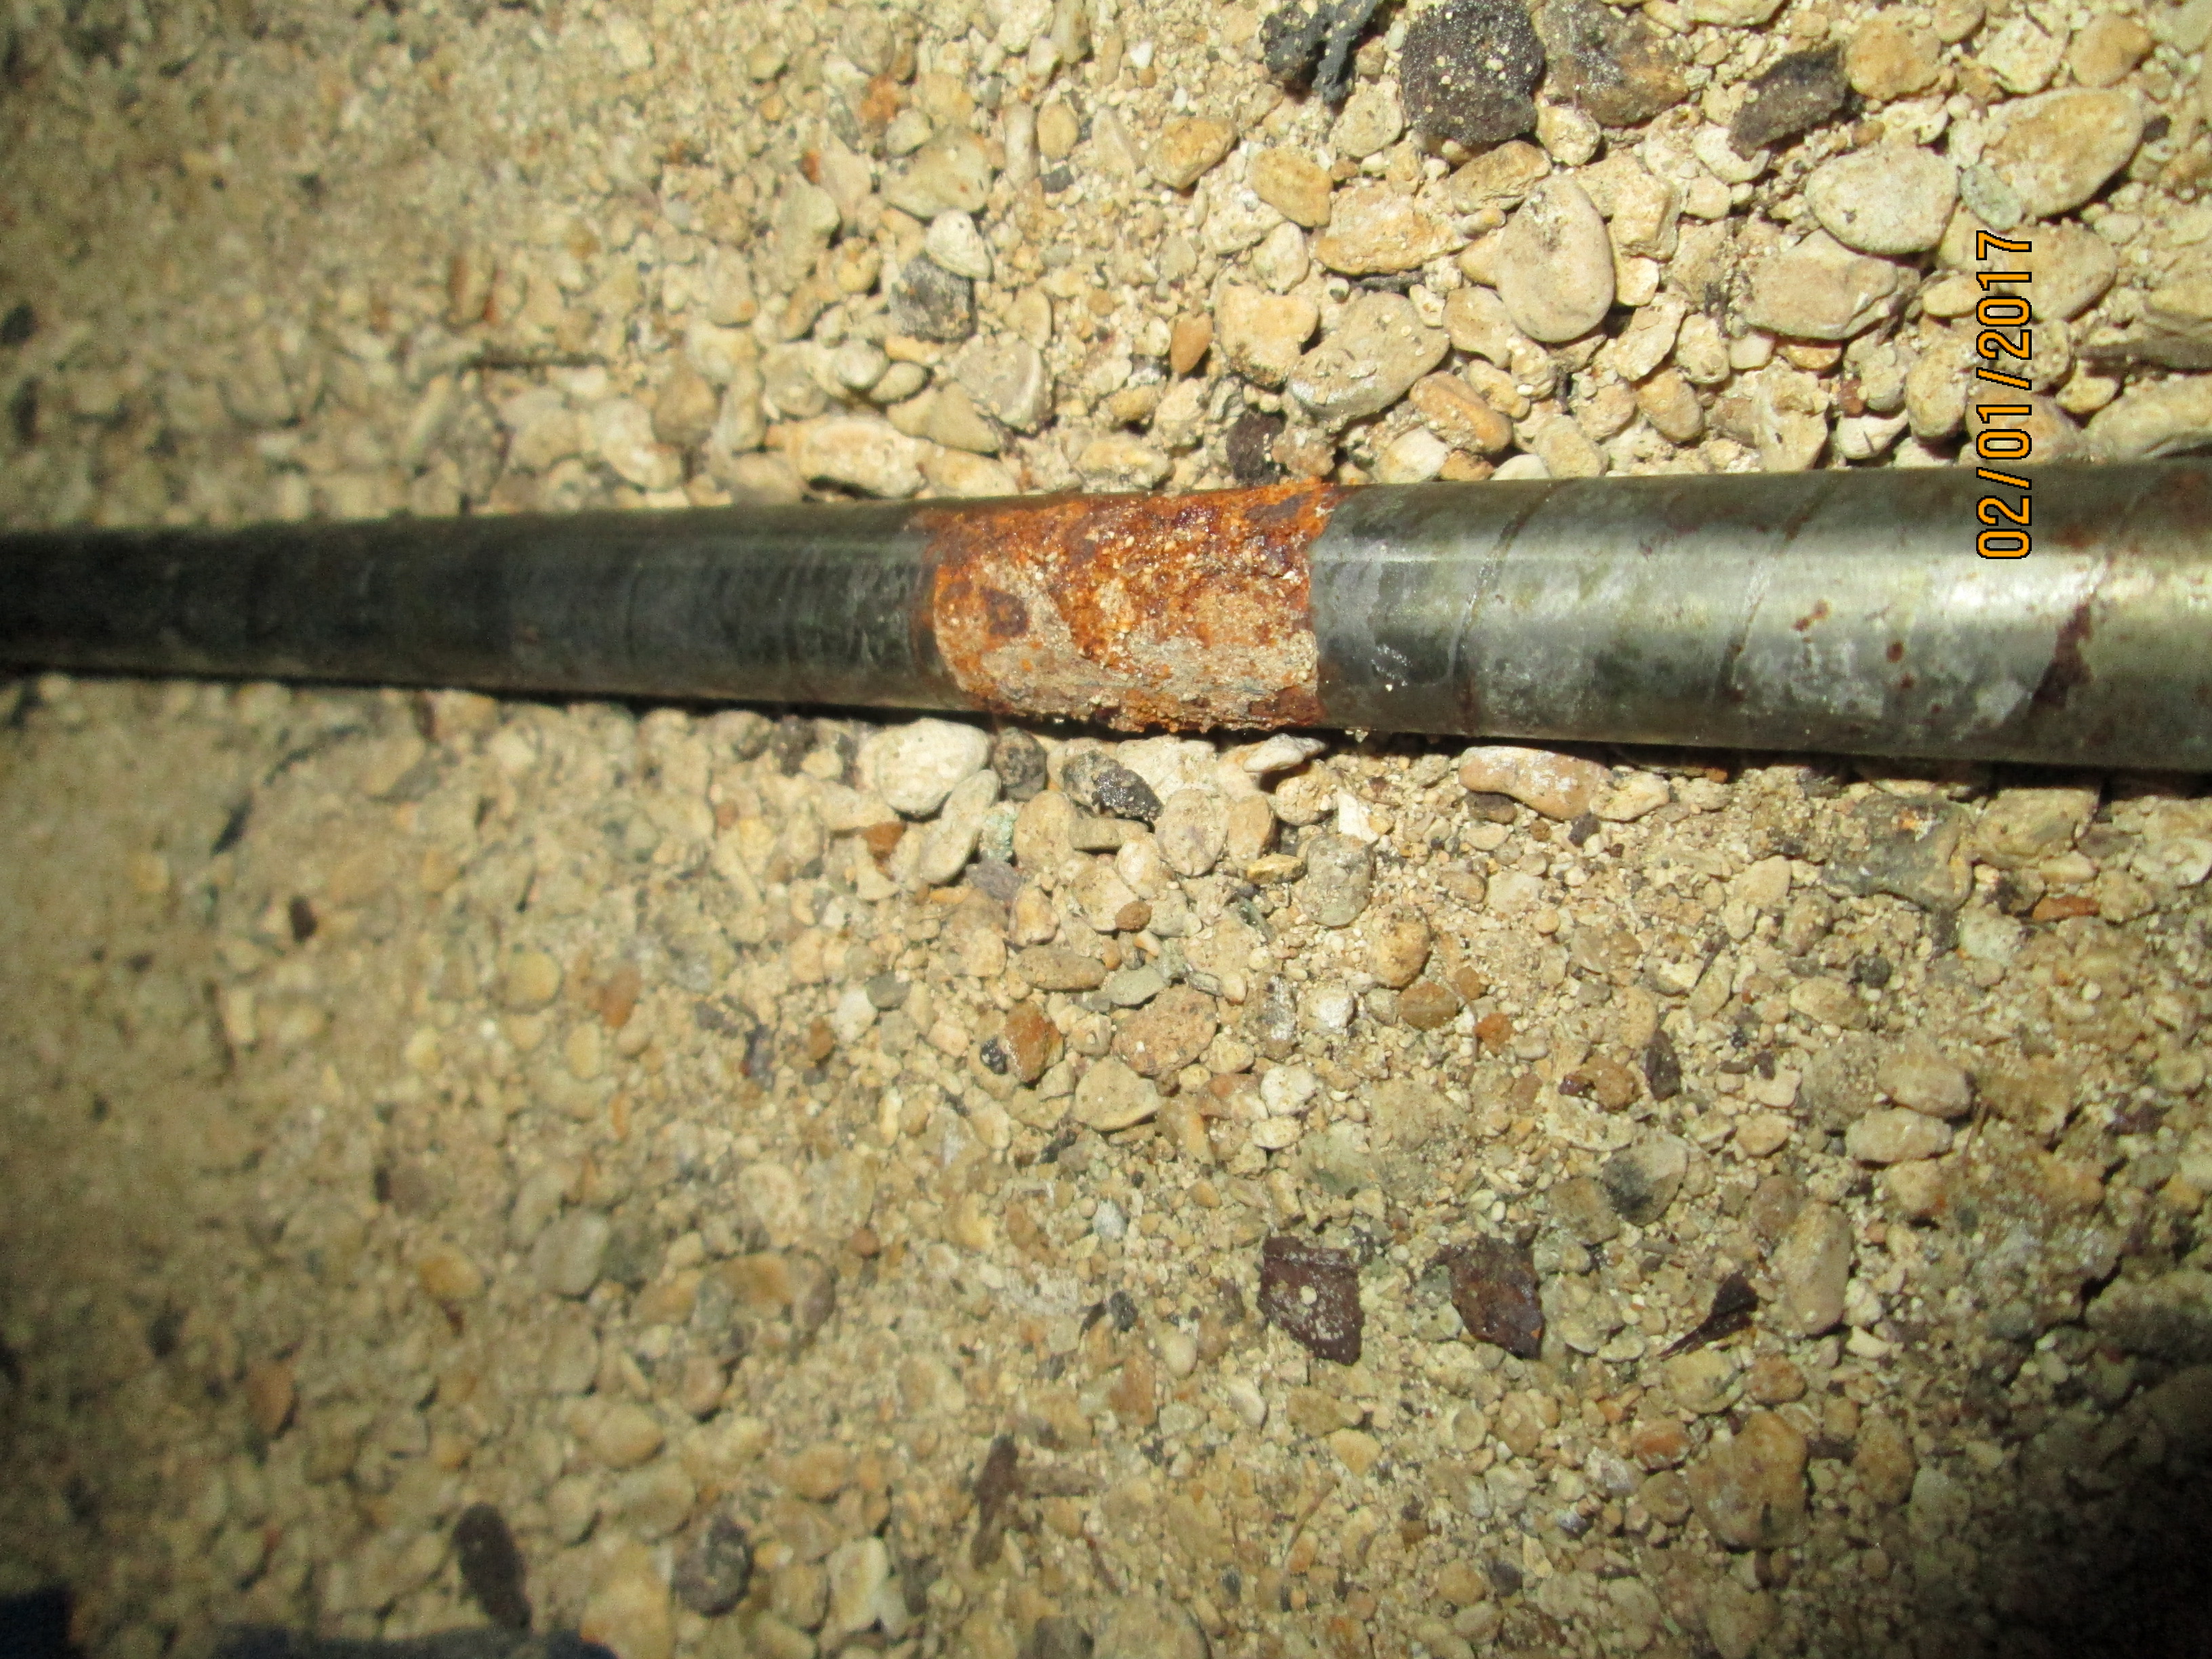
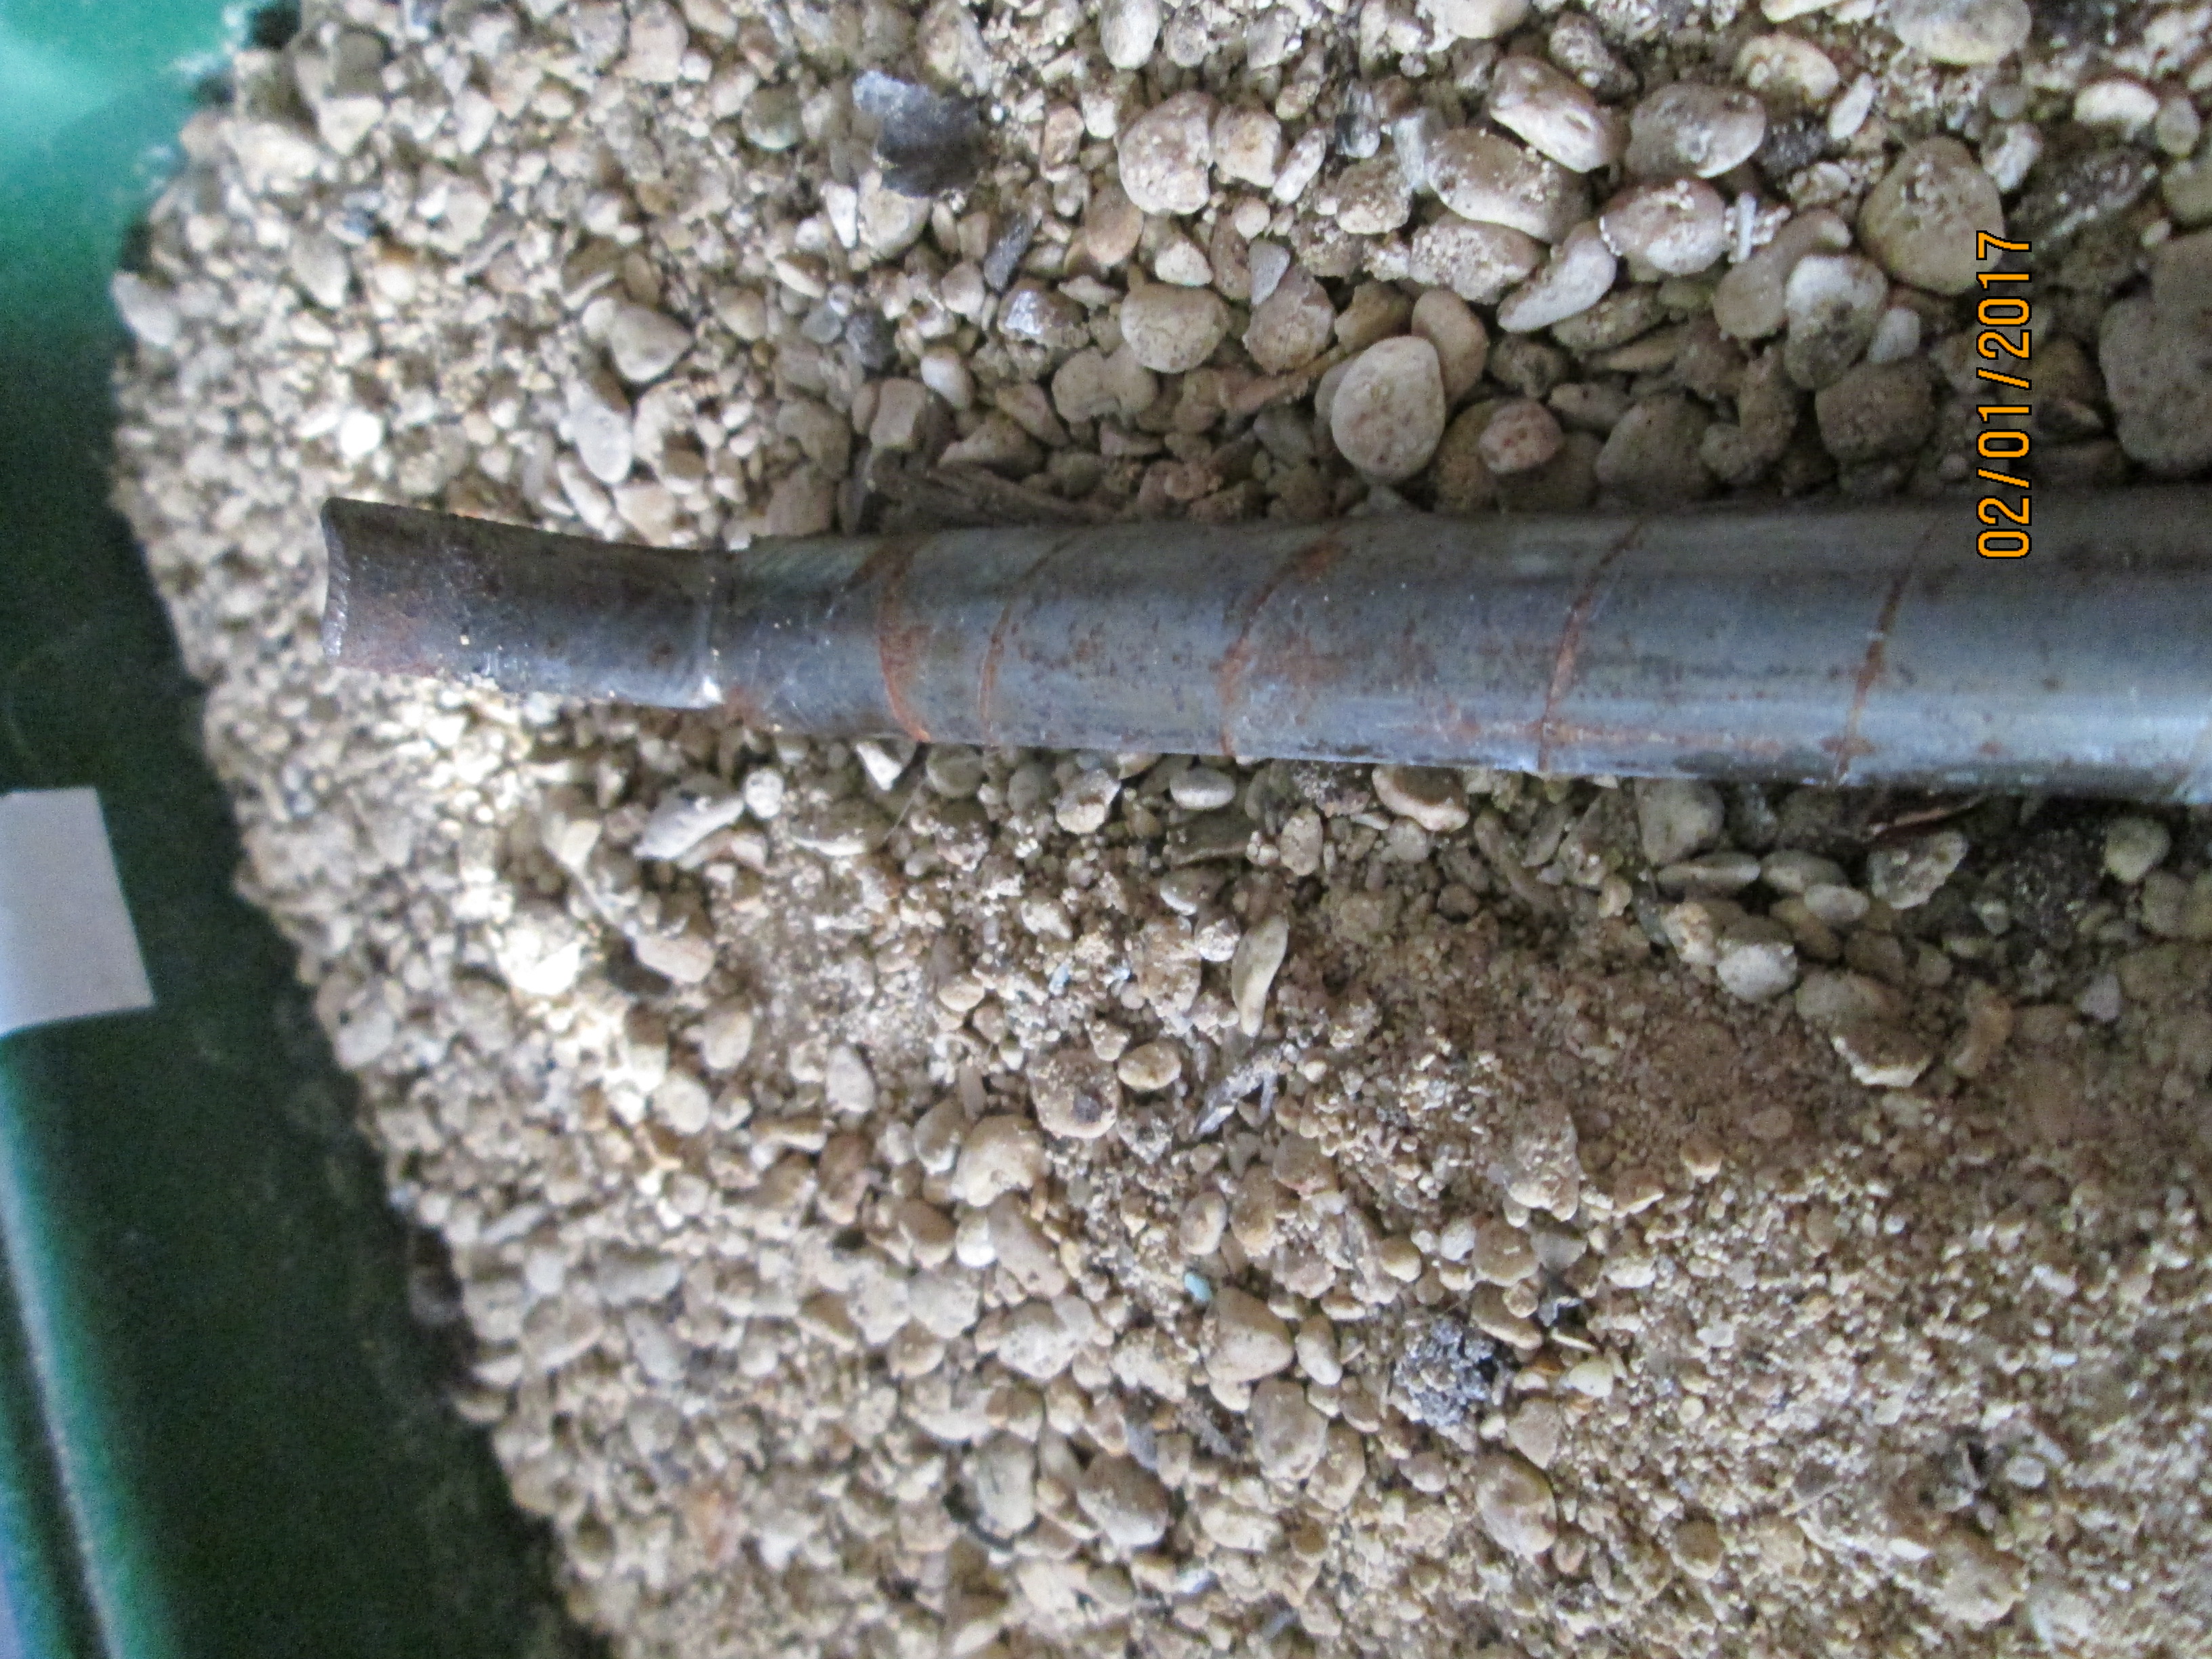
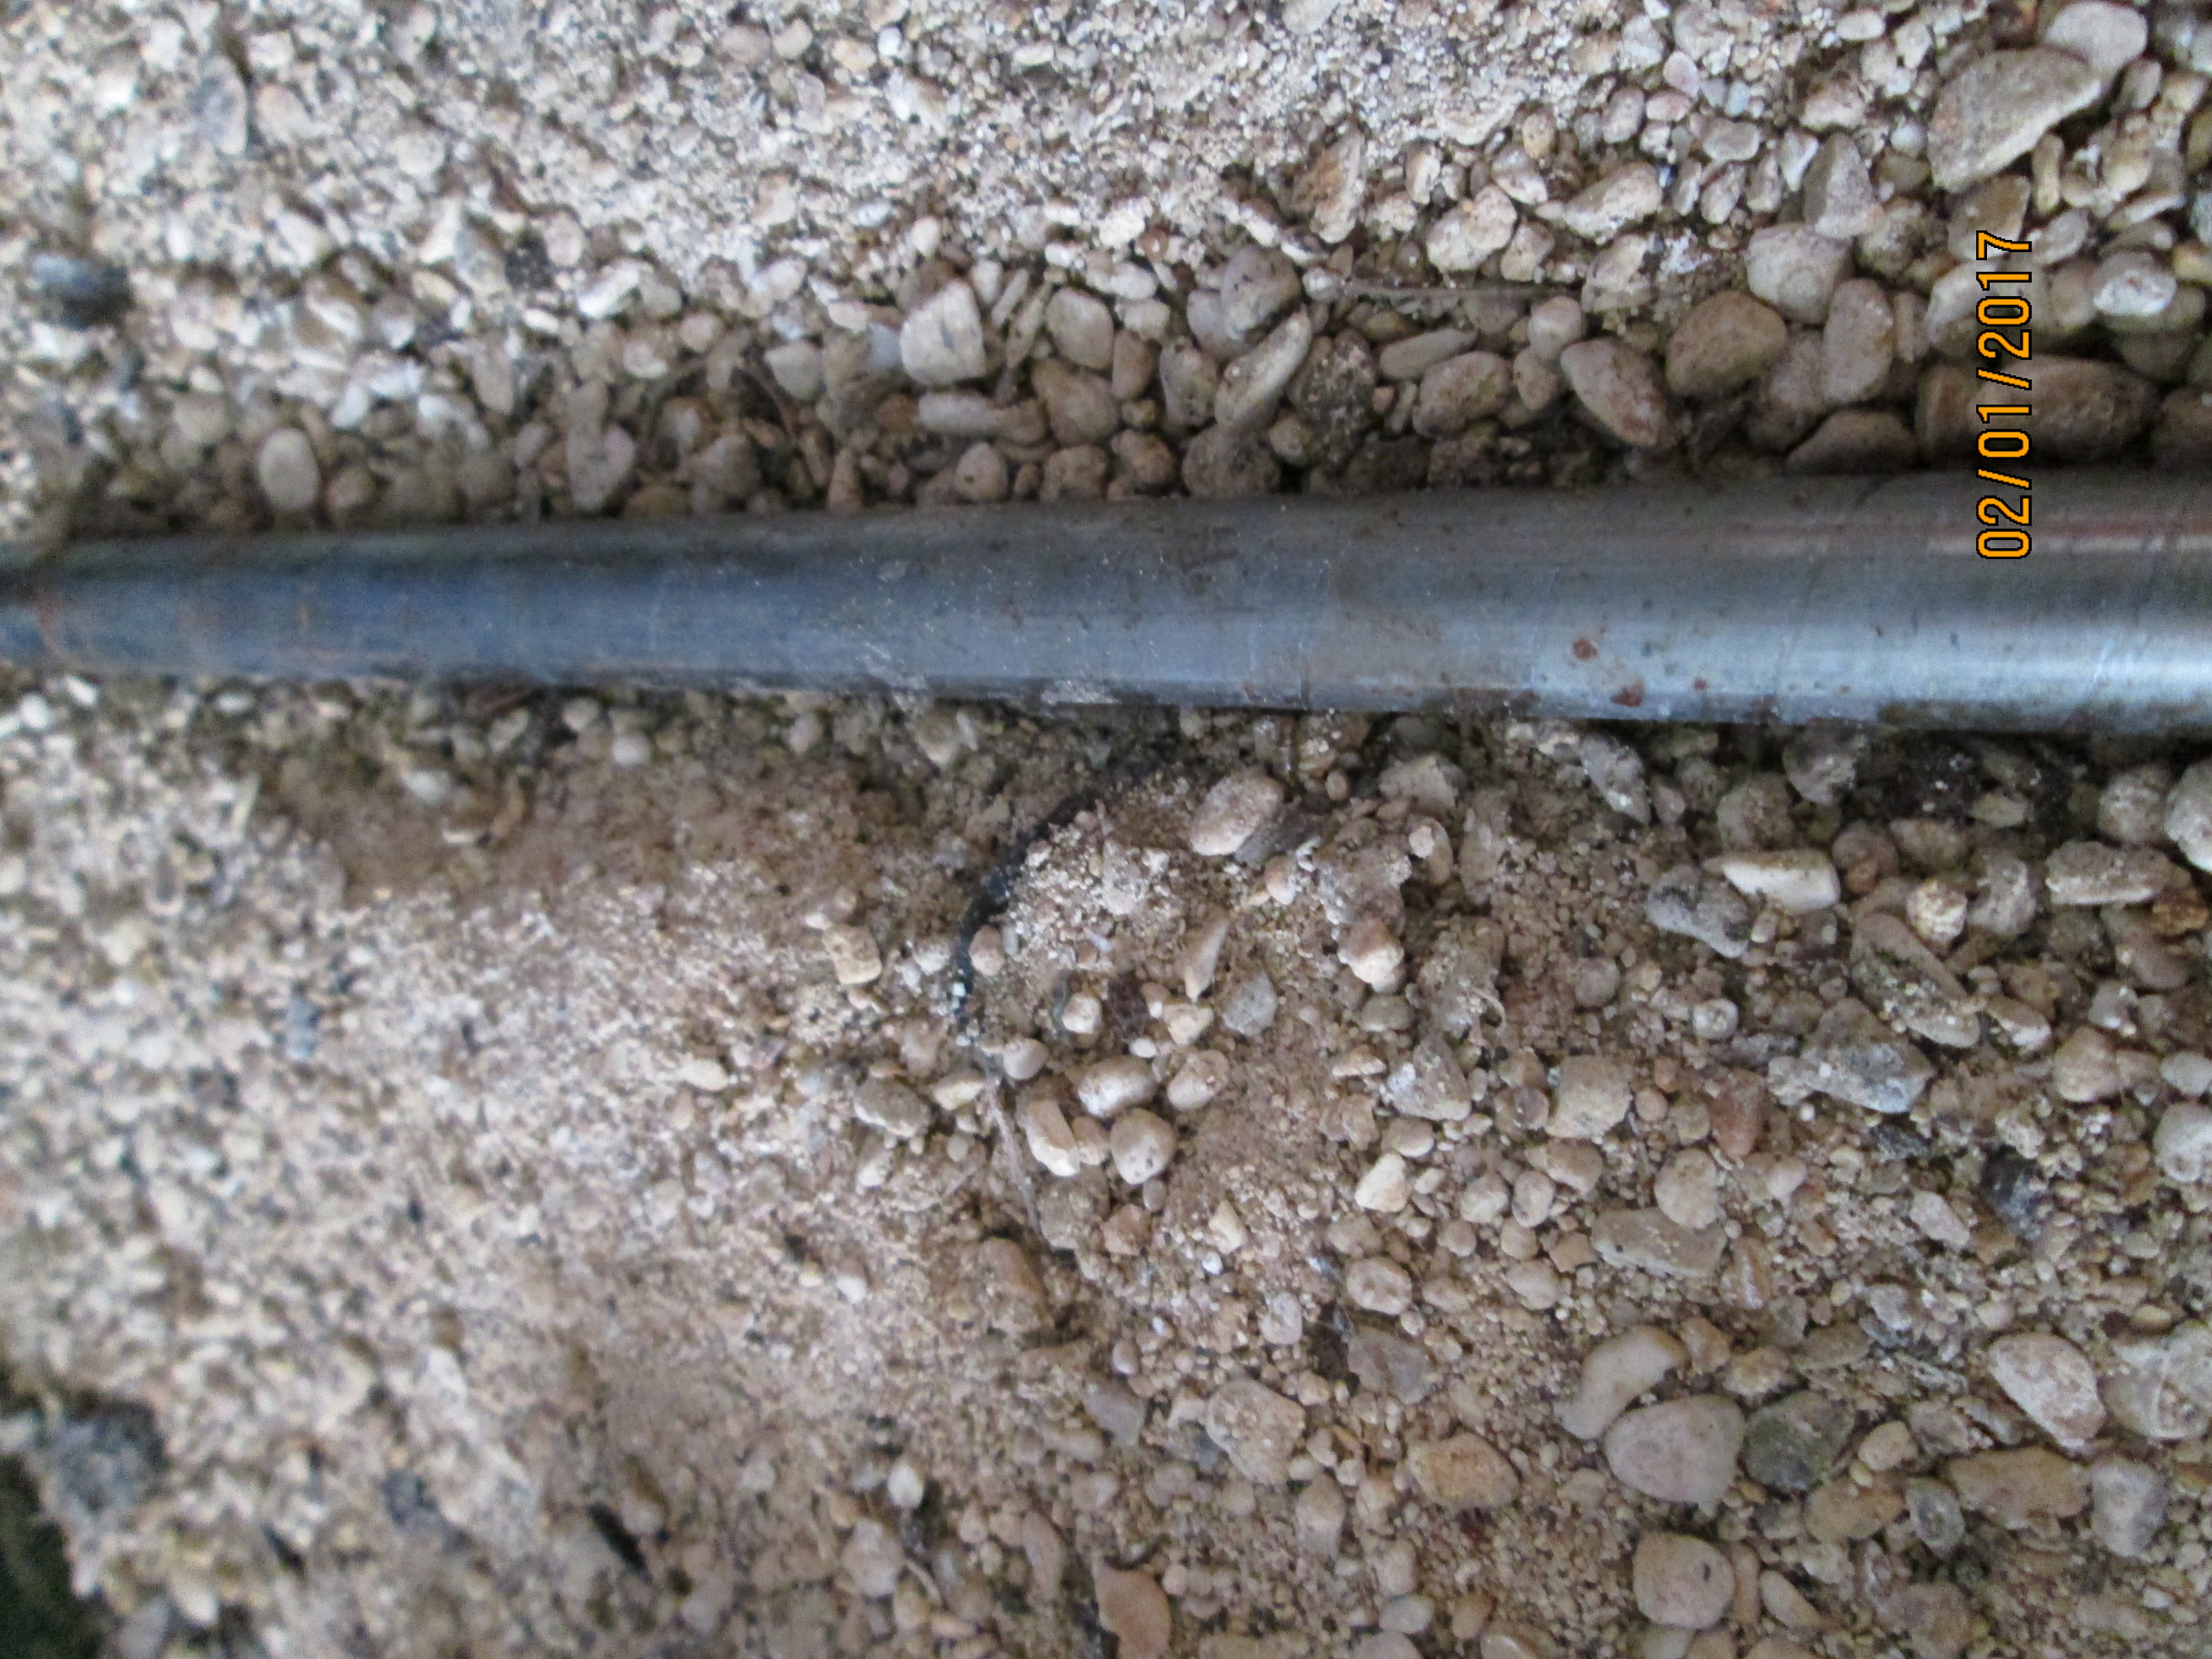
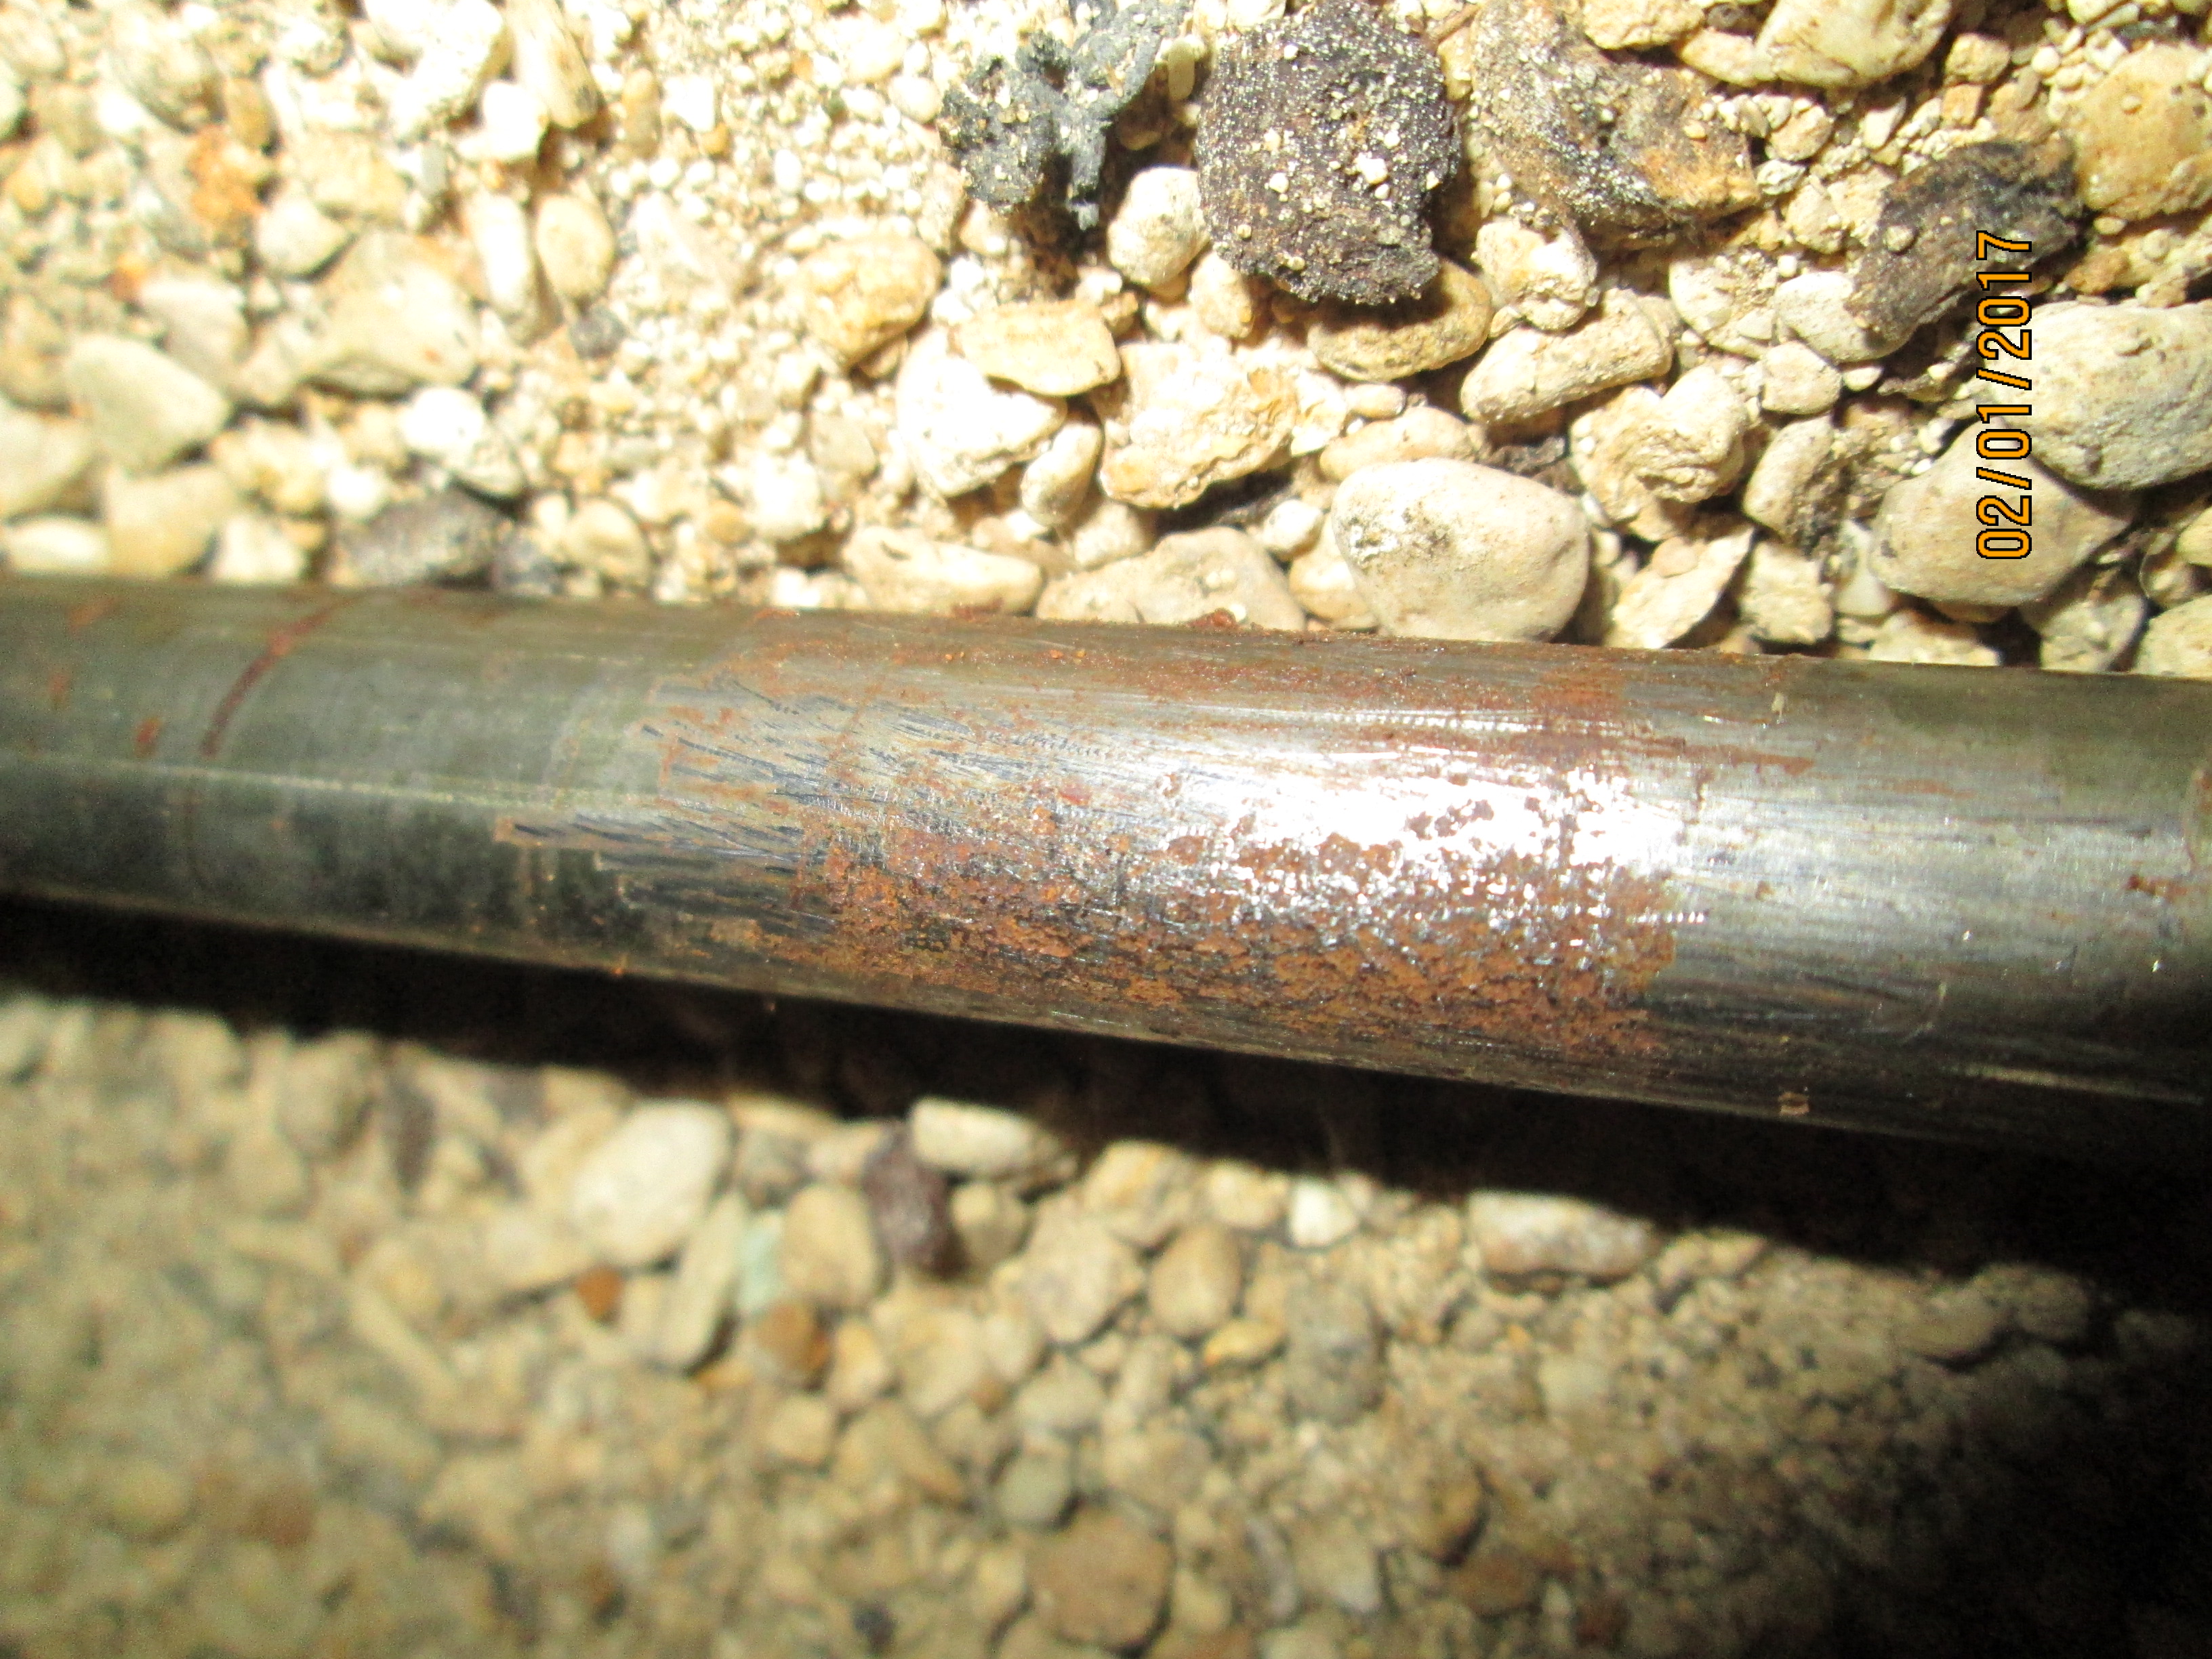
I introduced a short length of coated pipe with holidays presentand the meter readingd did not change.
I put the holidays in contact with the absorbant cloth and placed the probe as close as possible to the first holday.
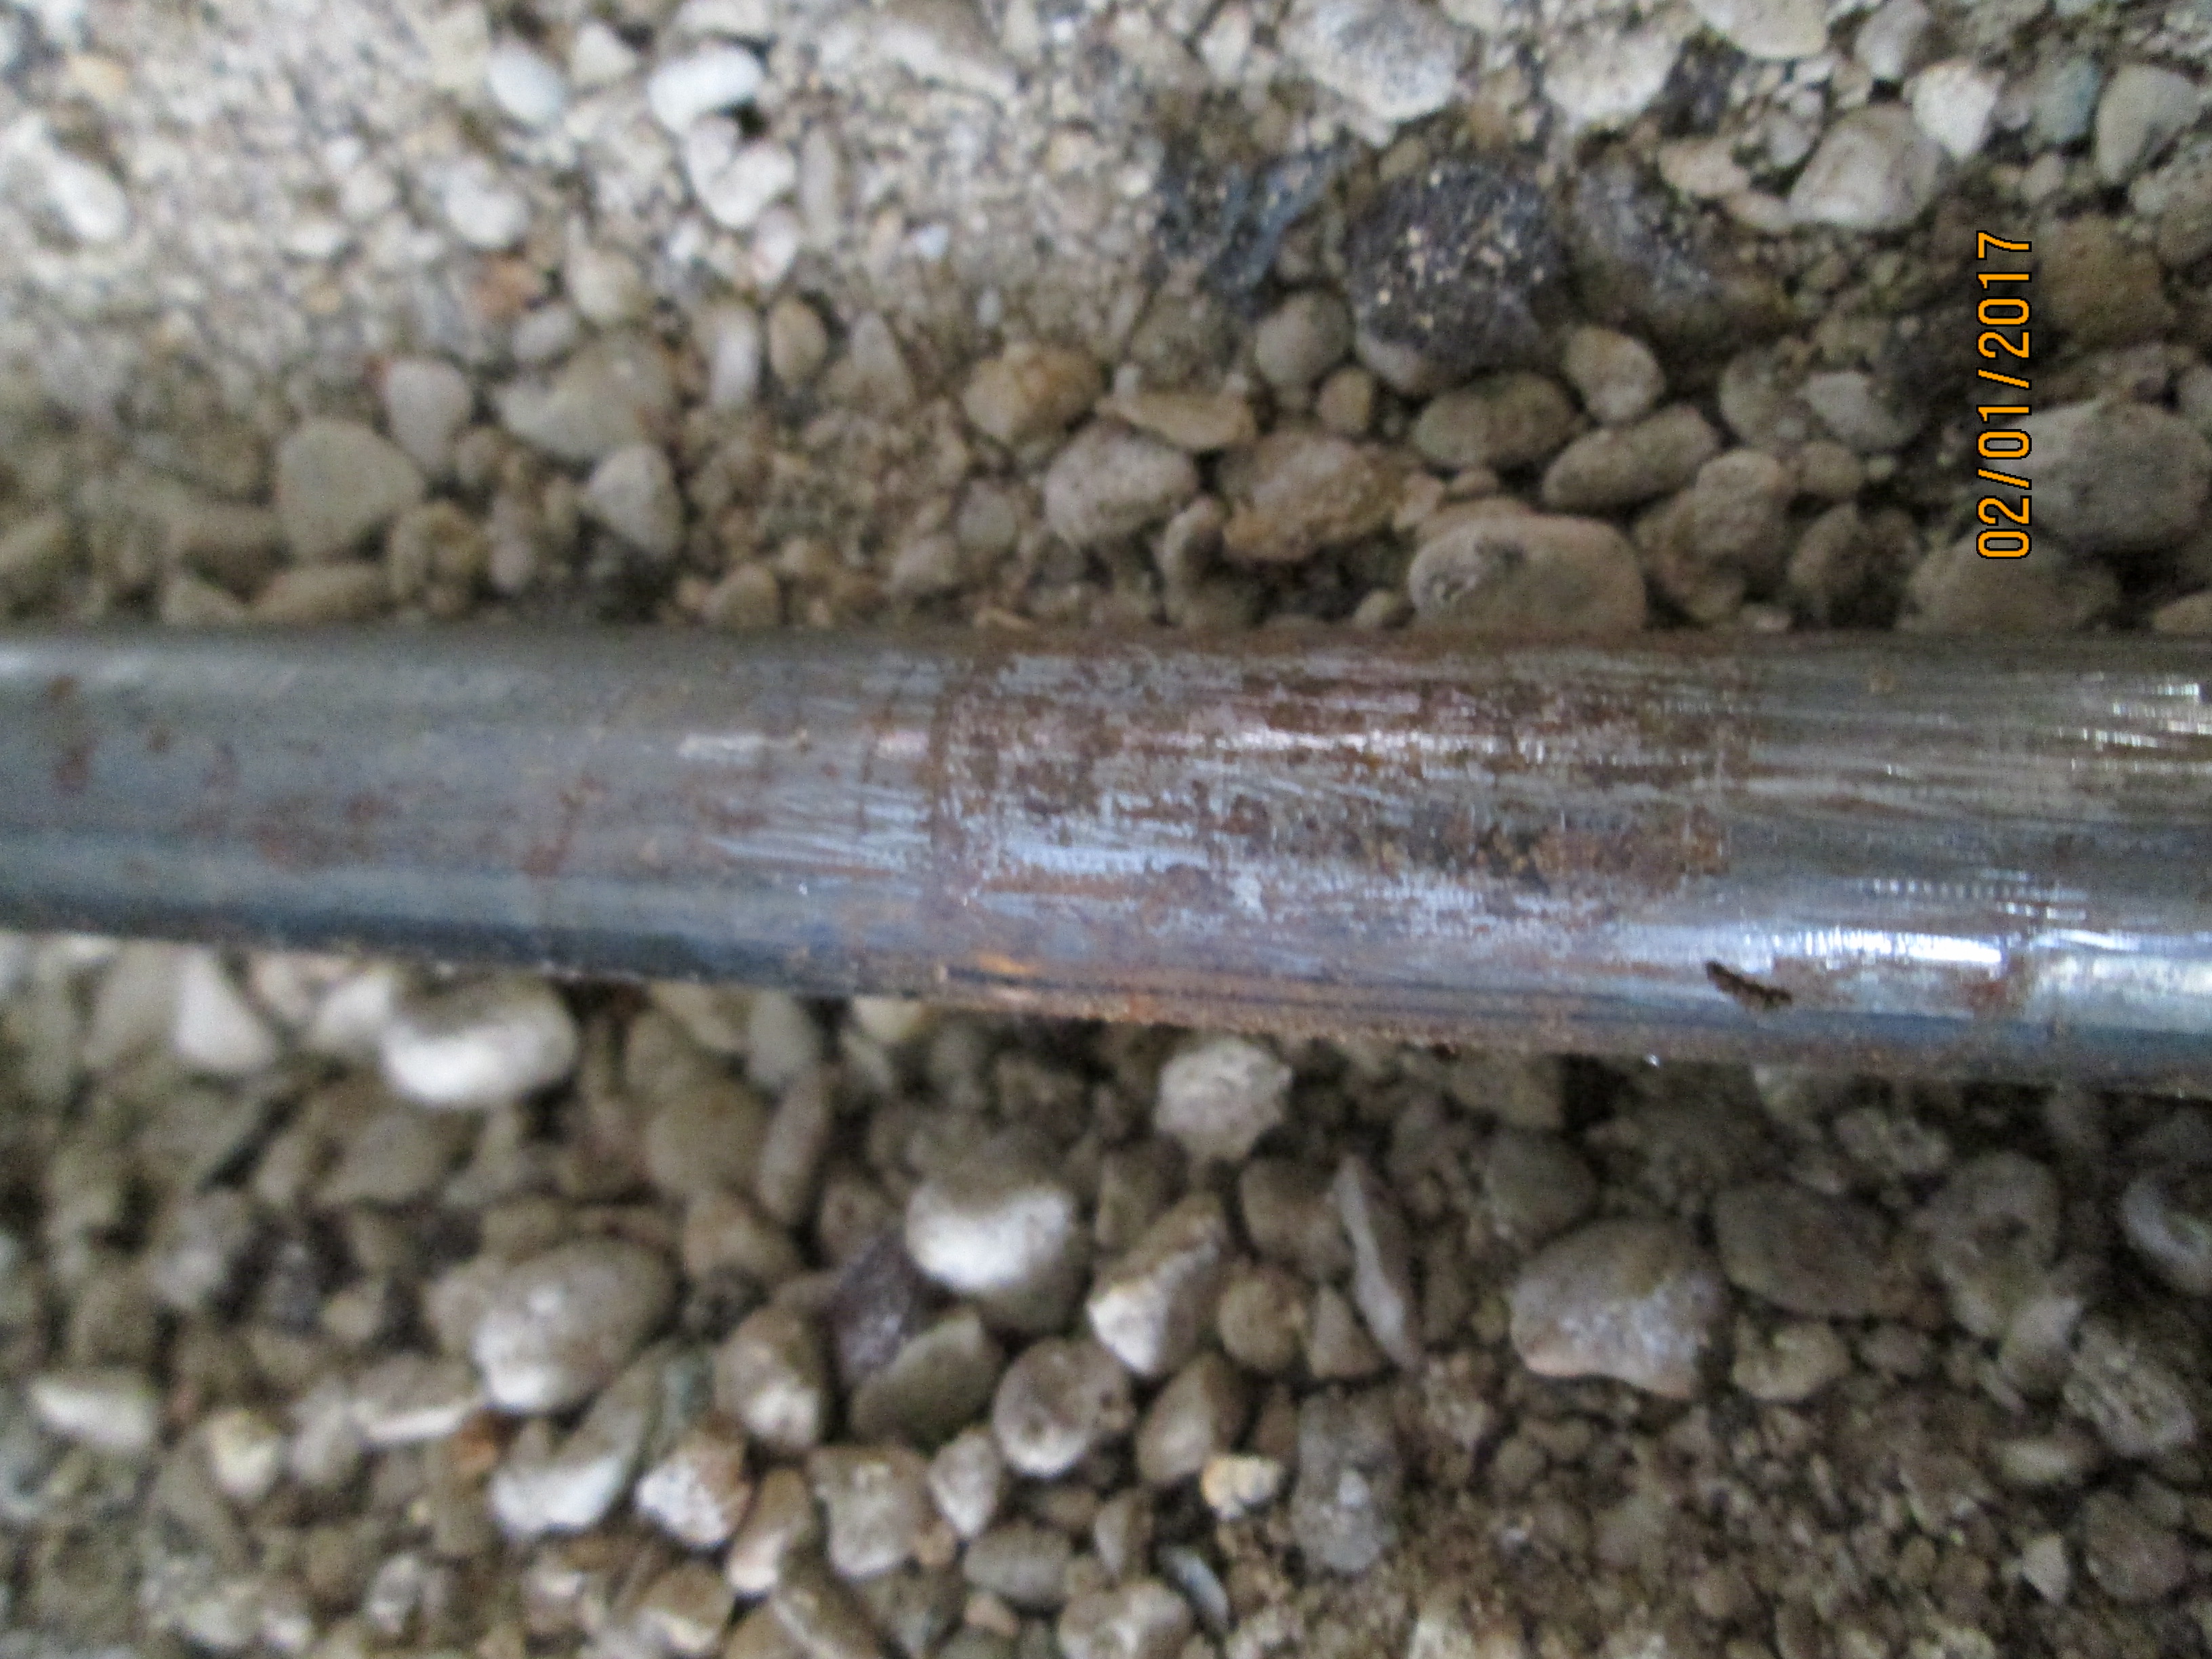
The reading reduce from an inital value to zero in a few seconds.
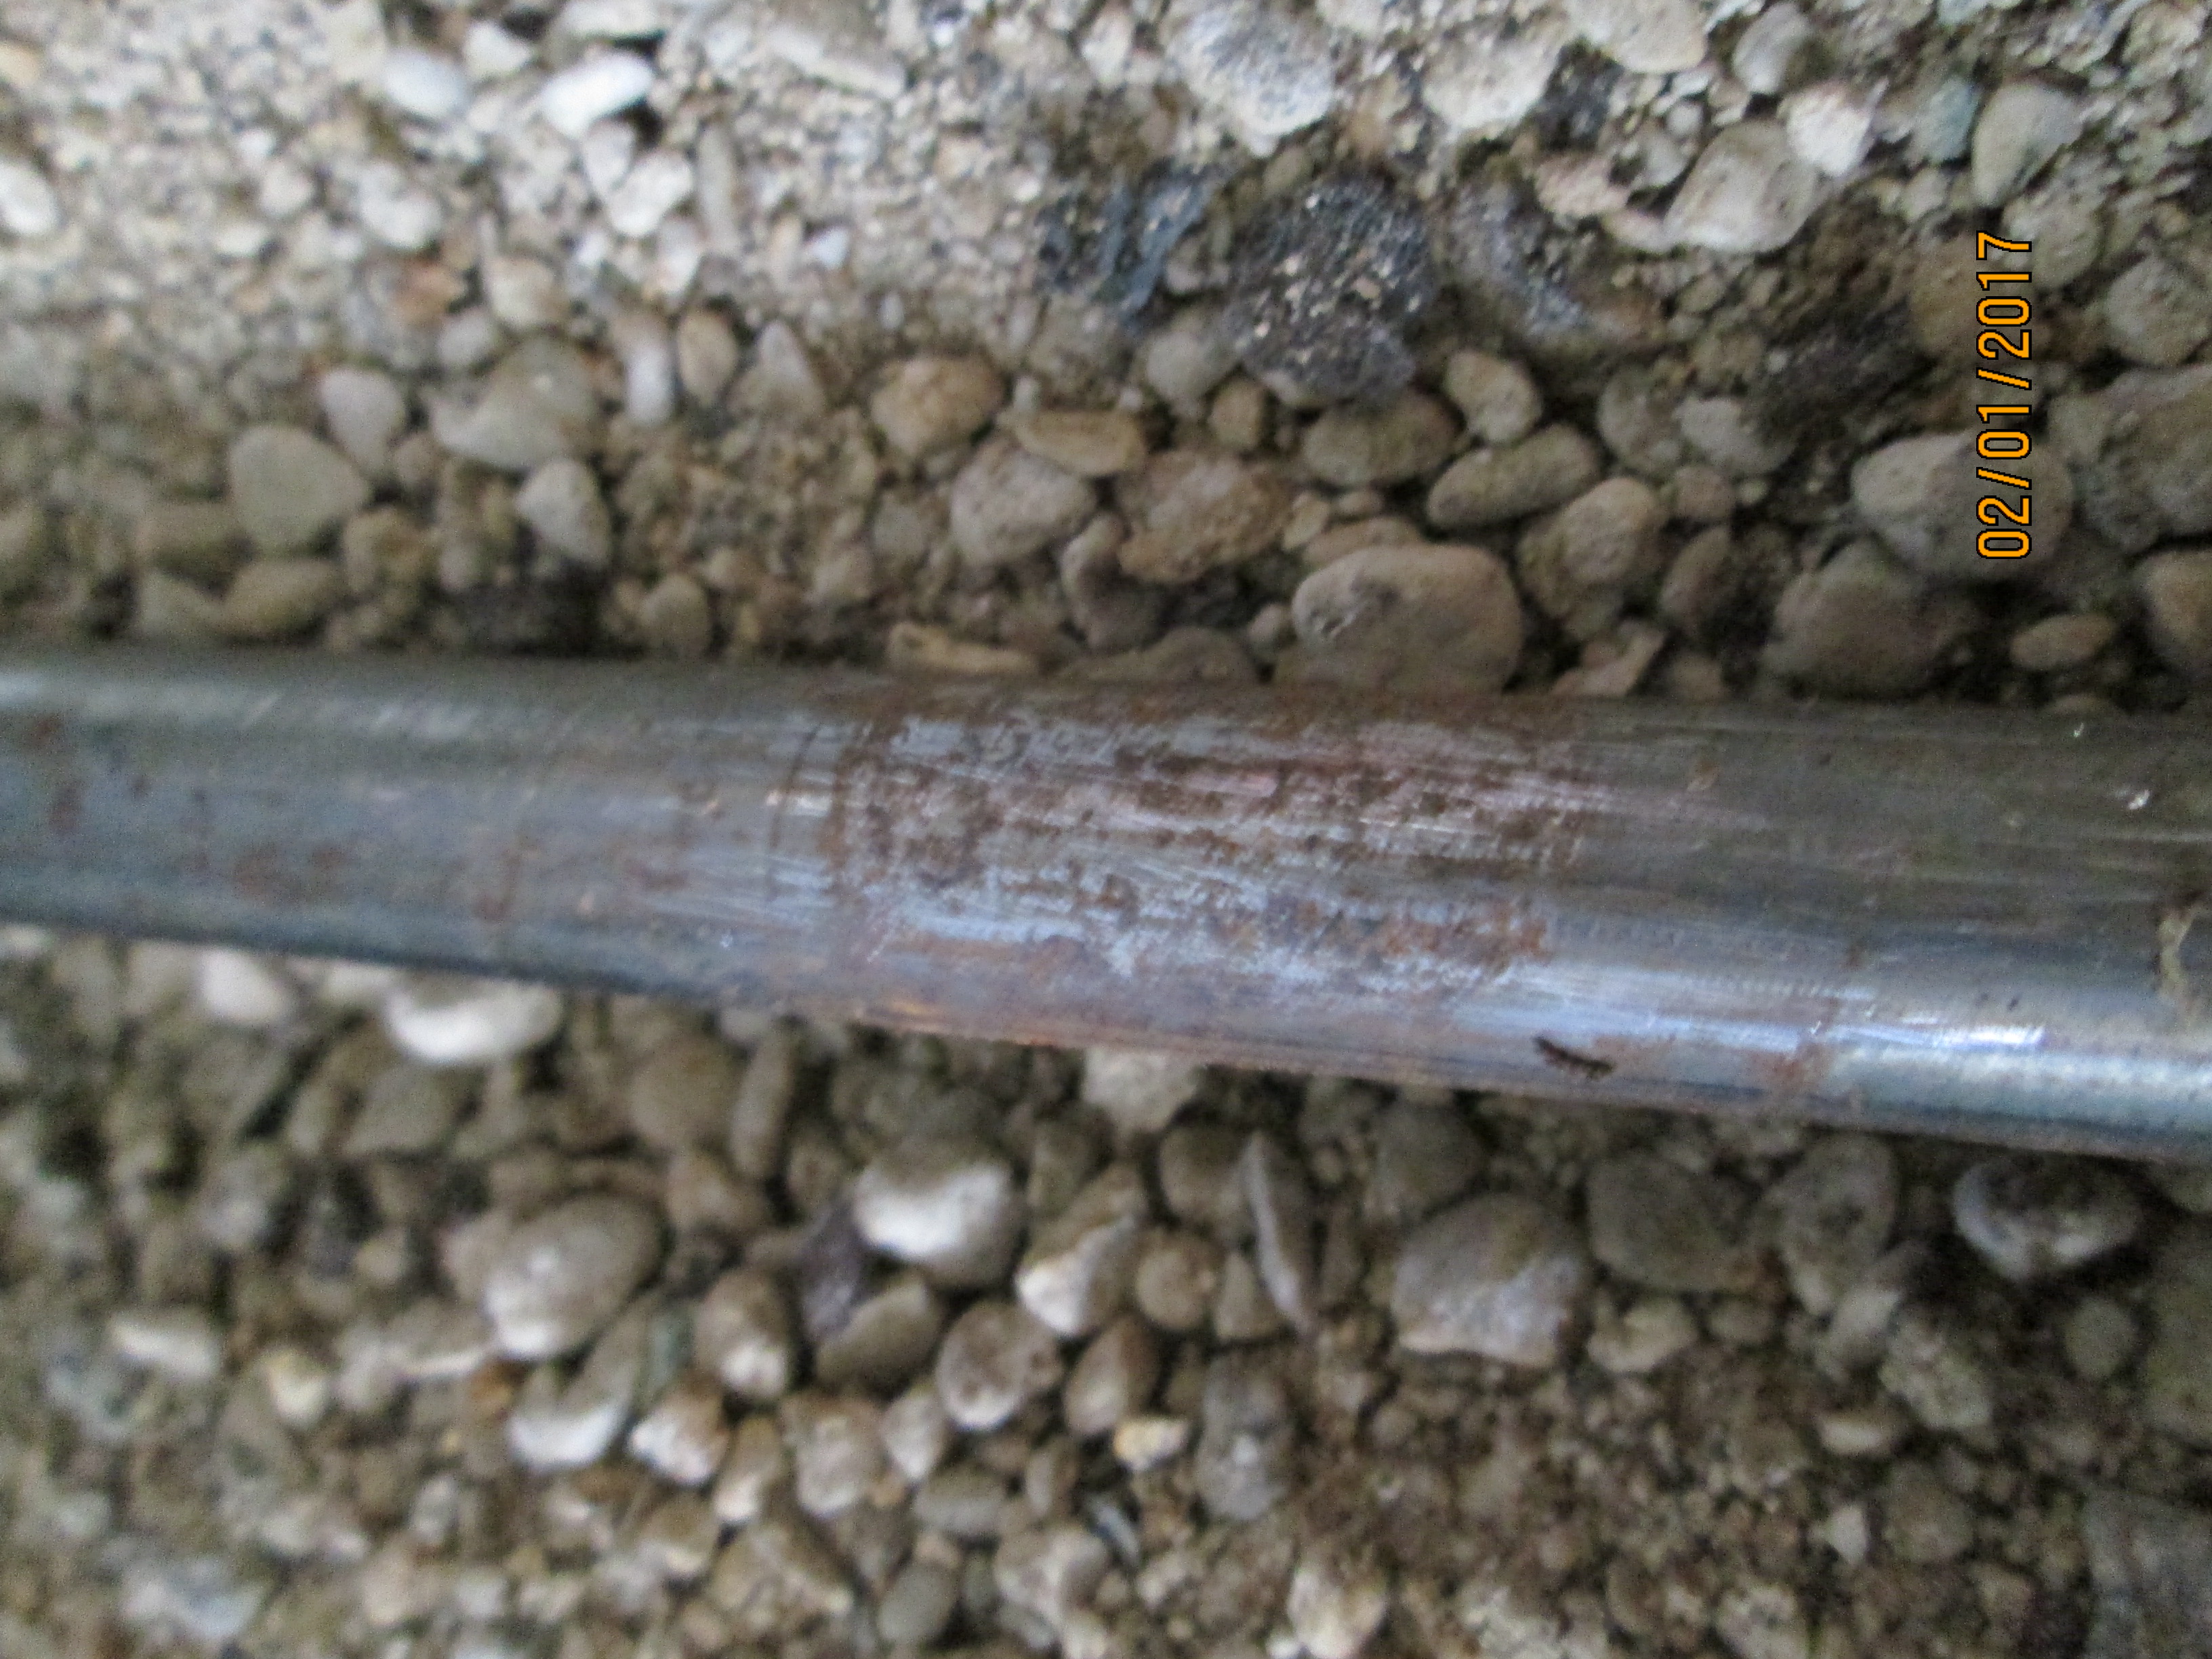
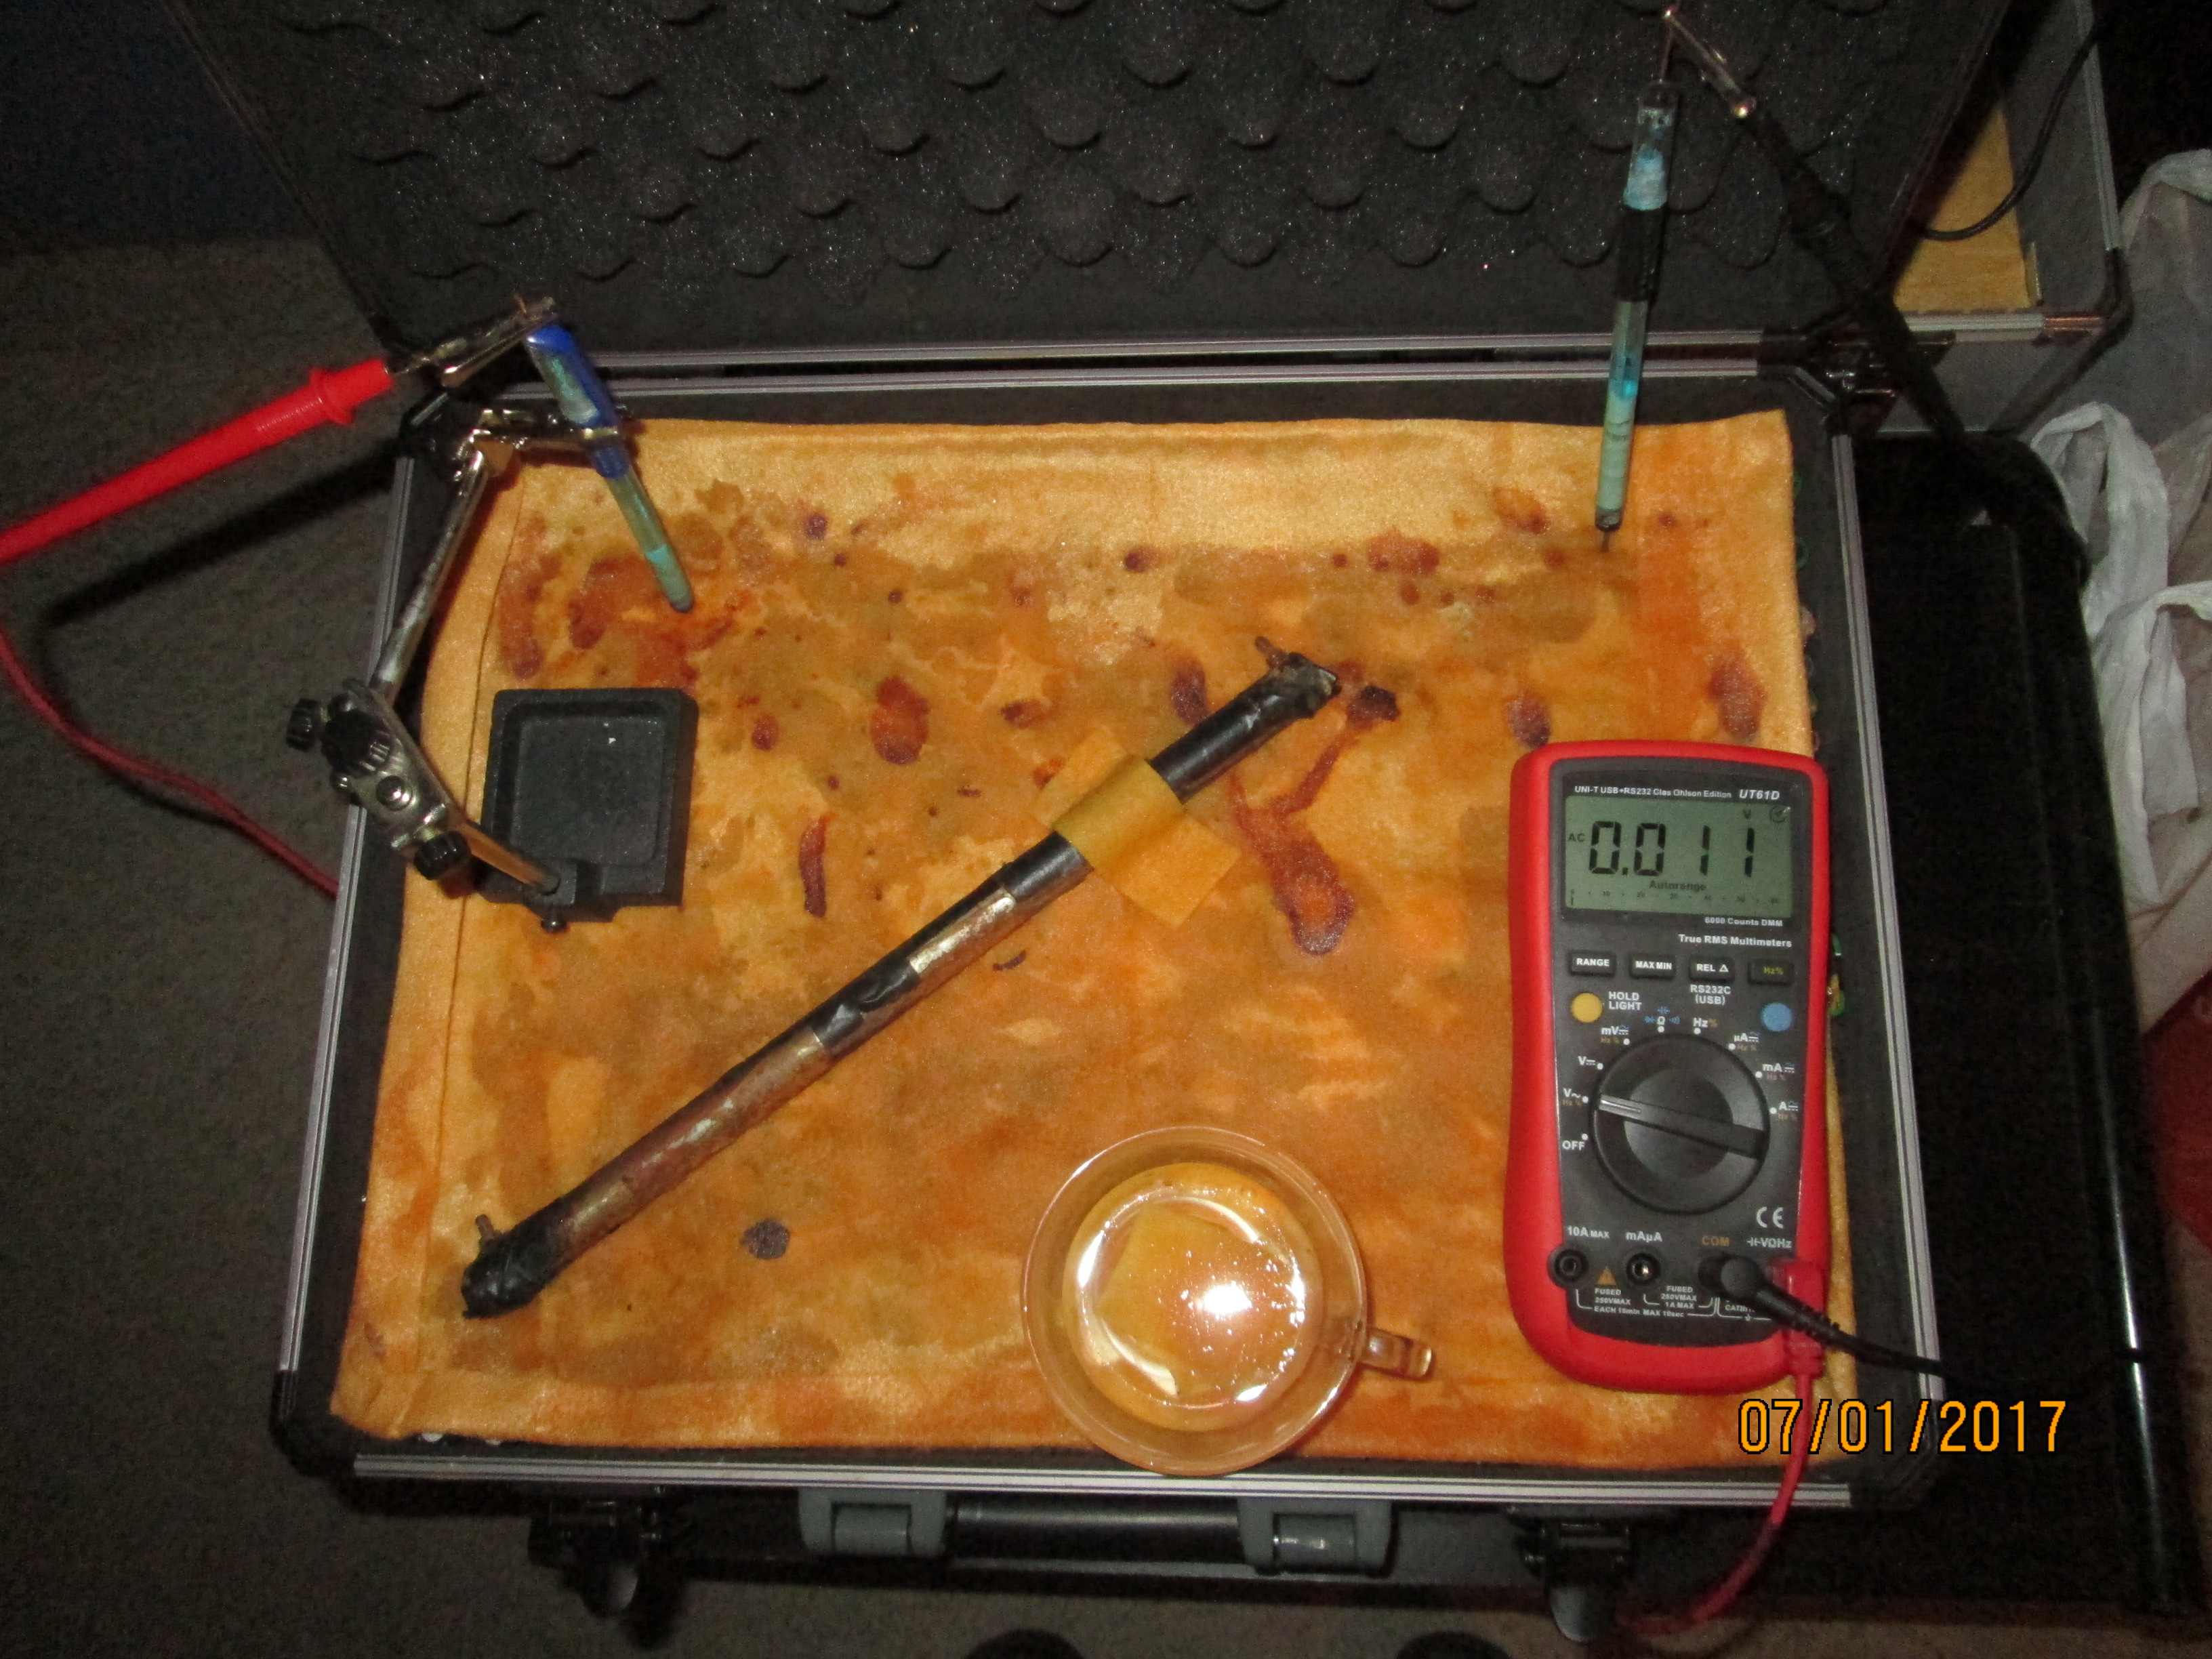
I changed the position of the roving electrode with a similar result.
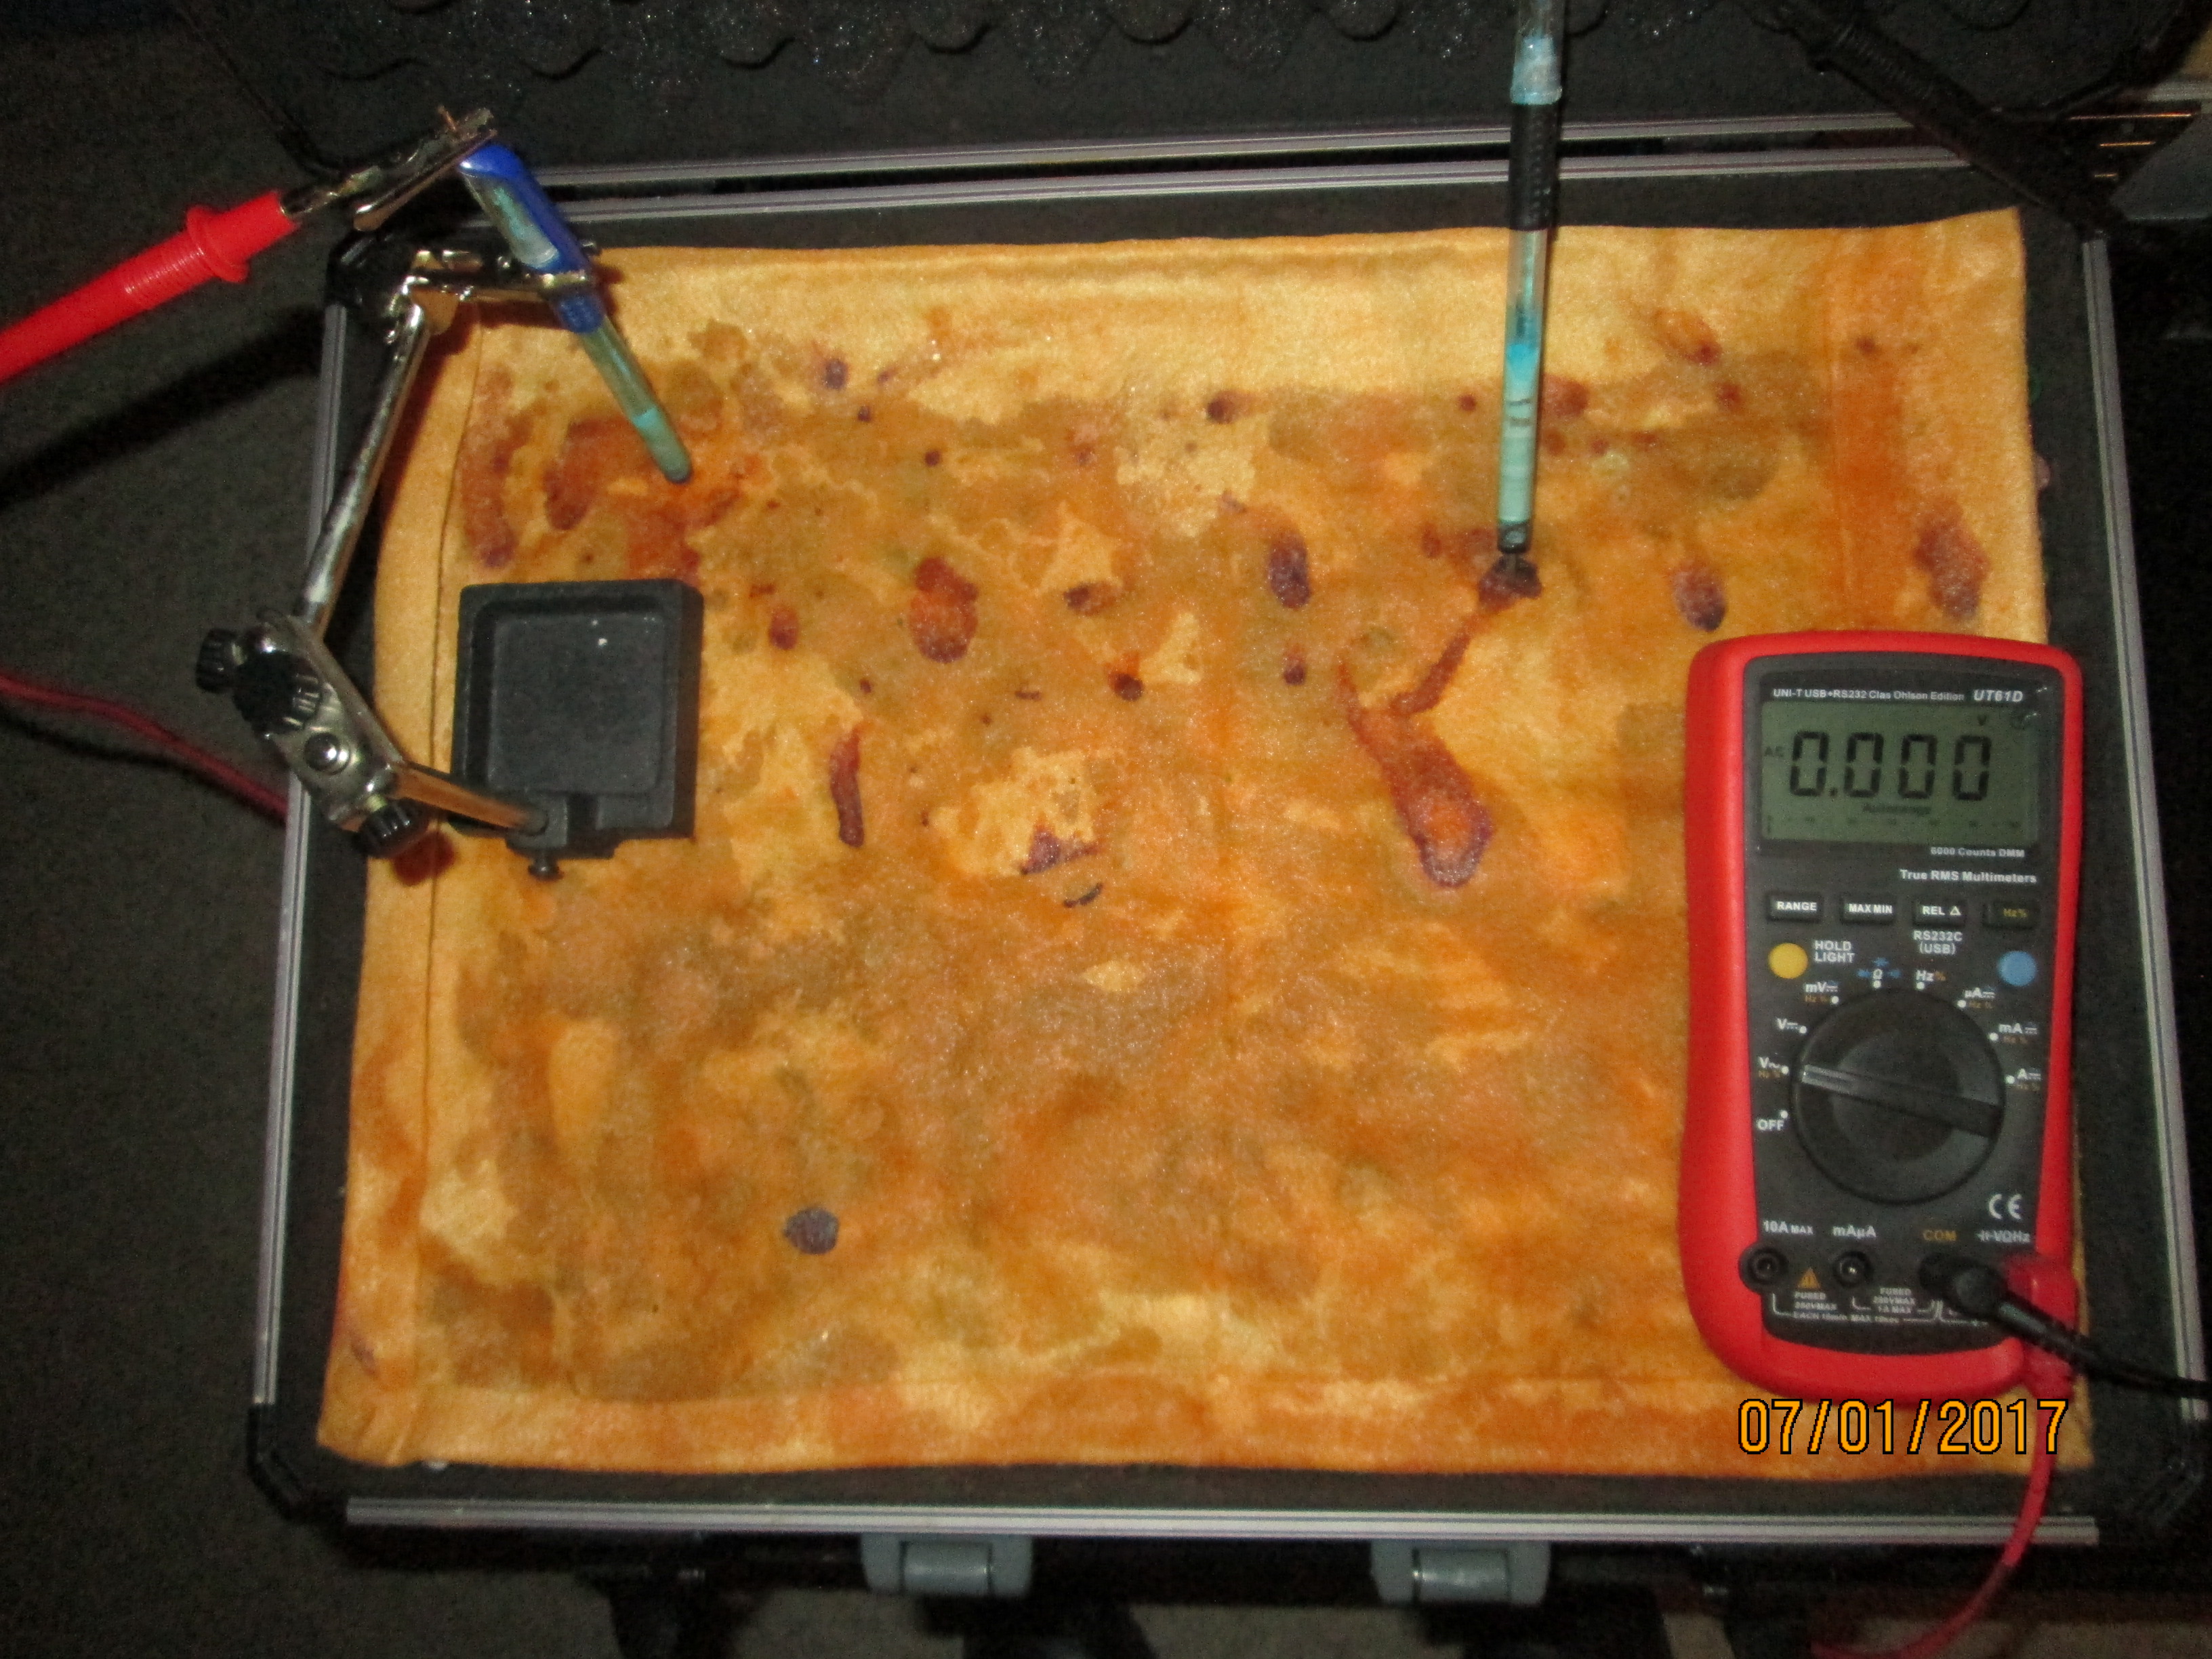
I then introduced new conditions as senn in the following pictures with the results shown on the meter.
If any of these assumptions are believed to be incorrect then I will examine them and publish the challenge with the solution. These will always be supported with pictures and data obtained during physical examination of equations and scientific notation accepted as the axiom of the particular point.
I use this language to say that we can check on ALL science and if it does not work we will show that it does not work. If it works we will have created a way that we can validate it in real life and fact..
Link to web page of CIPS Surveys