Two day training seminar
Period 3
The issue
The key to all this activity was the field use of the half-cell as a reference electrode. Very early in my field work, I found that I could achieve any reading I wanted, without altering the connections in the measuring circuit or adjusting the CP output.
I also found that the reading is dependant on the exact position of the electrode, and that a slight movement can result in massive changes in the readings.
I was not alone in realising that this raised doubts about the validity of pipe-to-soil potentials, taken in the traditional way.
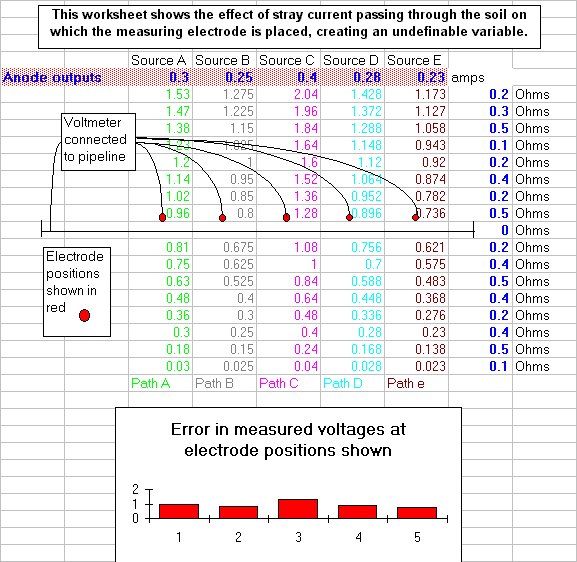
Others had blamed operator error and then poor instrumentation for the anomalies in the readings but it was then recognised that there is another voltage included in the reading and this has been named the 'IR drop in the soil'.
The off potential measurement.
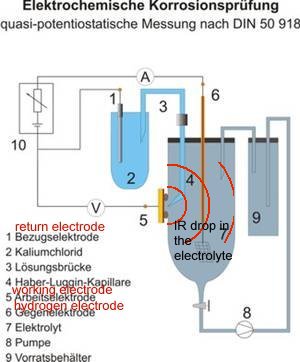
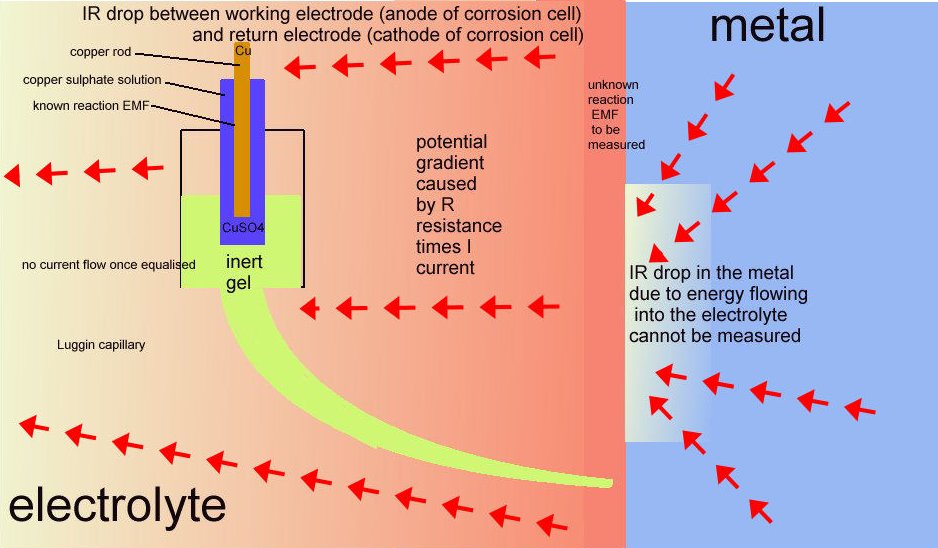
However this name is given by scientists to the area in the container of the 'working electrode' or anode of the cell that is described in DIN50918 and NOT to the potential gradient that can be measured in cathodic protection field work.
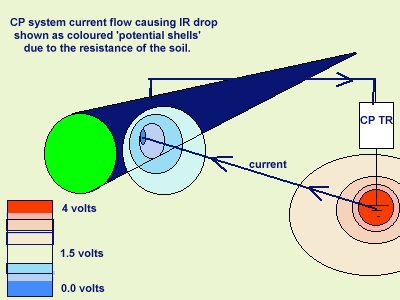
The voltage drop in the soil is described by real scientists as due to the current passing through shells of resistance towards the lower potential.
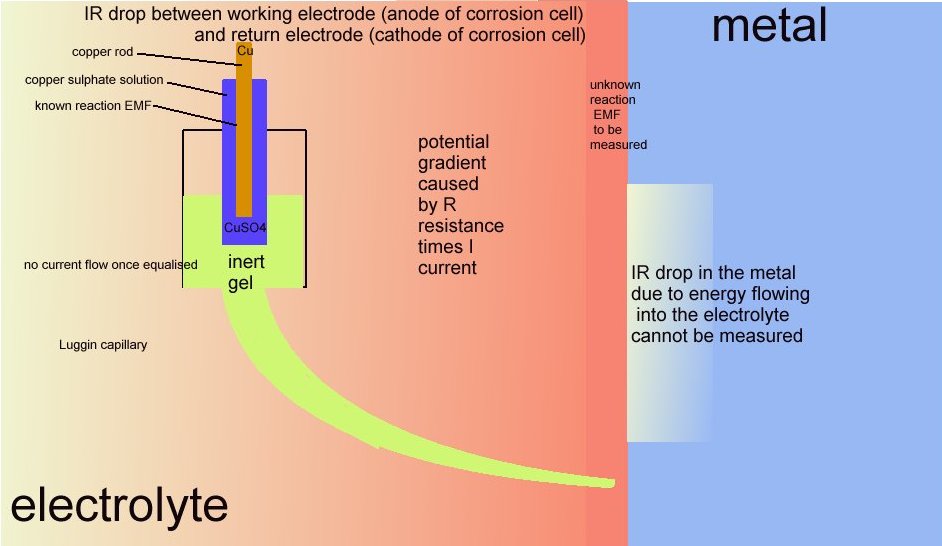
It is more correctly described as a potential gradient as it can be measured and plotted, whereas an IR drop in the container of the DIN50918 test cannot be measured, hence the need for the Lugun capillary..
It was thought that improved instrumentation could remedy this problem and a whole range of new meters were offered onto the market.
New Instrumentation
The problem remained and about twenty years ago, a theory was developed that it would be possible to eliminate the error in pipe-to-soil potential readings by removing the CP current flowing onto the pipeline.
It was reasoned that it would be possible to measure the protected potential after the CP current is switched off and before the pipe 'de-polarised.
During my first stay in Nigeria at Port Harcourt, I attempted to obtain such readings, and found that there was no detectable de-polarisation curve on pipelines running through high resistance soils such as encountered at the land locations.
During a leave period, I visited Holland, and was taken by a senior Shell International Corrosion Engineer to a laboratory where the scientist in charge demonstrated the de-polarisation curve and the 'kick' which is the exact reading required by the academics, to satisfy the criterion for 'protection'.
I asked about high resistance environments and was told that they could not produce a polarisation curve or kick when the electrolyte resistance was above a certain level, which he was unwilling to specify at the time.
They showed me the experiment on which the 'off potential' is based and I went back to Nigeria to try to put it into practice. I found that the polarised potential measurement not possible in the field.
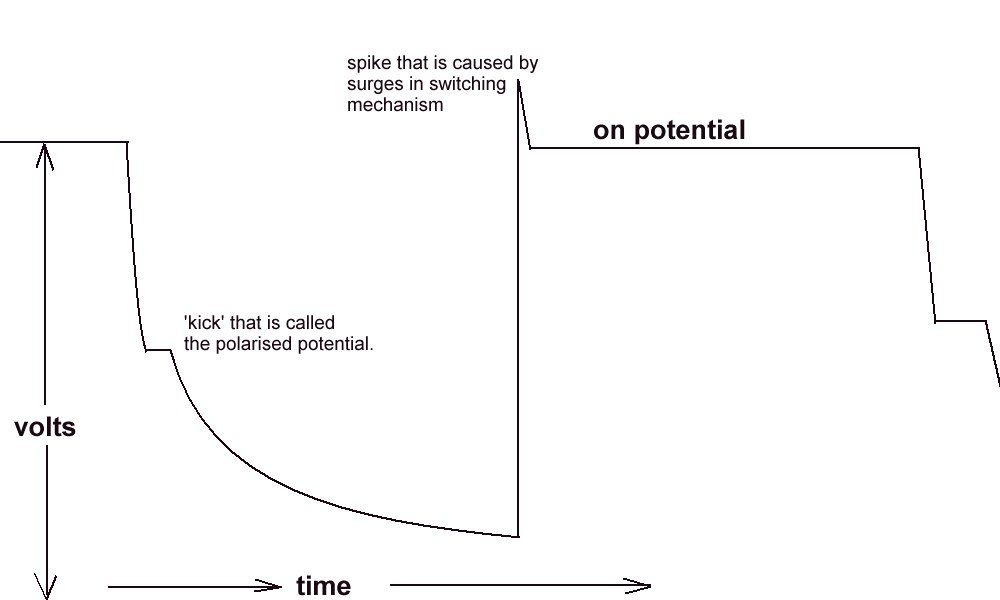
The polarised potential kick.
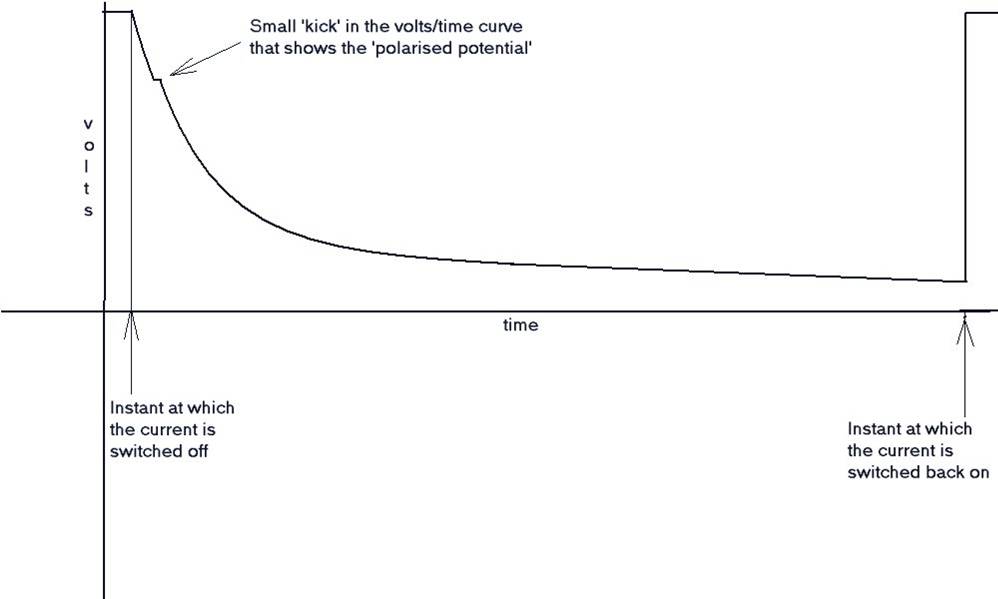
I have also tried to reproduce this kick in my laboratory using an osciloscope as well as a recording voltmeter. It can only be applied when there is a single corrosion cell and a single cathodic protection system.
There is also a very limited range of pH and resistivity of electrolyte in which the polarisation 'kick' can be observed.
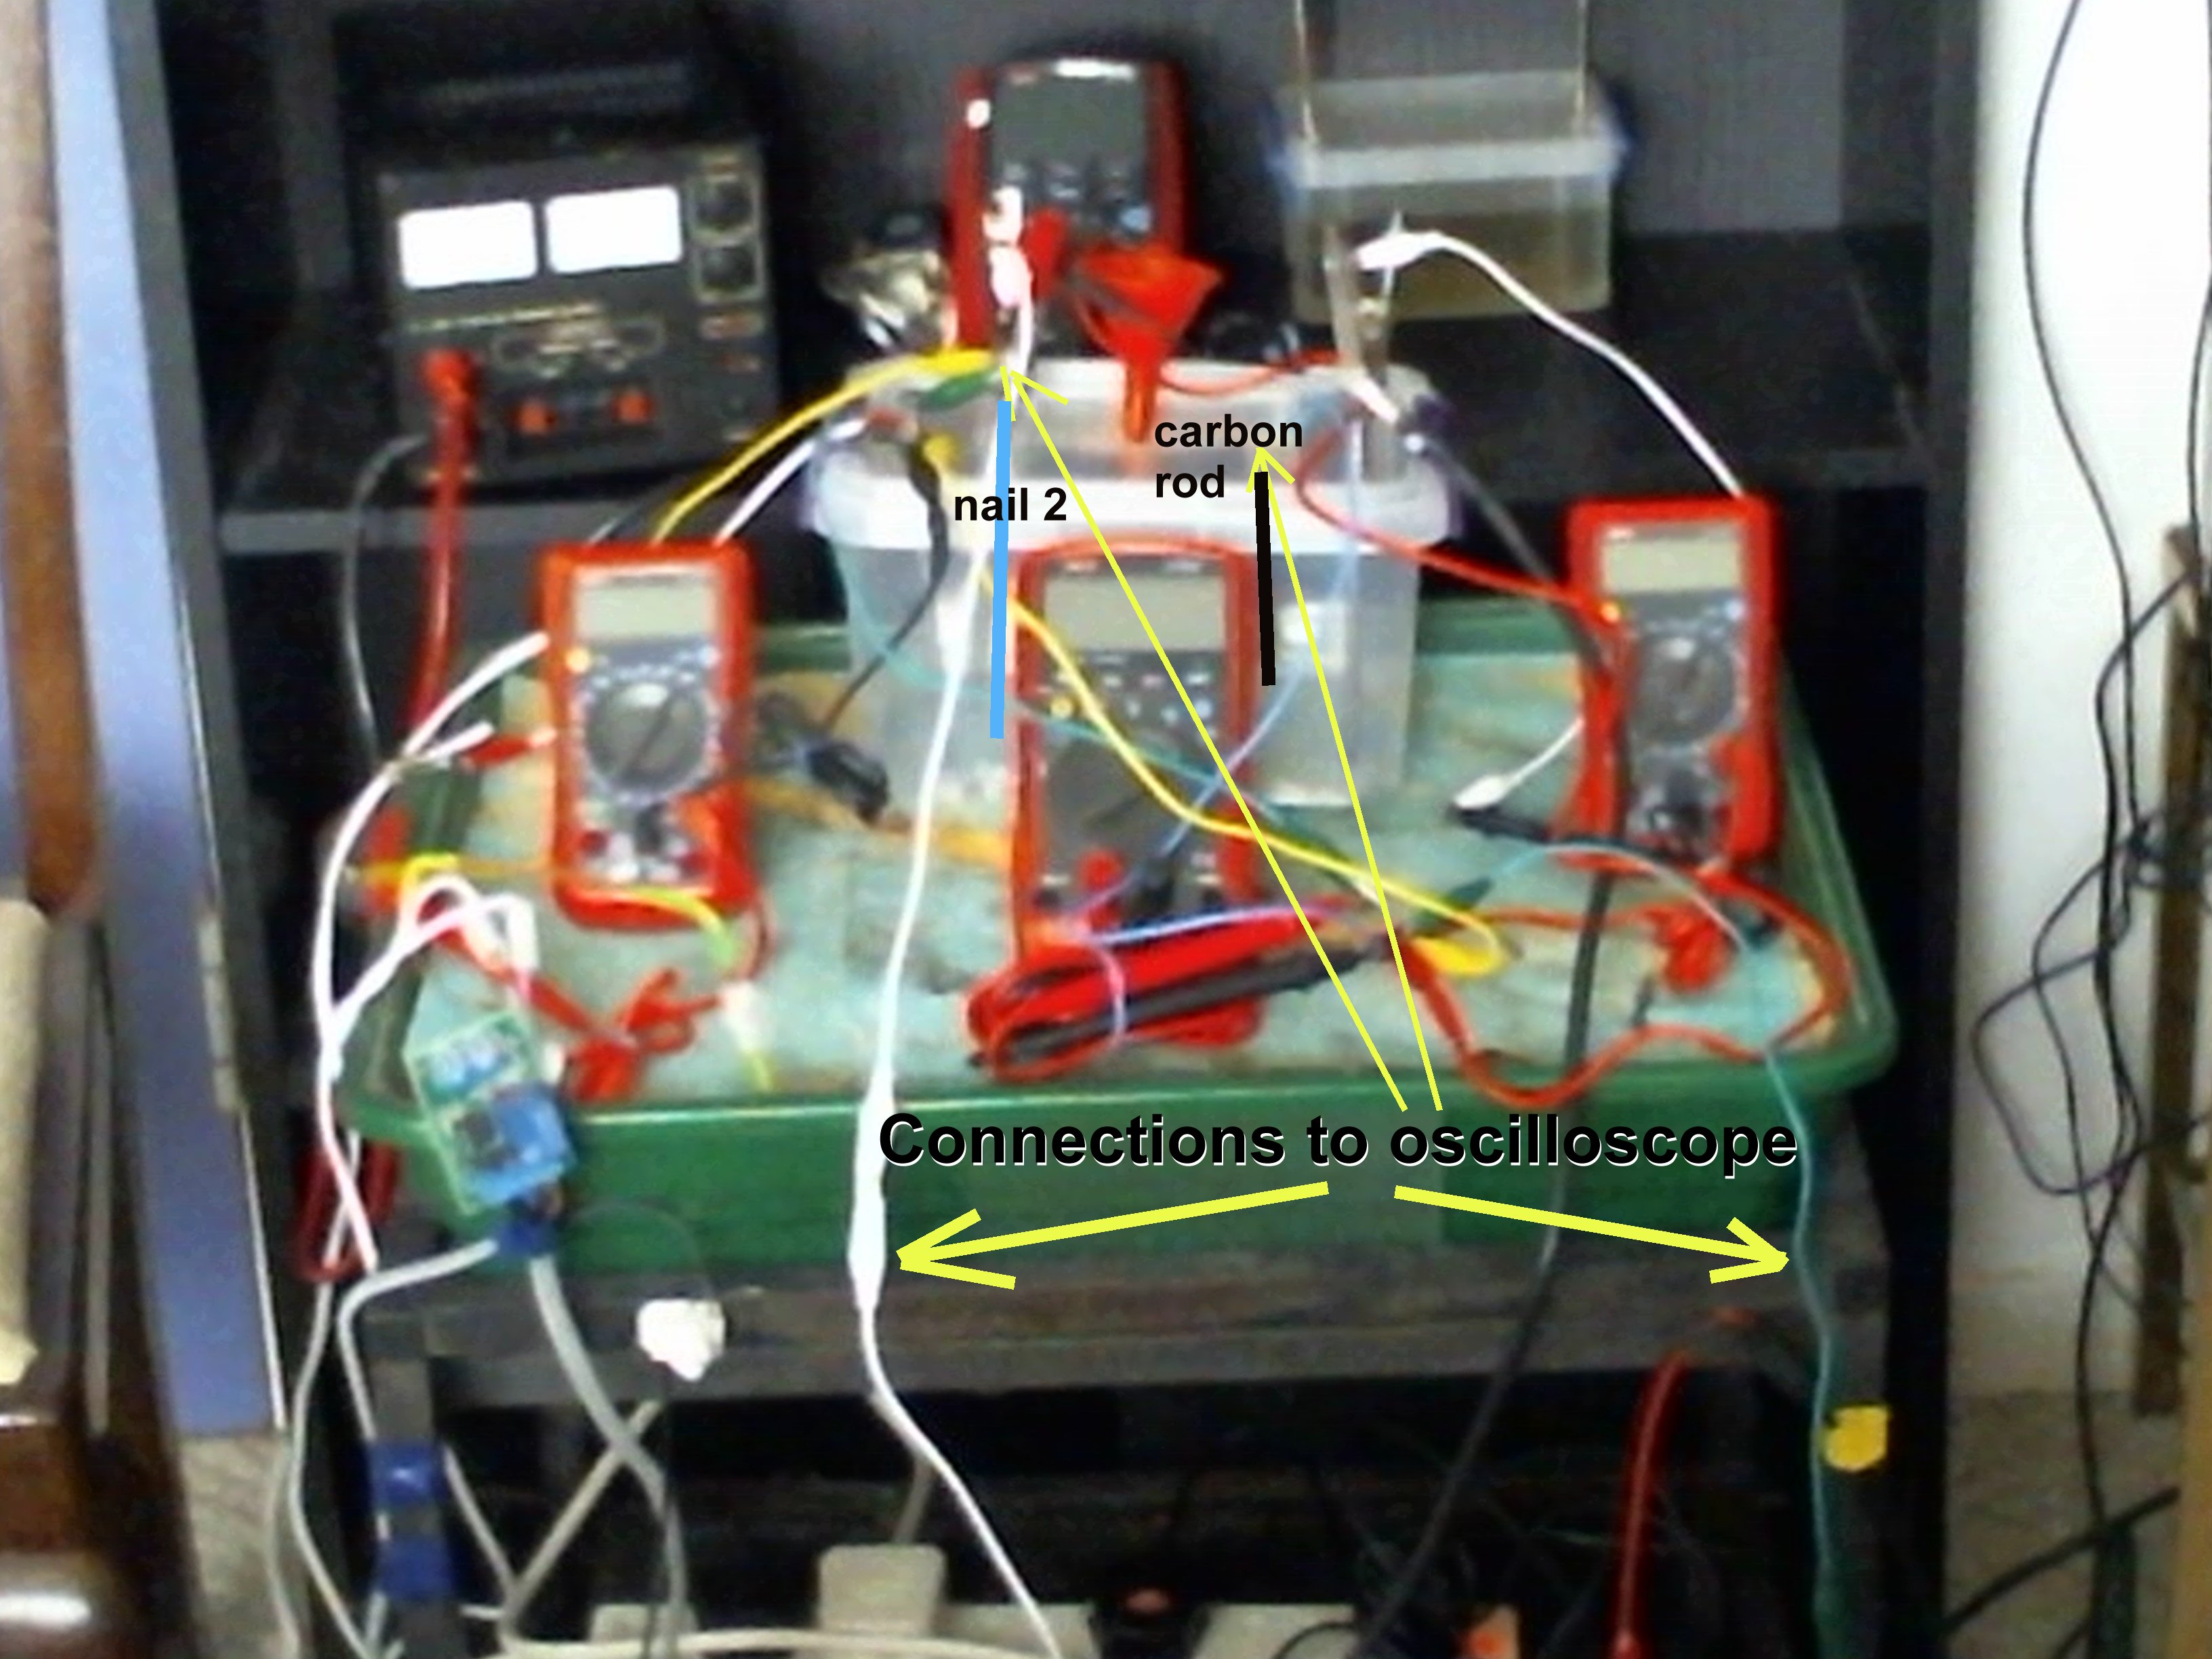
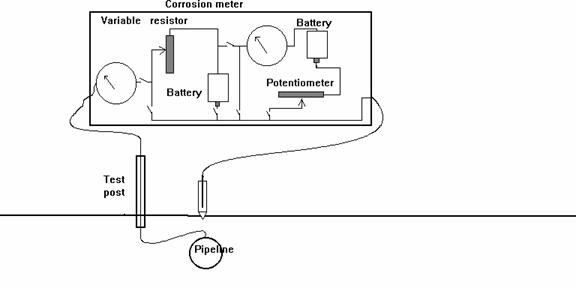
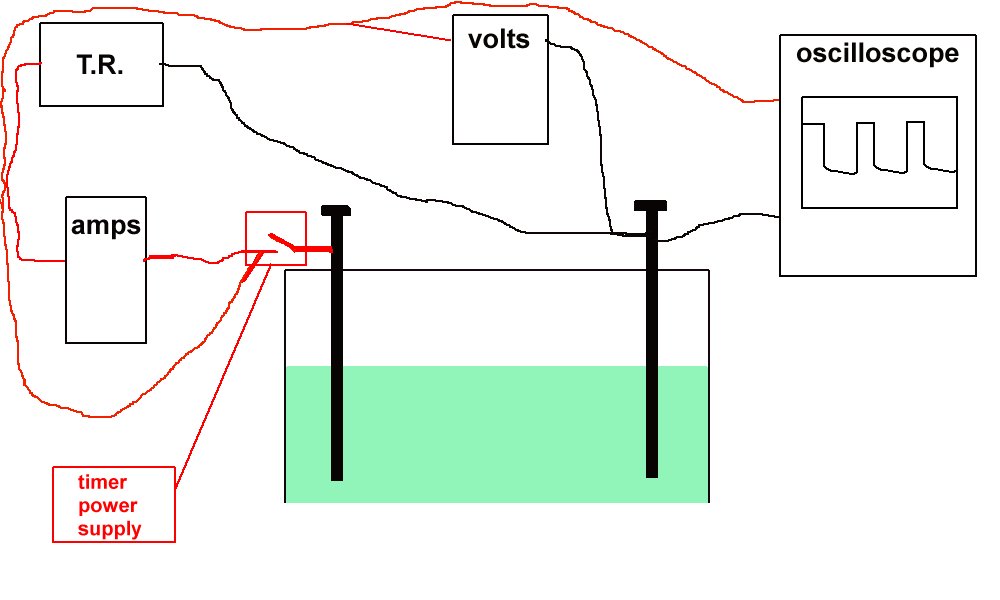
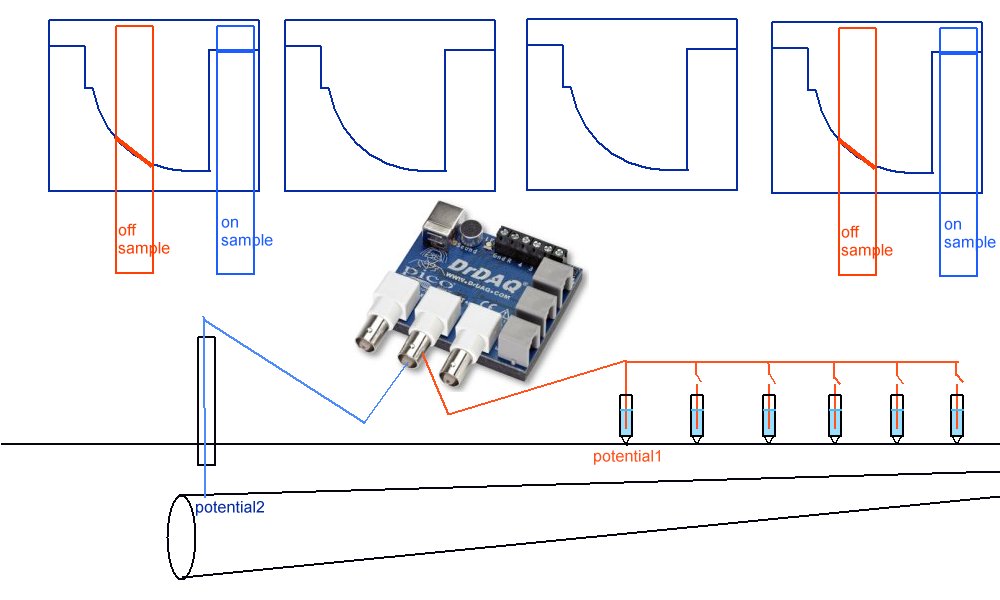
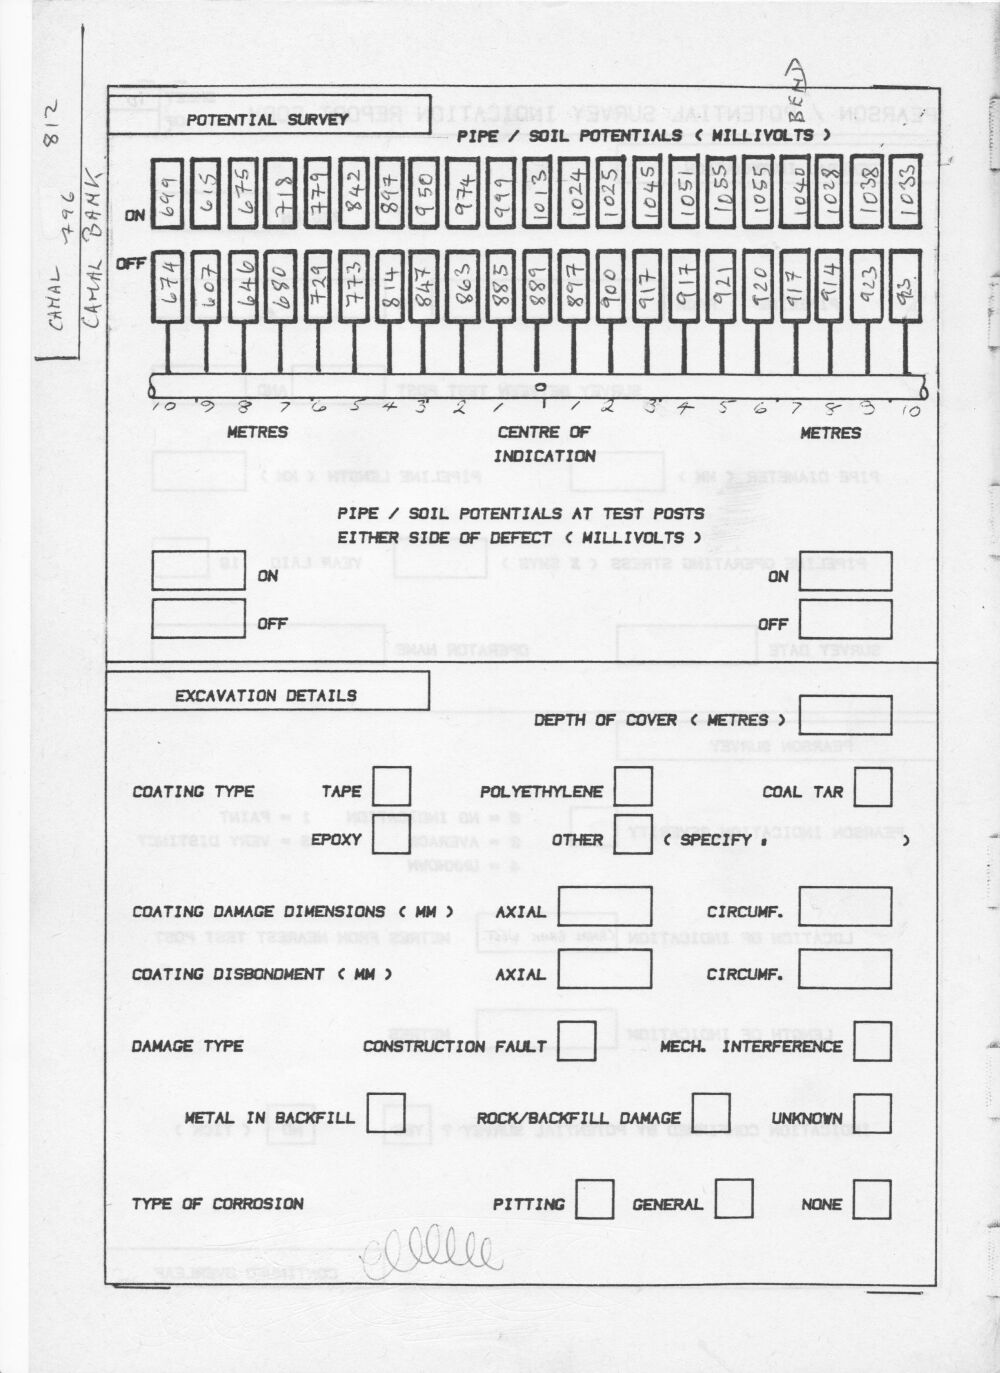
Schematic of experiment
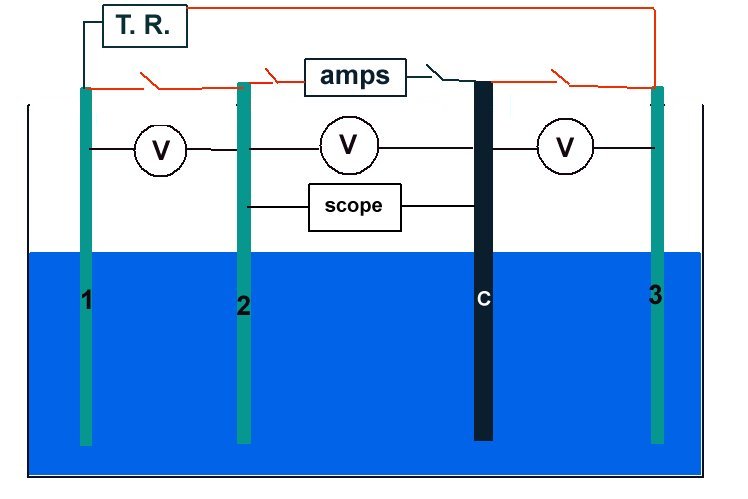
Sketch of the experiment.
I continued my own research and development
Mainstream cathodic protection specialists continued to try to justify the use of the 'half-cell' as a reference potential and provided synchronised switching for multi-transformer rectifier impressed current cathodic protection systems. These do not remove the errors and the results that are produced by CIPS surveys are faintly ridiculous.
We are looking for a waveform with a kick .
but what we are getting is this
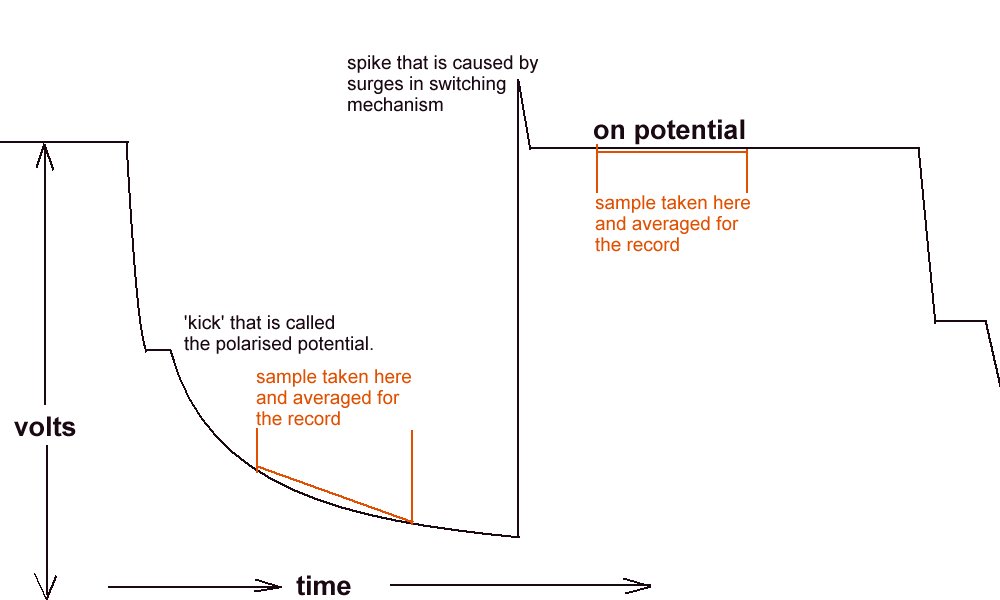
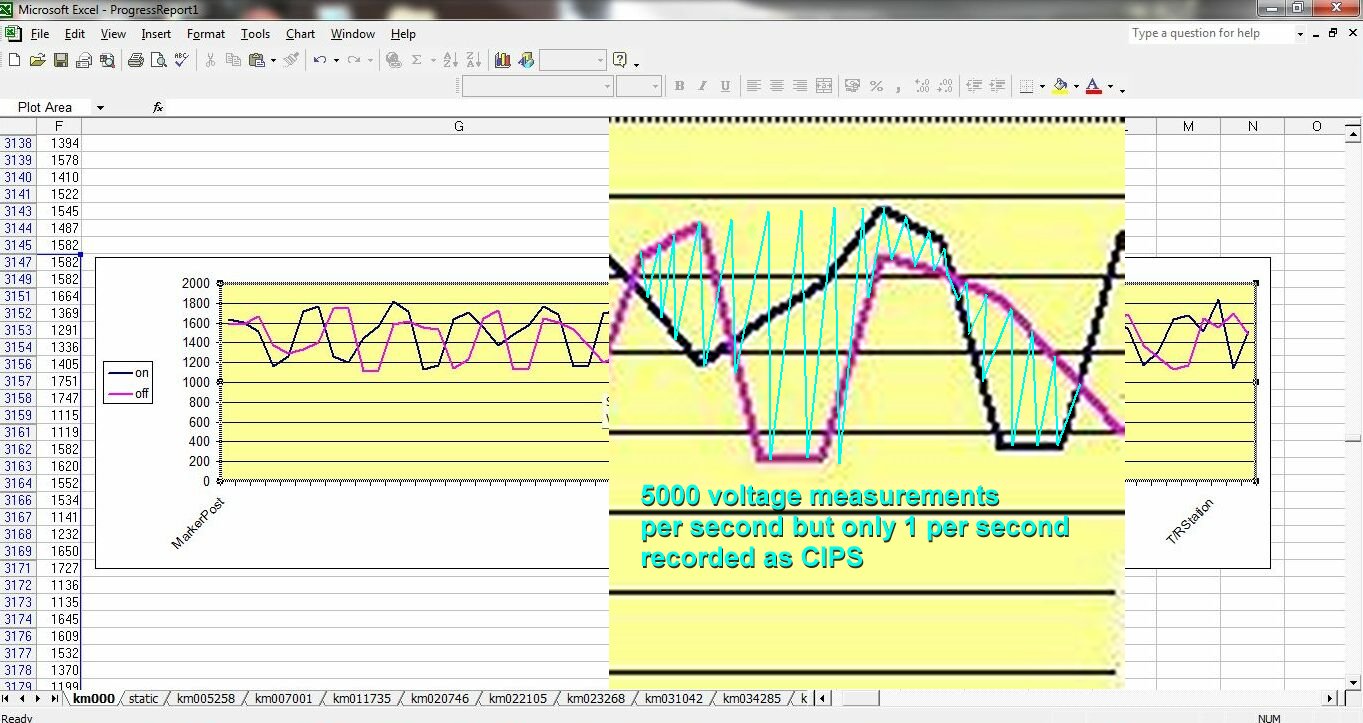
Because of the way the digital meters sample the voltages.
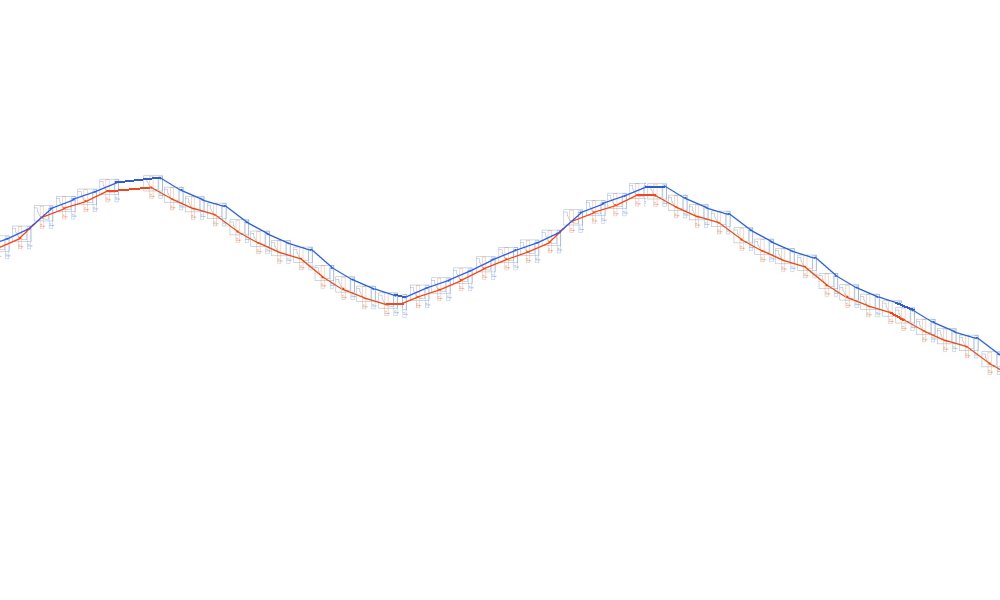
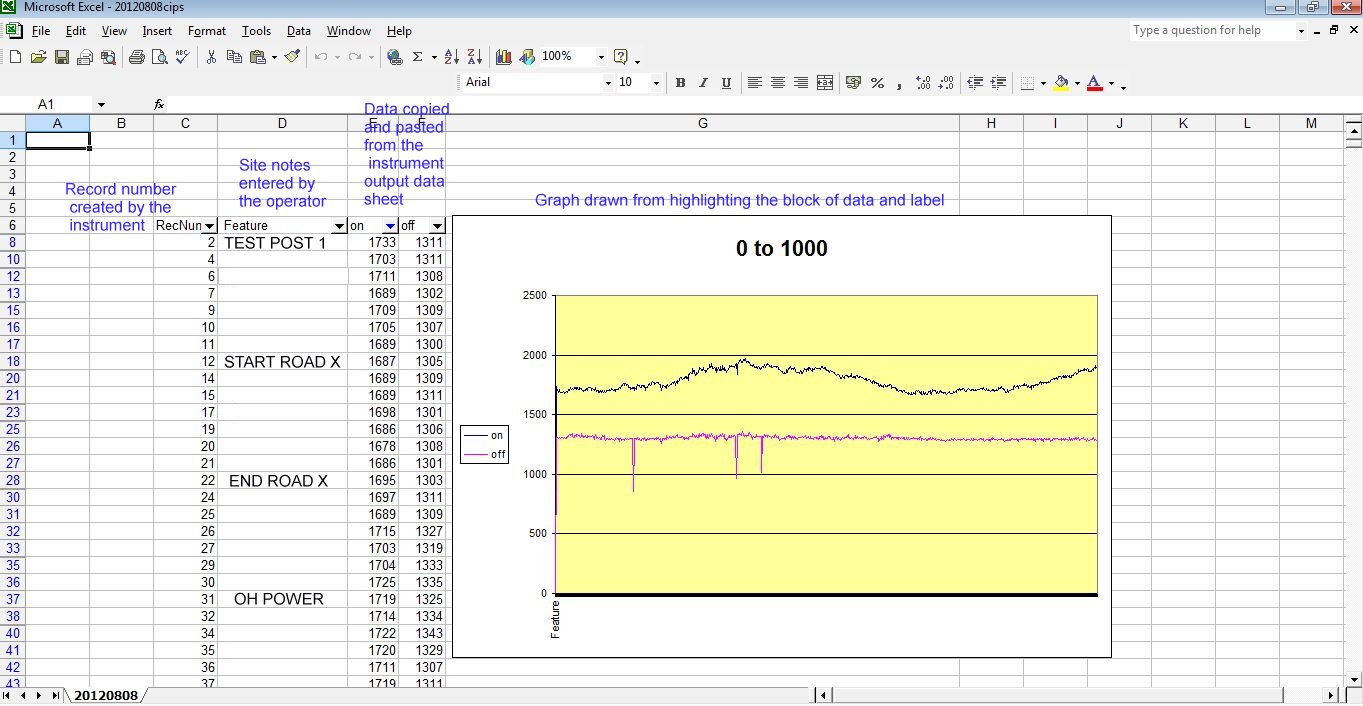
This is plotted by the software like this
The computer takes the highest and lowest as on and off.
and plots the 'trends' of each
A downward trend should really look like this.
and an upward trend is plotted like this.
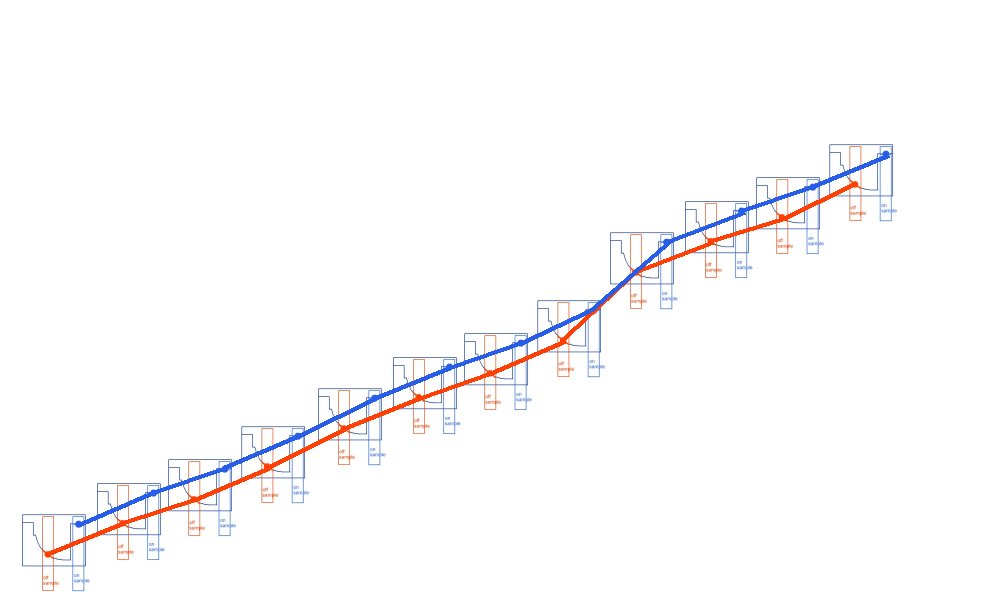
So what we see is this.
Instead of this
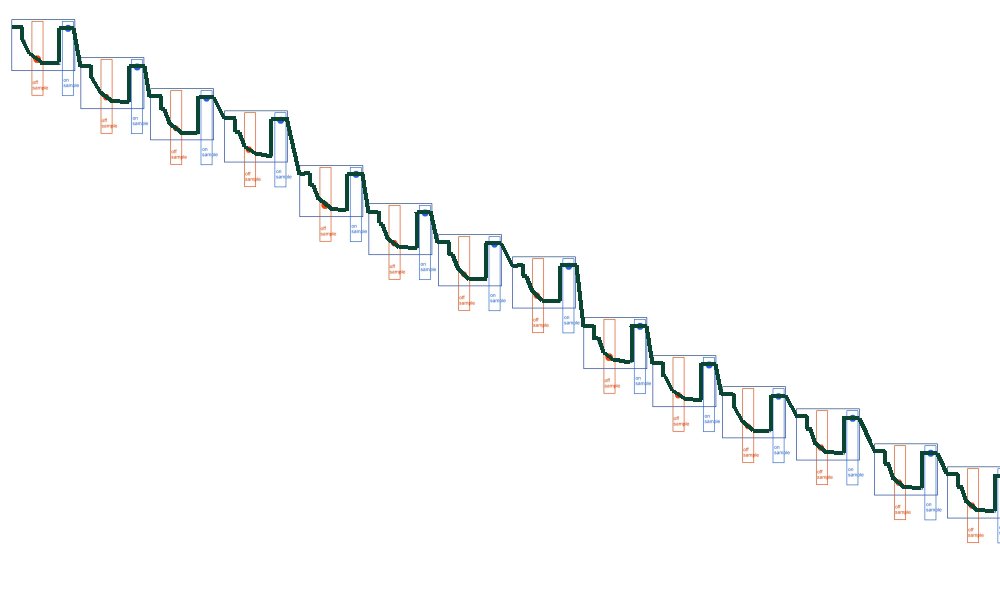
When what we should be looking for is the kicks in the wave forms
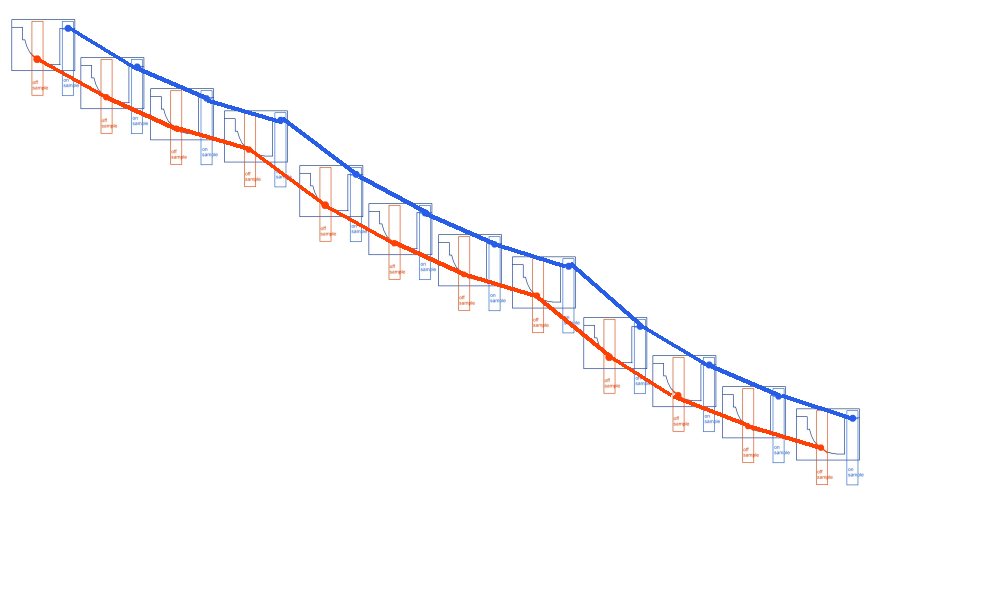
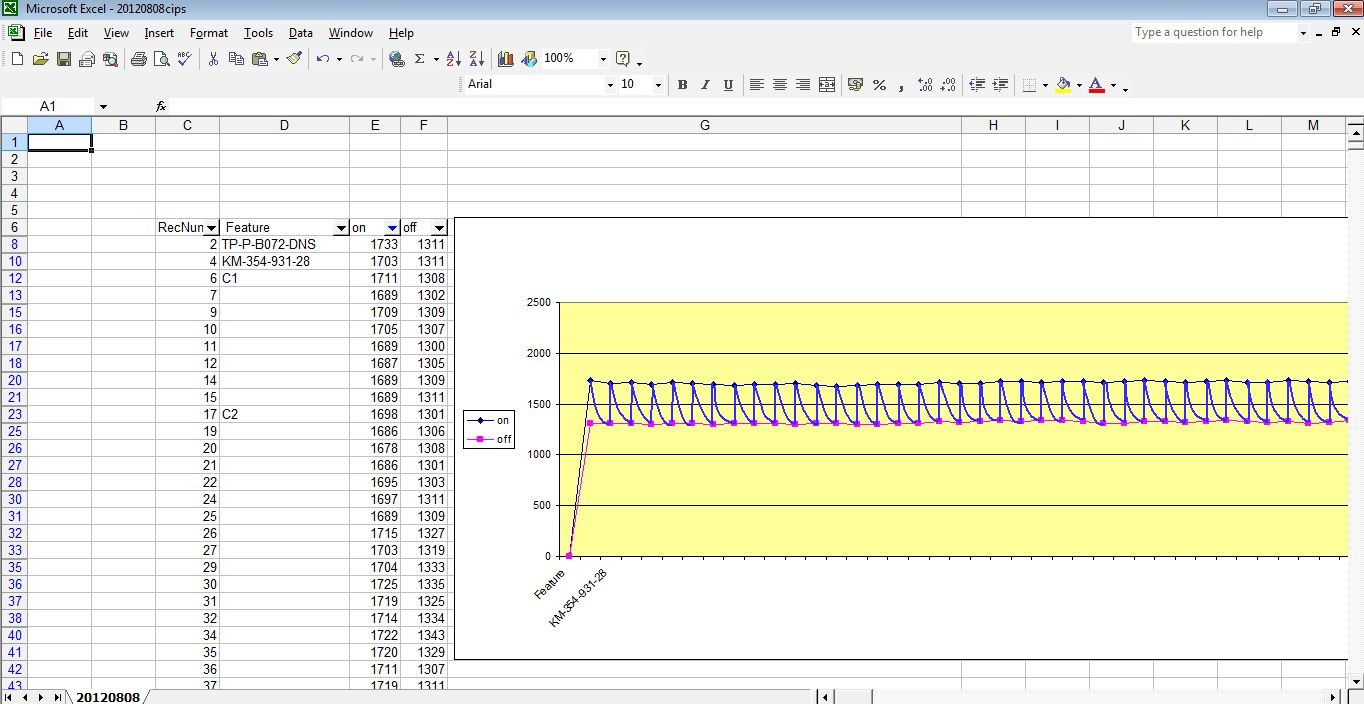
So we present our clients with this.
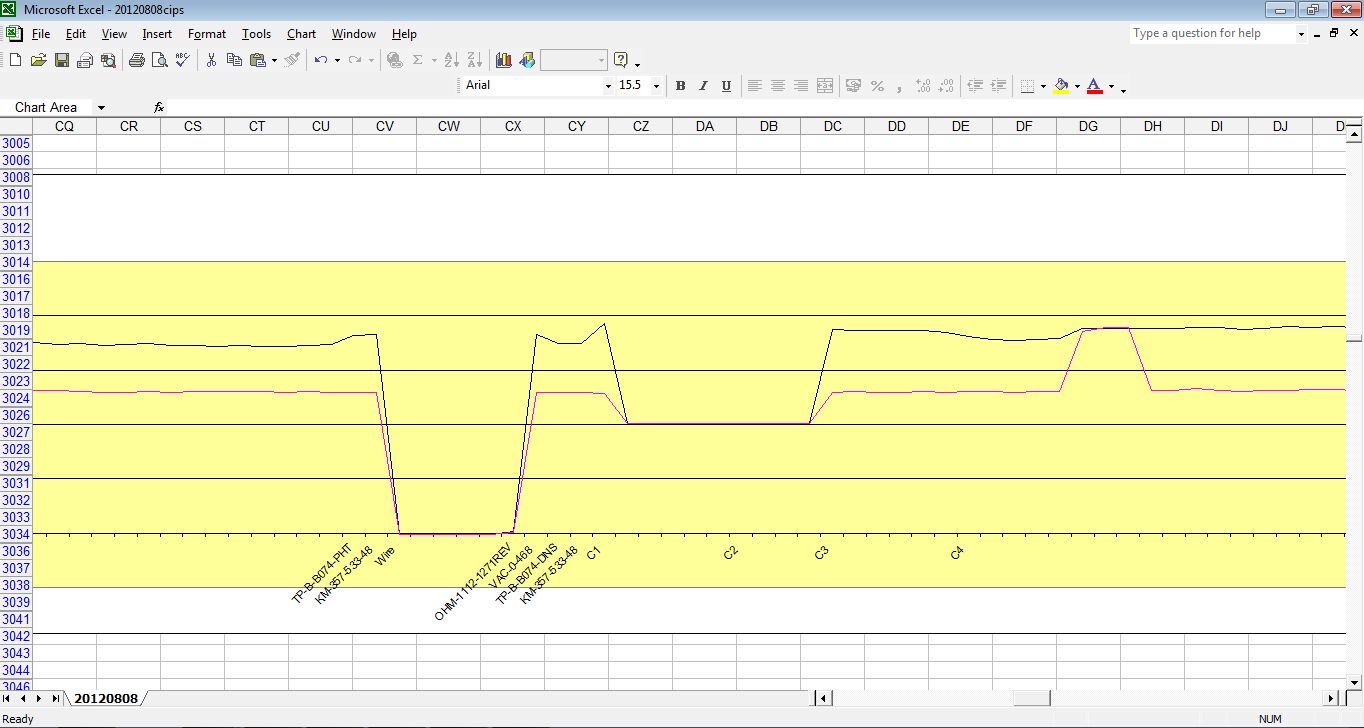
Which is really points joined in the wrong way.
The correct way being like this.
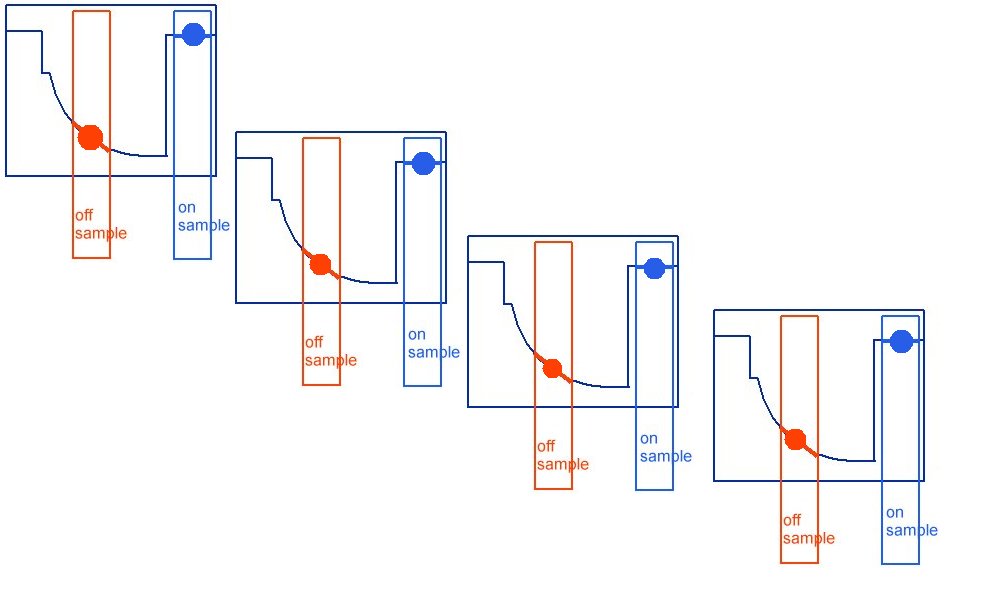
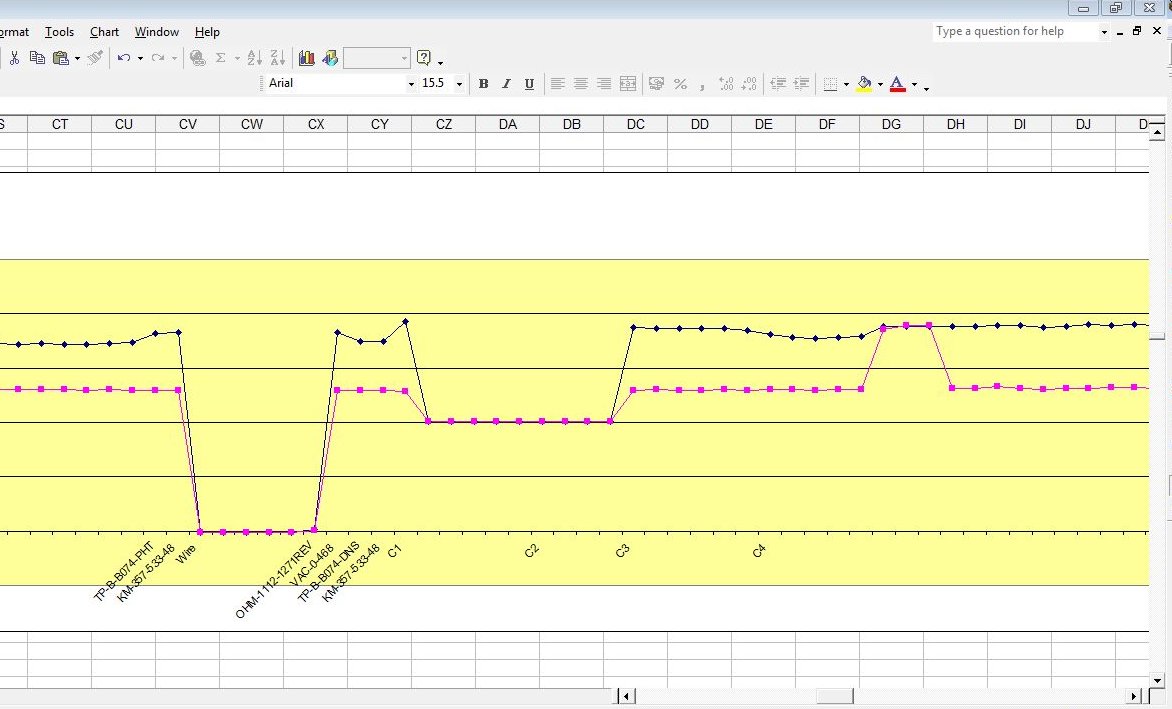
As can be seen when the on samples and off samples are recorded separately.
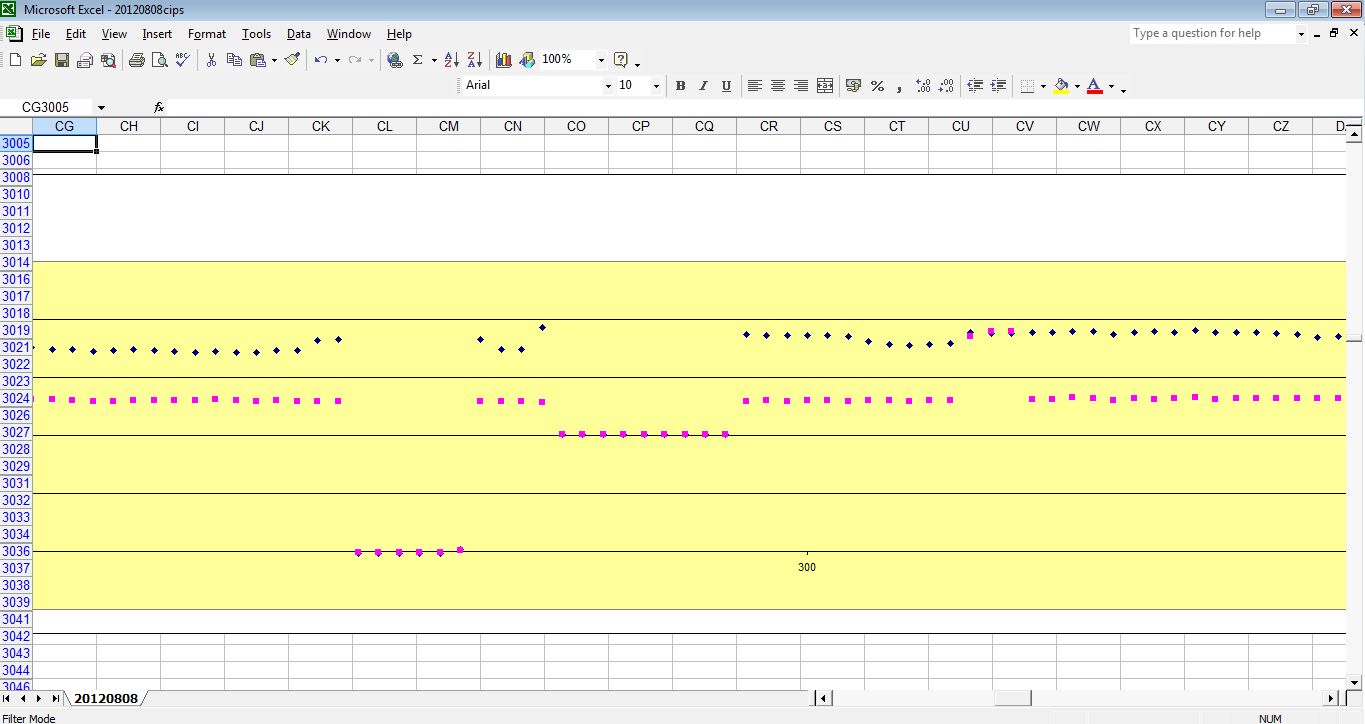
and the actual wave forms are shown.
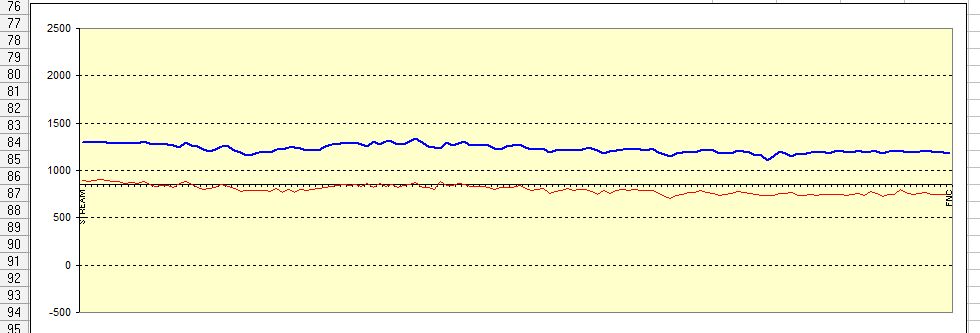
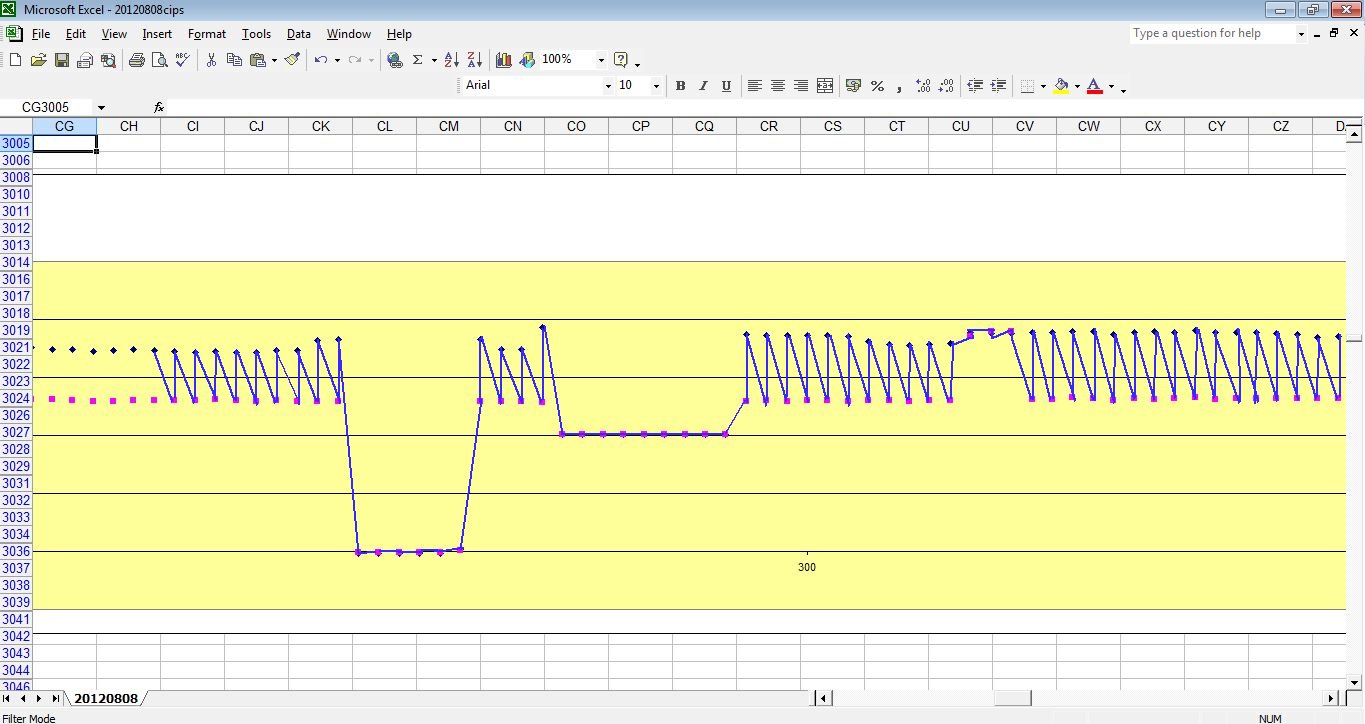
It is slightly ridiculous to suggest that we can detect the polarisation kick in such graphs.
and looking at the actual data that is gathered makes it even less credible.

No stretch of the imagination can suggest that the millions of 'on' and 'off' voltages that I have examine can have anything to do with the corrosion status of the pipeline under examination.
The papers that I have read by NACE specialists confirm my opinions in this matter, and the fact that they have a variety of criteria, to be applied if others do not work , suggests a desperate attempt to justify a failed hypothesis.
Mainstream cathodic protection specialists recognise the errors in measurements but continue to refer to the Cu/CuSO4 electrode as a reference potential.
Close Interval Potential Surveys
I was engaged on the UK Gas Corporation project to audit the integrity of the natural gas distribution network in the North Thames area of London.
This was synchronous with the development the in-line vehicles known as intelligent pigs.
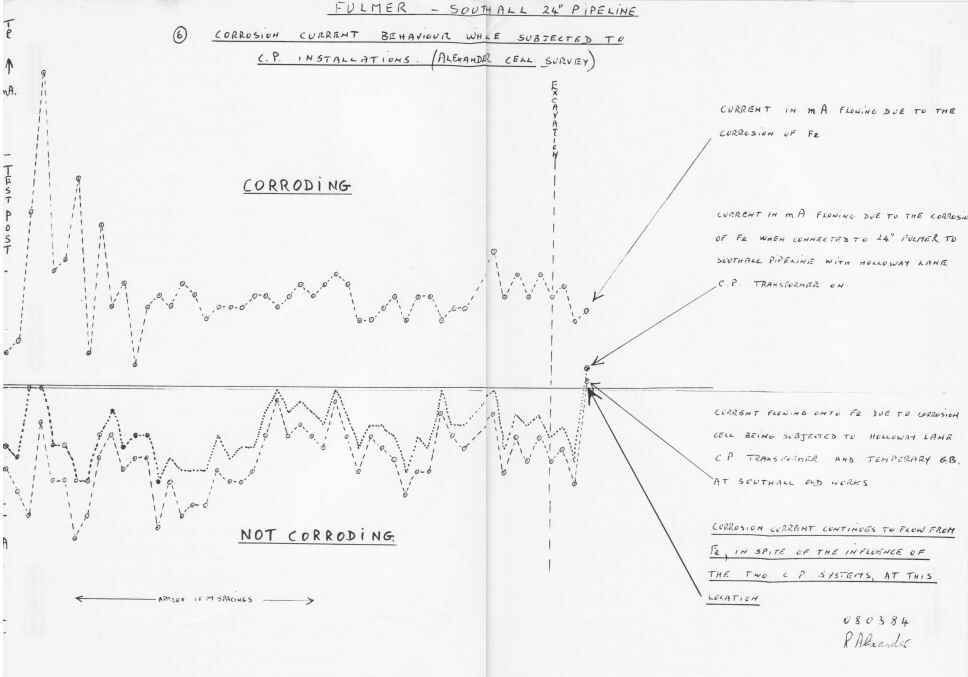
Using the Alexander Cell and incorporating DCVG I was able to report on 100 excavations over a four year period with 100% accuracy before the excavation revealed the actuality.
My reports were sidetracked by those who had set up the audit as the procedures they proposed had not worked from the very start.
It was originally specified that three graph lines were plotted.
The top would be the switched on voltage
The next would be the switched off voltage
The next would be the difference between the on and the off.
It was anticipated that the difference would show where the cathodic protection was not preventing corrosion.
The difference plot was dropped
I was told that the plot of the difference was not as anticipated and that it was decided not to report it.
However at this time they included a DCVG survey at each location where there was a depression in both on and off readings.
I was also allowed to use the Alexander Cell at these locations and received a visit from Bob Greenwood one of the top scientists from the Gas Council ERS. They bought an Alexander Cell to test and I never saw the results.
The first Alexander Cell sold
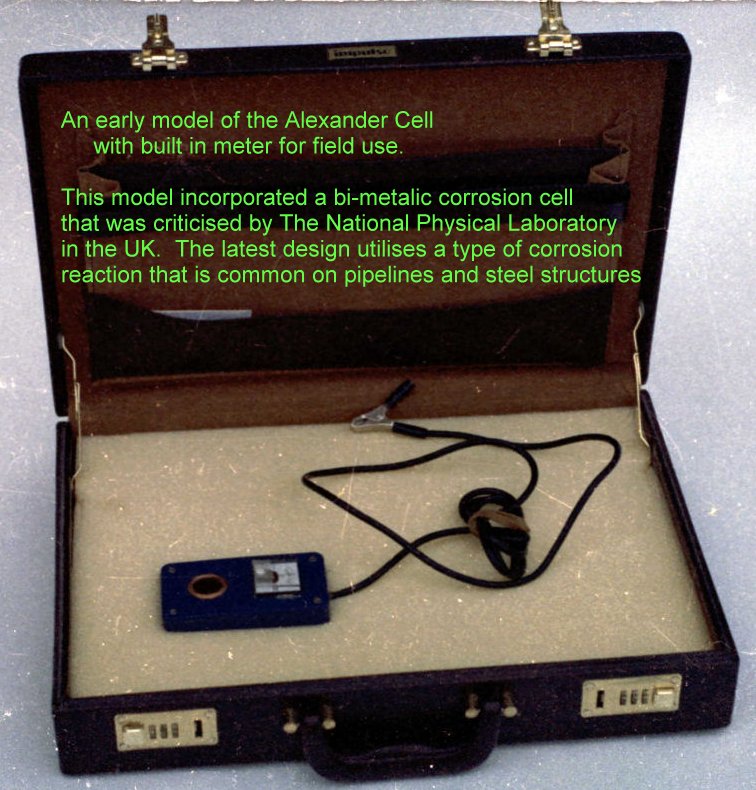
This was sold to British Gas ERS Dr Bob Greenwood who had witnessed it in the field.
The results of it's use in the field were 100% as predicted and reports were sent to the highest point of reference in British Gas at the time.
I was told that I was out of order to send one of these reports to another department.
The Alexander Cell was suppressed
I get asked why the Alexander Cell is not in general use from the time of invention and have documentary evidence that it was deliberately suppressed but those who were marketing the concept that the Cu/CuSO4 electrode is a suitable reference potential for use in applied cathodic protection.
This is even more apparent today as NACE claims 30,000 members and most of their studies and papers include a mention of measurements and formulae based on the pipe-to-soil potential.
When these measurements are used in conjunction with real corrosion they are seen to be in gross error.
The proposal that you can take a meaningful measurement when the cathodic protection is switched off is seen to be a wrong assumption.
The Alexander Cell shows the effect of both on and off cathodic protection measurements.
Cathodic protection is designed to be switched on.
It is impossible to make the off measurement that I witnessed in laboratories.
Cathodic protection systems alter the electrical equilibrium and corrosion status of all metal in the area of influence.
We must measure the effectiveness using real corrosion when the systems are in their normal condition ON